Abstract
Purpose
To extend a commonly employed, noninvasive arterial spin labeling (ASL) MRI method for measuring blood flow to evaluate lymphatic flow.
Materials and Methods
All volunteers (n=12) provided informed consent in accordance with IRB and HIPAA regulations. Quantitative relaxation time (T1 and T2) measurements were made in extracted human lymphatic fluid at 3.0T. Guided by these parameters, an ASL MRI approach was adapted to measure lymphatic flow (flow-alternating-inversion-recovery lymphatic water labeling; 3×3×5 mm3) in healthy subjects (n=6; 30±1 yrs; recruitment duration=2 months). Lymphatic flow velocity was quantified by performing spin labeling measurements as a function of post-labeling delay time and measuring the time-to-peak of signal in axillary lymph nodes. Clinical feasibility was evaluated in Stage II lymphedema patients (n=3; 60yr/F, 43yr/F, 64yr/F) and control subjects with unilateral cuff-induced lymphatic stenosis (n=3; 31yr/M, 31yr/M, 35yr/F).
Results
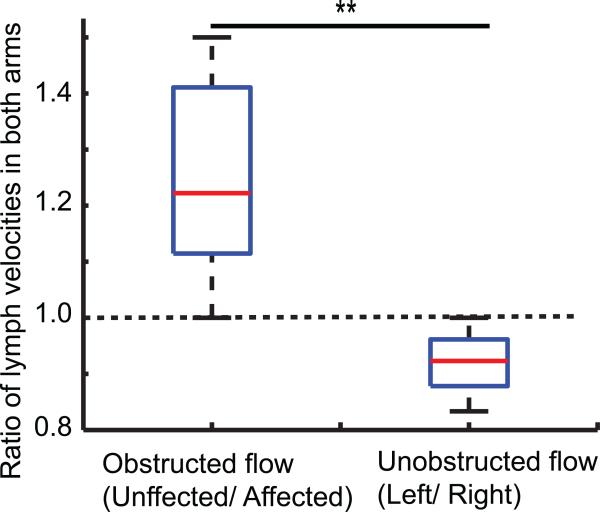
T1 and T2 of lymphatic fluid at 3.0T were 3100±160 ms (range=2930-3210 ms; median=3200 ms) and 610±12 ms (range=598-618 ms; median=610 ms), respectively. Healthy lymphatic flow (afferent vessel to axillary node) velocity was found to be 0.61±0.13 cm/min (n=6). A reduction (P<0.005) in lymphatic flow velocity in the affected arms of patients and the affected arms of healthy subjects with manipulated cuff-induced flow reduction was observed. The ratio of unaffected to affected axilla lymphatic velocity (1.24±0.18) was significantly (P<0.005) higher than the Left/Right ratio in healthy subjects (0.91±0.18).
Conclusion
This work provides a foundation for clinical investigations whereby lymphedema etiogenesis and therapies may be interrogated without exogenous agents and with clinically available imaging equipment.
Introduction
Breast cancer treatment related lymphedema is characterized by chronic, incurable swelling of the arm and occasionally the trunk following axillary lymph node dissection and represents a major health concern in developed nations (1). Of approximately 2.3 million breast cancer survivors in the United States, 19-49% of patients undergoing axillary lymph node dissection and radiation therapy develop lymphedema (2-4). Identification of subclinical lymphedema has demonstrated that only 7% of patients receiving structured physical therapy develop lymphedema in the first year, relative to 25% of physical therapy-negative controls (5). Therefore, early identification of patients at high risk for lymphedema is critical, yet cost-effective screening that does not require specialized equipment is required for widespread implementation (6).
Recently, lymphatic contractility and pumping have been measured using 99mTc nuclear imaging, demonstrating that reduction in lymphatic velocity is proportional to the severity of swelling, and that inter-subject variability in lymphatic pump failure may contribute to lymphedema risk (7). However, routine clinical implementation of comparable CT (8, 9), optical (10), and MR lymphangiography (11) techniques is complicated by requirements for ionizing radiation, specialized optical probes and fluorophores, and/or exogenous contrast agents, respectively (6). Thus, radiological screening could greatly benefit from procedures that provide comparable information, yet can be more easily implemented.
MRI has been widely applied to evaluate fluid transport in several contexts, yet noninvasive MRI techniques for assessing lymphatic flow remain under-developed. Importantly, even basic measurements of relaxation times of human lymphatic fluid (T1 and T2) at current imaging fields have not been published to our knowledge, thereby precluding rigorous quantification of lymphatic contrast. However, the principles of lymphatic flow are analogous to those of blood and CSF flow, physiological phenomena successfully measured with MRI for more than two decades (12-14). The lymphatic system is unidirectional and open-ended, where lymphatic fluid is carried to lymph nodes via lymphatic collectors through forces supplied by smooth muscle contractions. Thus, noninvasive arterial spin labeling (ASL) MRI approaches commonly employed to magnetically label blood water and quantify blood flow and tissue perfusion, that have been used clinically in oncology (15), cerebrovascular disease (16-18), and cognitive neuroimaging (19, 20), should translate to lymphatic imaging. The major obstacles include (i) slower velocity of lymph relative to blood and (ii) increased field heterogeneity and radiofrequency (RF) labeling inefficiency in extremity regions. We hypothesize that these difficulties can be alleviated (i) because of the longer lymphatic water T1 relative to blood water T1, and (ii) by applying new hardware advances, including multi-channel receive coils in conjunction with parallel RF-transmit technology, to detect and label lymphatic water over small regions with high efficiency.
The purpose of this study is to extend a commonly employed, noninvasive arterial spin labeling (ASL) MRI method for measuring blood flow to evaluate lymphatic fluid transport.
Materials and Methods
Institutional Review Board (IRB) approval was obtained. All healthy subjects and patients provided informed, written consent. Approximately 200 mL of lymphatic fluid was acquired on three different dates and times from a patient (16yr/F) with a congenital deep lymphatic impairment requiring an abdominal lymphatic shunt, permitting self drainage of lymphatic fluid collection. The fluid was immediately transferred to a sterile container, de-identified, maintained at physiological temperature, and transported to the imaging facility. As the lymph sample would be typically discarded as waste and the sample was de-identified prior to being brought to the imaging institute, this aspect of the study was determined by the IRB not to qualify as human subject research. The study was in compliance with Health Insurance Portability and Accountability Act (HIPAA) regulations.
Relaxation Time Measurements
Lymphatic fluid experiments were conducted within approximately 30 minutes of fluid extraction on a Philips 3.0T scanner (Philips Medical Systems, Best, The Netherlands). The fluid sample was maintained at body temperature using a warm water bath throughout scanning. A thermo-chromic thermometer (Apothecary Products, Inc, Minneapolis, MN) was used to monitor sample temperature.
T1 Measurement
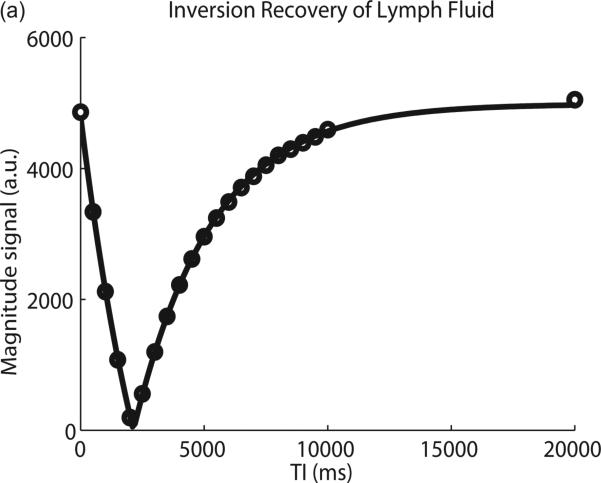
Images were acquired at different inversion times (TI; range = 0 to 10,000 ms at an interval of 500 ms), as well as at a long TI = 20s for equilibrium magnetization calibration. Other parameters: TR/TE = 40,000/28 ms, spatial resolution = 3 × 3 × 5 mm3, single shot echo-planar-imaging (EPI), with 16 ms hyperbolic-secant adiabatic inversion prepulse. Inversion pulse duration and B1 were optimized for efficiency prior to T1 measurements. T1 was calculated using a three-point fit of the magnitude signal (S) to:
| [1], |
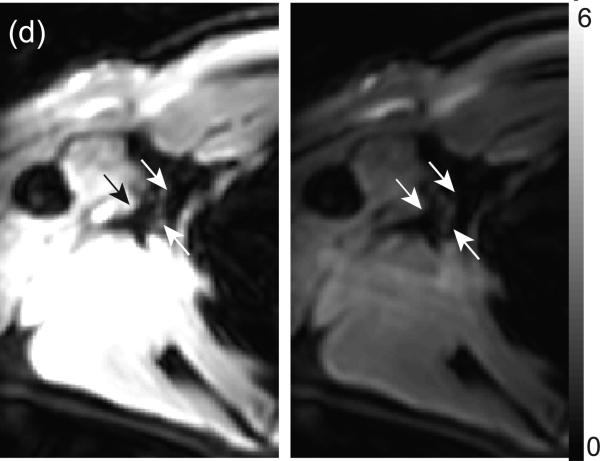
where So is the equilibrium signal intensity, S(TI) is the magnitude signal intensity, and θ is the inversion angle. To confirm that the T1 of the lymphatic fluid samples were representative of lymphatic water T1 in the axilla, an inversion recovery experiment was performed in a healthy volunteer, choosing the TI such that Mz(TI)/M0=(1-2e-TI/T1+e-TR/T1)=0, where T1=measured lymphatic water T1, and repetition time (TR)=4s. Signal-to-noise ratio (SNR) measurements were made for images with (denoted: nulled) and without (denoted: not-nulled) the inversion prepulse, and compared to measurements in a free form region of noise (160 voxels) within the surrounding lung cavity. Therefore, this is similar to a FLAIR experiment, but with the TI choice chosen to correspond to the presumed lymphatic water Mz null point, rather than CSF Mz null point.
T2 Measurement
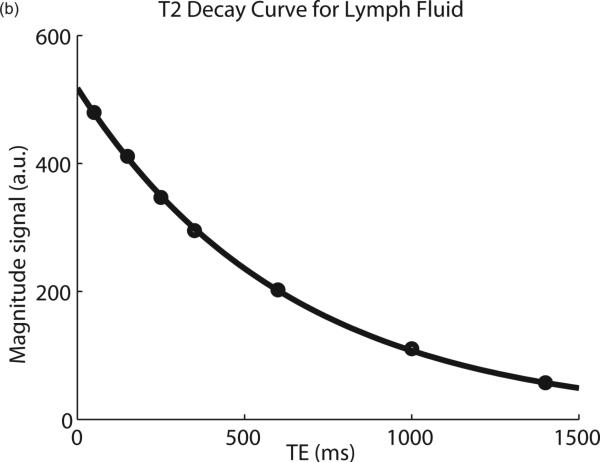
Eight images, each at a different TE, were acquired with a multi-echo, spin echo EPI sequence. Data were oversampled during the period of maximal signal decay, yielding TE-points at 50, 150, 250, 350, 600, 1000, and 1400 ms. Other parameters: TR = 2500 ms, spatial resolution = 3 × 3 × 5 mm3. T2 was quantified using the mono-exponential equation:
| [2]. |
For the first sample, the range of TEs was still under optimization and was too low (0 – 200 ms) to enable accurate T2 measurements. Thus, only the second and third samples were used for T2 calculations.
Spin Labeling Measurements in Unobstructed Lymphatic System
The idea for spin labeling MRI is to acquire two sets of images, with and without magnetic labeling of inflowing water. After the labeling prepulse, a TI is allowed (generally 1-2s) which describes the amount of time after labeling and before acquisition. By comparing the difference in image contrast between the labeled and unlabeled scans, a flow-weighted image can be obtained. For perfusion, the difference image signal is small at only 1-2% of maximal signal; this signal arises from the small amount of perfusion-weighted contrast relative to total signal intensity and the decay of the magnetic label with blood water T1. For 3.0T blood water, T1≅1600 ms (21), however longer T1 would increase SNR, and allow spin labeling to be performed for low velocity scenarios.
Experiments were performed in healthy subjects at 3.0T (n=6; 2M/4F; age=30±1 yrs). To accurately identify the location of axillary nodes, a diffusion-weighted inversion with background suppression (DWIBS) scan was utilized (spatial resolution = 3×3×5 mm3, b = 800 s/mm2, TR/TE/TI=8037/49.79/260 ms), which shows high contrast between lymph nodes and surrounding tissue. For all acquisitions, a dual-channel (parallel B1) body coil and 16-channel torso coil were used for RF transmission and reception, respectively. Next, a spin labeling approach with the same slice geometry and an alternating slice-selective and non-selective (22), hypersecant 11 ms inversion prepulse was used, followed by a TI range of 500 ms - 8000 ms, in 500 ms increments, to quantify transit time (23). The above, pulsed spin labeling approach was chosen in favor of pseudo-continuous labeling owing to the low velocity of lymphatic fluid and the difficulty of meeting flow-driven inversion criteria with high efficiency (24). A spectral presaturation with inversion recovery (SPIR) prepulse that was frequency selective for fat was used (7.5 ms; bandwidth=190 Hz) for optimized fat suppression immediately before the RF excitation for the slice acquisition. Other scan parameters: TE= 4 ms, spatial resolution=3×3×5 mm3, SENSE-factor=2, half-scan factor = 0.6, averages=9, single-shot gradient echo EPI. Flow-weighted maps were obtained by subtracting the non-selective inversion image from the slice-selective inversion in pair-wise fashion (ΔM), and normalizing by equilibrium magnetization, M0. M0 was calculated using an inversion recovery image from the longest TI point. The DWIBS image was used to identify the location of the axillary lymph nodes, for the subsequent spin labeling experiment. Finally, with the adiabatic inversion pulse used here, we experimentally determined that the RF-spillover / spatial tagging inefficiency was approximately 0.5 mm, or 10% of the slice thickness. Therefore, the lymph velocity entering the node is estimated according to 0.5 mm / time-to-peak (TTP). Reproducibility, inter-rater variability, and motion was also assessed and are addressed in Appendix I and II.
Spin Labeling Measurements in Obstructed Lymphatic System
Importantly, a lack of a reference standard for lymphatic imaging precludes a clear method for validating the lymphatic spin labeling measurements. Therefore, we performed additional (n=6) measurements with known, asymmetric lymphatic impairment. This included measurements in healthy subjects (n=3; age= 31yr/M, 31yr/M, 35yr/F) with a unilateral blood pressure cuff and clinical feasibility assessment in female patients (n=3; 60 yrs, 43 yrs, 64 yrs) with Stage II lymphedema secondary to unilateral breast mastectomy and radiation therapy. The ages of these groups were not matched, as the purpose of this experiment was not to specifically compare between groups, but rather to demonstrate asymmetric lymphatic velocity under varying conditions of known lymphatic impairment. Additionally, this component of the study was simply to determine if altered lymphatic flow properties could be detected under conditions of obstructed lymphatic flow, rather than to provide a detailed description of the range of lymphatic obstruction in patients (which would require additional imaging data). All patients volunteered to participate in research by responding to research flyers posted at a local lymphedema clinic and were >6 months removed from their most recent radiation treatment. To simulate impaired flow conditions, lymphatic flow was obstructed in the left arm of the right-handed healthy subjects using a blood pressure cuff with pressure maintained at 60 mmHg. Note that as the cuff was applied unilaterally and all patients had unilateral lymph node dissection, the contralateral (unaffected) side was used as an internal control in all the subjects. Diastolic blood pressure in the healthy subjects was (range) 66-75 mmHg, confirming that venous occlusion would not occur (7). To allow for reduced flow scenarios in both the cuffed healthy subjects and patients, sampling was performed over a broader range of potential inflow times: 3500-10000 ms, sampled in 500 ms increments. To reduce the overall scan duration, the number of averages was decreased to 8, leading to a total scan duration of approximately 40 minutes. Specifically for the impaired flow study, data with short labeling delays (500 – 1500 ms) were not acquired since measuring blood flow was not the intent of these experiments, and extending the post-labeling delay range in such a manner would have added considerably to the total scan time. This approach allows us to measure the longer transit times and slow velocities of the obstructed lymph within a time feasible for a study in the clinic.
Since the sample sizes in this feasibility report are small, non-parametric testing was performed to assess significance of measured velocity differences in the unaffected vs. affected (Stage II lymphedema or cuff-obstructed flow) arms, as well as in the ratio of the affected-to-unaffected lymph-to-axilla velocity of patients vs. left-to-right lymph-toaxilla velocity in healthy subjects. Significance of the measurements was evaluated using the Wilcoxon signed rank test available within the MATLAB (Mathworks, Natick, MA). P-values criteria for significance was P<0.05.
Results
Relaxation Time Results
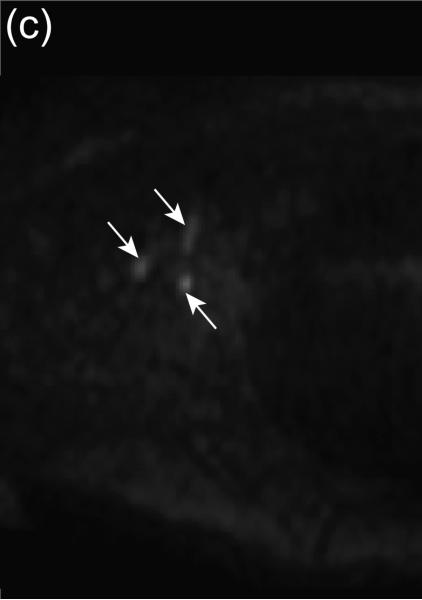
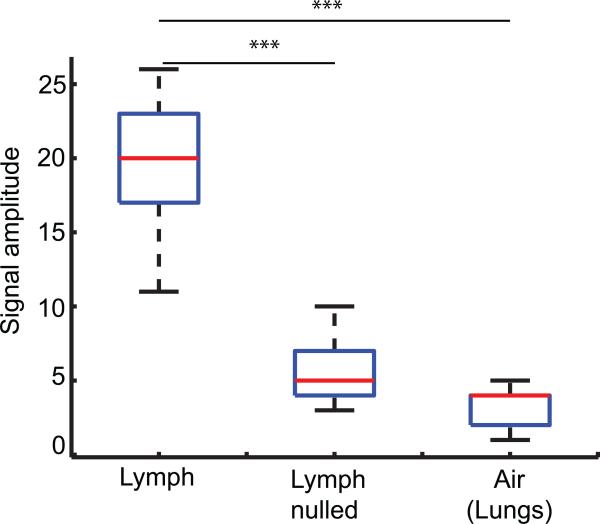
Figure 1 shows a representative inversion recovery curve obtained from a lymphatic fluid sample from which T1 was calculated as well as the signal intensity decay of the same sample as a function of TE, from which T2 was calculated. The T1 and T2 of lymphatic fluid at 3.0T were found to be 3100±160 ms (individual measurements: 3210, 3200, 2930 ms) and 610±12 ms (individual measurements: 616, 598 ms), respectively. When an inversion recovery acquisition was performed in vivo on a test subject to null the lymphatic signal using this T1 value, lymph node signal reduced by a factor of 3.3 (nulled: 6 ±3 a.u. vs. not-nulled: 20 ± 8 a.u.) and was not statistically different (P=0.29) from the noise signal (4 ±2 a.u.).
Figure 1. Relaxation time measurements.
(a) Inversion recovery and (b) exponential spin echo decay of a representative lymphatic fluid sample at 38C. Circles represent experimental data and the solid line the fit (Eqs. 1 and 2, respectively). In vivo image of lymph nodes on (c) the DWIBS scan, as well as (d) without and with the inversion prepulse in a basic EPI acquisition. The inversion prepulse was placed at the expected null point (TI = 1.4s at TR = 4s) of lymphatic water, calculated with the T1=3100 ms measured from the ex vivo lymphatic sample. A quantitative analysis of the signal in the nodes (e) demonstrates that signal intensity following the longitudinal nulling is not statistically different from the noise signal. This provides support for the ex vivo T1 measurements reflecting in vivo lymphatic water T1. The central red line represents the median value while the box represents the 25th and 75th percentile. ***P<0.001
Spin Labeling Measurements in Unobstructed Lymphatic System
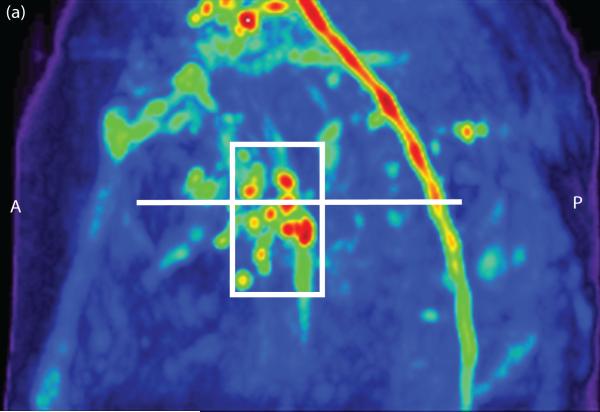
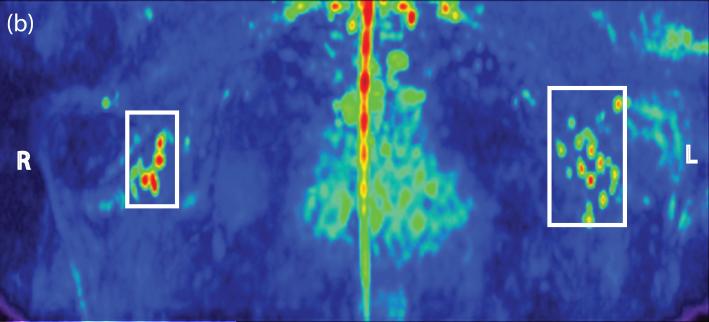
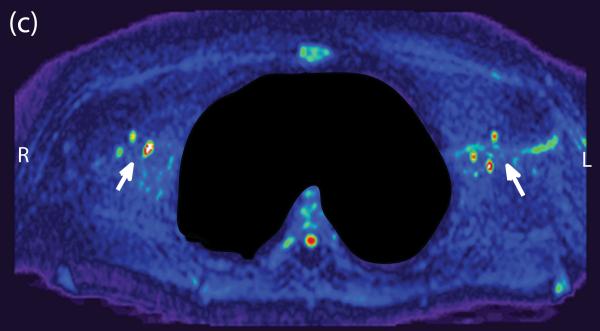
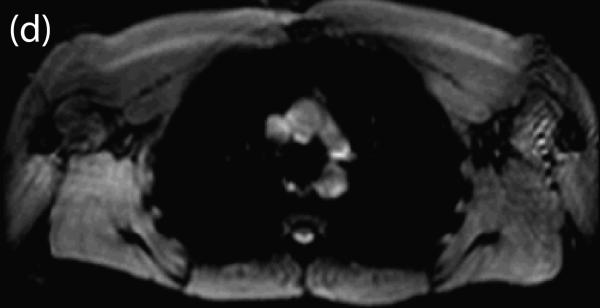
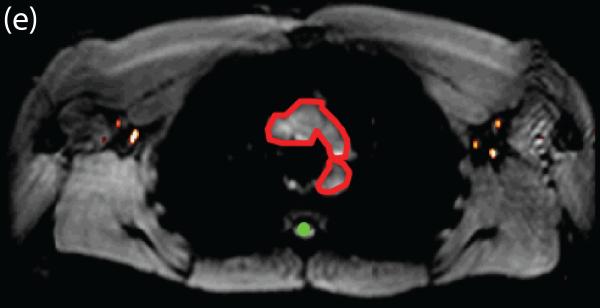
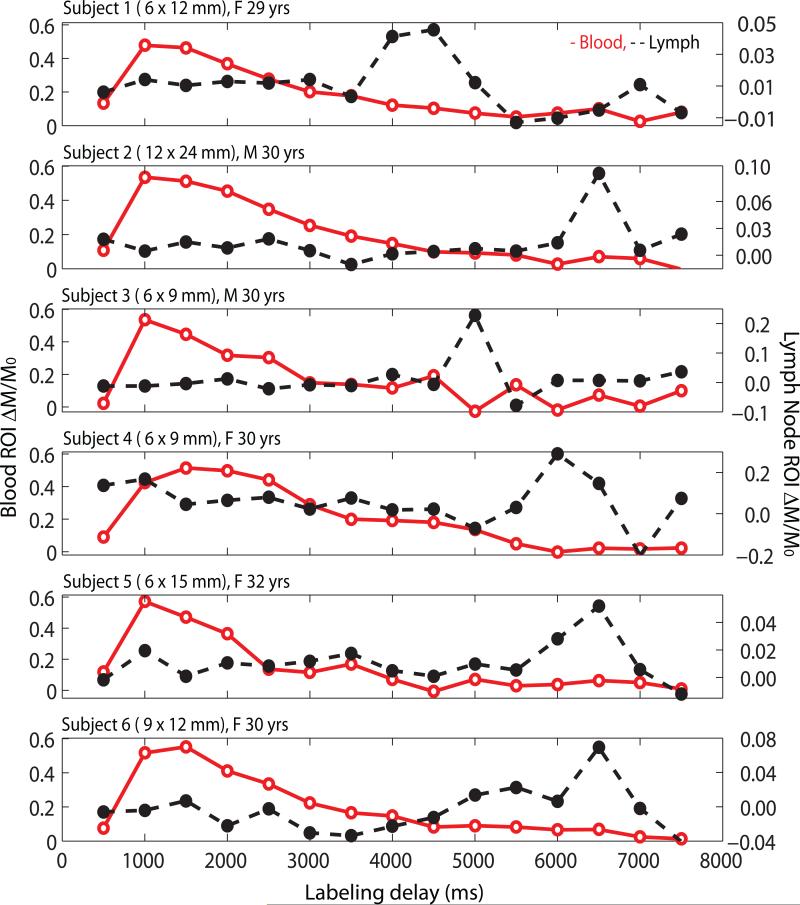
Figure 2 shows an example DWIBS scan with corresponding control spin labeling image. The lymph nodes, identified from the DWIBS scan, were overlaid on the EPI image from the spin labeling scan for clarity and free form ROIs in the lymph nodes (2-4 voxels) and a major artery (3-5 voxels) were drawn (SR - 7 years MR experience, MJD – 11 years MR experience). An experienced radiologist (MS; 15 years experience in Neuro and Body Radiology and four years experience in spin labeling) was consulted to verify and confirm that the ROIs drawn based on the DWIBS image correctly co-localized with the lymph nodes. Mean changes in the spin labeling signal (ΔM/M0) from the blood and axillary lymph nodes are shown in Figure 3. In all the subjects, the contrast in the blood increases quickly owing to the fast passage of blood through the large artery, whereas the curve in the lymph node rises later owing to the much slower velocity of lymphatic fluid. Note that due to the comparatively short T1 of blood water (~1600-1700 ms at 3.0T), it is not possible that this signal change could arise from blood water. The transit time for lymph water was 5100±970 ms (median = 5500 ms; range = 3500 – 6000 ms) and the time-to-peak (TTP) was 5800 ± 880 (median = 6250 ms; range = 4500 - 6500 ms), which leads to a calculated lymphatic fluid velocity at the level of the afferent vessel entering the node of 0.61±0.13 cm/min (median = 0.57 cm/min; range = 0.5 – 0.85 cm/min).
Figure 2. Lymph node identification.
(a,b,c) A representative DWIBS scan (30 yr/M) clearly demarcates the lymph nodes across orthogonal axes. A single axial slice, such as the one shown here (white line) is used to guide the location of the spin labeling positioning. (d) Corresponding control spin labeling image, whose location and planning was guided by the DWIBS contrast. (e) The DWIBS image overlaid on control image and thresholded to identify different structures (green=CSF; yellow = lymph) and to draw the ROIs (2 – 4 voxels) for evaluating lymph kinetic curves.
Figure 3. Unobstructed Lymphatic Flow Results.
Lymphatic and blood water magnetization as a function of post-labeling delay times for six separate healthy subjects. In-plane dimensions of the lymph nodes evaluated for each subject are also reported. Note that the blood signal increases quickly owing to the short T1 of blood water and fast blood water velocity. Alternatively, the signal in the axillary lymph node increases much later, owing to the much slower velocity of lymph fluid. The relatively fast rise and fall of the lymphatic curve is consistent with mixing of lymphatic water in the node and finite node dwell times, similar to the macrovascular blood compartment in arterial spin labeling experiments (see Appendix III).
Spin Labeling Measurements in Obstructed Lymphatic System
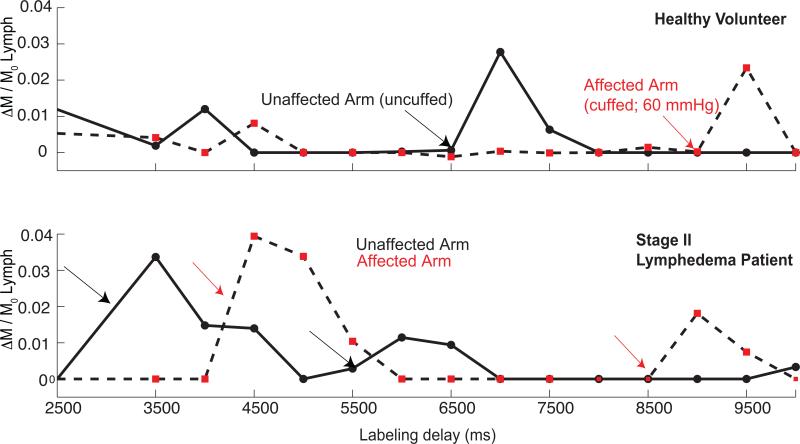
There was a reduction in lymphatic flow velocity in the affected (mean ± std = 0.48 ± 0.15 cm/min; median = 0.46 cm/min; range = 0.33 – 0.66 cm/min) vs. unaffected (mean ± std = 0.61 ± 0.22 cm/min; median = 0.58 cm/min; range = 0.35 – 0.85 cm/min) arms of patients with Stage II lymphedema (P = 0.06) and in the affected (mean ± std = 0.47±0.14 cm/min; median = 0.46 cm/min; range = 0.31 – 0.66 cm/min) vs. unaffected (mean ± std = 0.58±0.16 cm/min; median = 0.66 cm/min; range = 0.35 – 0.75 cm/min) arms of healthy subjects (P = 0.12) with unilateral flow steno-occlusion using a pressure cuff (Figure 4). When the groups of 3 subjects were compared for asymmetric delay in lymphatic velocity differences were not significant (P = 0.06 – 0.12), however they became significant (P=0.004) when the two groups were considered together (Figure 4b). Unaffected-to-affected ratio for (i) Stage II lymphedema patients = 1.27 ± 0.18, (ii) healthy subjects with cuff obstructed flow = 1.21 ± 0.18; and (iii) left-to-right ratio of healthy subjects with unobstructed flow = 0.91 ± 0.08.
Figure 4.
Obstructed Lymphatic Flow Results (a): Lymphatic flow curves for a representative healthy volunteer (M, 31 yrs) with unilateral cuff steno-occlusion of lymphatic fluid (pressure=60 mmHg) and for a patient (F, 60 yrs) with Stage II lymphedema secondary to unilateral breast cancer mastectomy. In both; healthy subjects and patients, a delay in lymphatic arrival times on the affected side relative to unaffected side is observed. Additionally, multiple arrival times are found, consistent with multiple afferent vessels delivering lymphatic water to the node. (b) The ratio of lymphatic flow velocity in the unaffected arm to the affected arm was significantly higher (P<0.005; 1.24 ± 0.18) in the six impaired subjects compared to the lymphatic velocity ratio of the left-to-right arm of the healthy subjects shown in Figure 3 (0.9124 ± 0.08). ** P<0.005.
Discussion
The overall finding of this work is that long T1 of lymphatic water allows us to estimate lymphatic velocity using spin labeling methods. Clinical feasibility of this approach is also demonstrated in patients with lymphatic flow obstruction.
Our measurements of T1 and T2 values for human lymph at 3.0T should be useful to generate optimized lymphatic MRI contrast. These measurements have not been performed in the past due to the difficulty of isolating pure lymphatic voxels in vivo, and pure lymphatic fluid samples ex vivo. Similar to blood water T1, which varies with oxygenation and hematocrit, lymphatic T1, will vary with location, protein content, and disease severity. The ex vivo T1 measurement was approximately correct in Mz-nulling experiments in vivo. Finally, it should be noted that blood water additionally varies with oxygenation, vessel size, and hematocrit, and therefore the success of ASL may be interpreted as an exemplar for why small variations in lymphatic T1 may not be an overwhelming confound.
In the context of literature values, the velocity measured in our study is slower than most studies that measured large-vessel velocity. Importantly, to phagocytose and filter detrimental substances, lymph flow into the intranodal sinus system is much slower than in large vessels populated with lymphangions (25). Additionally, as lymph circulates through multiple nodes, it becomes denser and reduces velocity. Using 99mTc-human IgG, Modi et al. found a relatively large, mean hand to axillary node velocity of 8.9±5.8 cm/min with a transit time of 9.6±7.2 min (7). Using fluorescence video microscopy in the foot, Fischer et al. demonstrated that the median resting capillary velocity was 0.058 cm/min in the human skin (26). With fluorescence recovery after photobleaching in a mouse model, Berk et al. (27), and Swartz et al (28) found the velocity to be 0.028 and 0.018-.024 cm/min, respectively. Most studies are carried out in superficial lymphatic vessels and are done over short distances with invasive dyes that change vessel pressure and skin lymphatic activity. The mean entry velocity measured here (0.61 cm/min) is on the lower end of the reported velocity ranges for large and small vessels, as expected for the location of the measurement. Other magnetic resonance approaches have also been utilized with some success to detect lymph nodes and evaluate lymphatic flow using ultra-small super paramagnetic oxide (USPIOs) and gadolinium chelates albeit with low sensitivity (6). A study (29) to assess the reproducibility, reliability, and accuracy of un-enhanced MRI methods, specifically T1 weighted images and diffusion weighted imaging (30), in metastatic lymph nodes in breast cancer concluded that these methods are not yet ready for clinical implementation. However, promising work in animals has shown that very low-dose gadolinium conjugated dendrimers, successfully used in pigs, could potentially be used in humans (31).
Our findings in controlled pressure cuff scenarios in healthy subjects and in patients with intermediate-stage (Stage II) lymphedema demonstrated reduced lymphatic velocity in the affected arm. The number of subjects studied for obstructed lymph flow measurements are low, since the purpose of the study was primarily to assess feasibility. The lymphatic velocity, although frequently reduced, showed a trend for a significant reduction in the affected vs. unaffected arms in both groups. Importantly, combining the two populations provided a significant (P<0.005) decrease in the impaired side lymphatic velocity when compared to the unimpaired side. Furthermore, the ratios of the lymphatic velocity in the unaffected arm to affected arm is significantly (p<0.005) greater than the ratio of lymphatic flow velocities of both arms in healthy subjects, which is approximately unity as expected. This outcome provides support for the lymphatic spin labeling technique being capable of detecting clinical differences in lymphatic flow velocity.
Additionally, it should be noted that the rise and fall of the lymphatic spin labeling kinetic curve is much sharper than the perfusion kinetic curve. We have outlined a kinetic model justifying this response in Appendix III and believe that this effect occurs owing to the lymphatic system more closely reflecting the macrovascular compartment of arterial spin labeling models, with the addition of mixing within the node and an extended dwell time.
Several limitations of this study should be considered. First, our approach measures lymph flow into the nodes and does not discriminate between how many nodes the fluid has traversed, which will influence viscosity and velocity. However, in cases of obstructed flow, we did observe differences in affected vs. unaffected arms, lending support for this technique having clinical potential. Lymphatic velocity will likely be much slower in lymphedema patients, causing the spin labeling curves to shift further right. This may cause the lymphatic water label to decay before it enters the node. However, the T1 of lymphatic water is very long at 3.0T (3100 ms). Therefore, for efficient RF inversion pulses, longitudinal magnetization will be reduced from equilibrium by approximately 29% (at TTP=6000 ms) to about 8% (at TTP=10000 ms). Efficient spin labeling does allow for flow estimation over a large TTP range as shown in the clinical feasibility test. Multi-slice approaches could be implemented, enabling lymph flow measurements over a larger spatial domain. Finally, SNR can be increased through background suppression pulses, whereby the static signal within a slice is suppressed using principles of inversion recovery (32). Background suppression, in potential combination with other spin labeling improvement variants such as magnetization transfer, steady-state-free-precession, or diffusion gradients may additionally help better identify lymphatic vessels from surrounding tissue (18, 33).
In conclusion, we have demonstrated that owing to the long T1 of lymphatic fluid, principles of spin labeling can be extended to measure lymphatic flow in healthy subjects and patients with lymphedema. This approach is noninvasive, can be performed with clinically available MRI equipment and holds potential for identifying patients at highest risk for breast cancer treatment related lymphedema, or for evaluating the lymphatic system's response to novel therapies.
Supplementary Material
Advances in Knowledge.
Quantitative longitudinal (T1) and transverse (T2) relaxation time measurements of human lymphatic fluid are presented at 3.0 Tesla.
Feasibility of noninvasive assessment of lymphatic flow velocities is shown using principles of spin labeling, analogous to the popular arterial spin labeling (ASL) method for perfusion quantification.
Expected reductions in lymphatic flow velocity are found in both healthy individuals under conditions of manipulated lymphatic flow obstruction, as well as in patients with Stage II lymphedema
A kinetic model for lymphatic spin labeling measurements is introduced that can be used to quantitatively understand sources of variability in patients.
Implications for Patient Care.
A magnetic resonance imaging (MRI) method capable of quantifying lymphatic flow velocities without exogenous contrast agent administration is presented; the method can be readily implemented on commercially-available MRI scanners and provides noninvasive assessments of lymphatic flow in vivo, which should be useful for identifying disease biomarkers or evaluating therapies in patients with post breast cancer-related lymphedema.
Acknowledgements
We would like to thank Dr. Megan K. Strother, MD, Vanderbilt University Medical Center, for reading the MR images and verifying the lymph nodes identified in this work.
References
- 1.Moseley AL, Carati CJ, Piller NB. A systematic review of common conservative therapies for arm lymphoedema secondary to breast cancer treatment. Annals of oncology : official journal of the European Society for Medical Oncology / ESMO. 2007;18(4):639–46. doi: 10.1093/annonc/mdl182. [DOI] [PubMed] [Google Scholar]
- 2.Armer J, Fu MR, Wainstock JM, Zagar E, Jacobs LK. Lymphedema following breast cancer treatment, including sentinel lymph node biopsy. Lymphology. 2004;37(2):73–91. [PubMed] [Google Scholar]
- 3.Langer I, Guller U, Berclaz G, et al. Morbidity of sentinel lymph node biopsy (SLN) alone versus SLN and completion axillary lymph node dissection after breast cancer surgery: a prospective Swiss multicenter study on 659 patients. Annals of surgery. 2007;245(3):452–61. doi: 10.1097/01.sla.0000245472.47748.ec. [DOI] [PMC free article] [PubMed] [Google Scholar]
- 4.Warren AG, Brorson H, Borud LJ, Slavin SA. Lymphedema: a comprehensive review. Ann Plast Surg. 2007;59(4):464–72. doi: 10.1097/01.sap.0000257149.42922.7e. [DOI] [PubMed] [Google Scholar]
- 5.Torres Lacomba M, Yuste Sanchez MJ, Zapico Goni A, et al. Effectiveness of early physiotherapy to prevent lymphoedema after surgery for breast cancer: randomised, single blinded, clinical trial. BMJ. 2010;340:b5396. doi: 10.1136/bmj.b5396. [DOI] [PMC free article] [PubMed] [Google Scholar]
- 6.Lucarelli RT, Ogawa M, Kosaka N, Turkbey B, Kobayashi H, Choyke PL. New approaches to lymphatic imaging. Lymphatic research and biology. 2009;7(4):205–14. doi: 10.1089/lrb.2009.0021. [DOI] [PMC free article] [PubMed] [Google Scholar]
- 7.Modi S, Stanton AW, Svensson WE, Peters AM, Mortimer PS, Levick JR. Human lymphatic pumping measured in healthy and lymphoedematous arms by lymphatic congestion lymphoscintigraphy. The Journal of physiology. 2007;583(Pt 1):271–85. doi: 10.1113/jphysiol.2007.130401. [DOI] [PMC free article] [PubMed] [Google Scholar]
- 8.Luciani A, Itti E, Rahmouni A, Meignan M, Clement O. Lymph node imaging: basic principles. European journal of radiology. 2006;58(3):338–44. doi: 10.1016/j.ejrad.2005.12.038. [DOI] [PubMed] [Google Scholar]
- 9.Barrett T, Choyke PL, Kobayashi H. Imaging of the lymphatic system: new horizons. Contrast media & molecular imaging. 2006;1(6):230–45. doi: 10.1002/cmmi.116. [DOI] [PubMed] [Google Scholar]
- 10.Hama Y, Koyama Y, Urano Y, Choyke PL, Kobayashi H. Two-color lymphatic mapping using Ig-conjugated near infrared optical probes. The Journal of investigative dermatology. 2007;127(10):2351–6. doi: 10.1038/sj.jid.5700892. [DOI] [PubMed] [Google Scholar]
- 11.Kobayashi H, Kawamoto S, Bernardo M, Brechbiel MW, Knopp MV, Choyke PL. Delivery of gadolinium-labeled nanoparticles to the sentinel lymph node: comparison of the sentinel node visualization and estimations of intra-nodal gadolinium concentration by the magnetic resonance imaging. Journal of controlled release : official journal of the Controlled Release Society. 2006;111(3):343–51. doi: 10.1016/j.jconrel.2005.12.019. [DOI] [PubMed] [Google Scholar]
- 12.Detre JA, Leigh JS, Williams DS, Koretsky AP. Perfusion imaging. Magnetic resonance in medicine : official journal of the Society of Magnetic Resonance in Medicine / Society of Magnetic Resonance in Medicine. 1992;23(1):37–45. doi: 10.1002/mrm.1910230106. [DOI] [PubMed] [Google Scholar]
- 13.Rosen BR, Belliveau JW, Aronen HJ, et al. Susceptibility contrast imaging of cerebral blood volume: human experience. Magnetic resonance in medicine : official journal of the Society of Magnetic Resonance in Medicine / Society of Magnetic Resonance in Medicine. 1991;22(2):293–9. doi: 10.1002/mrm.1910220227. discussion 300-3. [DOI] [PubMed] [Google Scholar]
- 14.Rudin M, Sauter A. Noninvasive determination of regional cerebral blood flow in rats using dynamic imaging with Gd(DTPA). Magnetic resonance in medicine : official journal of the Society of Magnetic Resonance in Medicine / Society of Magnetic Resonance in Medicine. 1991;22(1):32–46. doi: 10.1002/mrm.1910220105. [DOI] [PubMed] [Google Scholar]
- 15.Tourdias T, Rodrigo S, Oppenheim C, et al. Pulsed arterial spin labeling applications in brain tumors: practical review. Journal of neuroradiology Journal de neuroradiologie. 2008;35(2):79–89. doi: 10.1016/j.neurad.2007.11.007. [DOI] [PubMed] [Google Scholar]
- 16.Bokkers RP, van der Worp HB, Mali WP, Hendrikse J. Noninvasive MR imaging of cerebral perfusion in patients with a carotid artery stenosis. Neurology. 2009;73(11):869–75. doi: 10.1212/WNL.0b013e3181b7840c. [DOI] [PubMed] [Google Scholar]
- 17.Detre JA, Samuels OB, Alsop DC, Gonzalez-At JB, Kasner SE, Raps EC. Noninvasive magnetic resonance imaging evaluation of cerebral blood flow with acetazolamide challenge in patients with cerebrovascular stenosis. Journal of magnetic resonance imaging : JMRI. 1999;10(5):870–5. doi: 10.1002/(sici)1522-2586(199911)10:5<870::aid-jmri36>3.0.co;2-d. [DOI] [PubMed] [Google Scholar]
- 18.Donahue MJ, Strother MK, Hendrikse J. Novel MRI approaches for assessing cerebral hemodynamics in ischemic cerebrovascular disease. Stroke. 2012;43(3):903–15. doi: 10.1161/STROKEAHA.111.635995. [DOI] [PubMed] [Google Scholar]
- 19.Pfefferbaum A, Chanraud S, Pitel AL, et al. Cerebral blood flow in posterior cortical nodes of the default mode network decreases with task engagement but remains higher than in most brain regions. Cerebral cortex. 2011;21(1):233–44. doi: 10.1093/cercor/bhq090. [DOI] [PMC free article] [PubMed] [Google Scholar]
- 20.Donahue MJ, Blicher JU, Ostergaard L, et al. Cerebral blood flow, blood volume, and oxygen metabolism dynamics in human visual and motor cortex as measured by whole-brain multi-modal magnetic resonance imaging. Journal of cerebral blood flow and metabolism : official journal of the International Society of Cerebral Blood Flow and Metabolism. 2009;29(11):1856–66. doi: 10.1038/jcbfm.2009.107. [DOI] [PubMed] [Google Scholar]
- 21.Lu H, Clingman C, Golay X, van Zijl PC. Determining the longitudinal relaxation time (T1) of blood at 3.0 Tesla. Magnetic resonance in medicine : official journal of the Society of Magnetic Resonance in Medicine / Society of Magnetic Resonance in Medicine. 2004;52(3):679–82. doi: 10.1002/mrm.20178. [DOI] [PubMed] [Google Scholar]
- 22.Wong EC, Buxton RB, Frank LR. Implementation of quantitative perfusion imaging techniques for functional brain mapping using pulsed arterial spin labeling. NMR in biomedicine. 1997;10(4-5):237–49. doi: 10.1002/(sici)1099-1492(199706/08)10:4/5<237::aid-nbm475>3.0.co;2-x. [DOI] [PubMed] [Google Scholar]
- 23.Buxton RB. Quantifying CBF with arterial spin labeling. Journal of magnetic resonance imaging : JMRI. 2005;22(6):723–6. doi: 10.1002/jmri.20462. [DOI] [PubMed] [Google Scholar]
- 24.Dai W, Garcia D, de Bazelaire C, Alsop DC. Continuous flow-driven inversion for arterial spin labeling using pulsed radio frequency and gradient fields. Magnetic resonance in medicine : official journal of the Society of Magnetic Resonance in Medicine / Society of Magnetic Resonance in Medicine. 2008;60(6):1488–97. doi: 10.1002/mrm.21790. [DOI] [PMC free article] [PubMed] [Google Scholar]
- 25.Zuther JE. Lymphedema management : the comprehensive guide for practitioners. 2nd ed. Thieme; Stuttgart ; New York: 2009. [Google Scholar]
- 26.Fischer M, Franzeck UK, Herrig I, et al. Flow velocity of single lymphatic capillaries in human skin. The American journal of physiology. 1996;270(1 Pt 2):H358–63. doi: 10.1152/ajpheart.1996.270.1.H358. [DOI] [PubMed] [Google Scholar]
- 27.Berk DA, Swartz MA, Leu AJ, Jain RK. Transport in lymphatic capillaries. II. Microscopic velocity measurement with fluorescence photobleaching. The American journal of physiology. 1996;270(1 Pt 2):H330–7. doi: 10.1152/ajpheart.1996.270.1.H330. [DOI] [PubMed] [Google Scholar]
- 28.Swartz MA, Berk DA, Jain RK. Transport in lymphatic capillaries. I. Macroscopic measurements using residence time distribution theory. The American journal of physiology. 1996;270(1 Pt 2):H324–9. doi: 10.1152/ajpheart.1996.270.1.H324. [DOI] [PubMed] [Google Scholar]
- 29.Scaranelo AM, Eiada R, Jacks LM, Kulkarni S, Pavel C. Accuracy of unenhanced MR Imaging in the Detection of Axillary Lymph Node Metastasis: Study of Reproducibility and Reliability. Radiology. 2012;262(2):10. doi: 10.1148/radiol.11110639. [DOI] [PubMed] [Google Scholar]
- 30.Demetris AJ, Seaberg EC, Batts KP, et al. Reliability and predictive value of the National Institute of Diabetes and Digestive and Kidney Diseases Liver Transplantation Database nomenclature and grading system for cellular rejection of liver allografts. Hepatology. 1995;21(2):408–16. [PubMed] [Google Scholar]
- 31.Sena LM, Fishman SJ, Jenkins KJ, et al. Magnetic resonance lymphangiography with a nano-sized gadolinium-labeled dendrimer in small and large animal models. Nanomedicine (London) 2010;5(8):9. doi: 10.2217/nnm.10.70. [DOI] [PMC free article] [PubMed] [Google Scholar]
- 32.Ye FQ, Frank JA, Weinberger DR, McLaughlin AC. Noise reduction in 3D perfusion imaging by attenuating the static signal in arterial spin tagging (ASSIST). Magn Reson Med. 2000;44(1):92–100. doi: 10.1002/1522-2594(200007)44:1<92::aid-mrm14>3.0.co;2-m. [DOI] [PubMed] [Google Scholar]
- 33.Kim T, Kim SG. Quantitative MRI of cerebral arterial blood volume. Open Neuroimag J. 2011;5:136–45. doi: 10.2174/1874440001105010136. [DOI] [PMC free article] [PubMed] [Google Scholar]
Associated Data
This section collects any data citations, data availability statements, or supplementary materials included in this article.


