

Abstract
Neuroinflammatory mechanisms contribute to the brain pathology resulting from human immunodeficiency virus (HIV) infection. Magnetic resonance spectroscopy (MRS) has been touted as a suitable method for discriminating in vivo markers of neuroinflammation. The present MRS study was conducted in four groups: alcohol dependent (A, n = 37), HIV-infected (H, n = 33), alcohol dependent + HIV infected (HA, n = 38) and healthy control (C, n = 62) individuals to determine whether metabolites would change in a pattern reflecting neuroinflammation. Significant four-group comparisons were evident only for striatal choline-containing compounds (Cho) and myo-inositol (mI), which follow-up analysis demonstrated were due to higher levels in HA compared with C individuals. To explore the potential relevance of elevated Cho and mI, correlations between blood markers, medication status and alcohol consumption were evaluated in H + HA subjects. Having an acquired immune deficiency syndrome (AIDS)-defining event or hepatitis C was associated with higher Cho; lower Cho levels, however, were associated with low thiamine levels and with highly active antiretroviral HIV treatment (HAART). Higher levels of mI were related to greater lifetime alcohol consumed, whereas HAART was associated with lower mI levels. The current results suggest that competing mechanisms can influence in vivo Cho and mI levels, and that elevations in these metabolites cannot necessarily be interpreted as reflecting a single underlying mechanism, including neuroinflammation.
Keywords: choline, myo-inositol, in vivo, magnetic resonance spectroscopy
INTRODUCTION
Significant evidence supports the view that the mechanisms contributing to brain alterations in human immunodeficiency virus (HIV) infection are due, at least in part, to neuroinflammatory processes (9). Brain autopsy reveals in HIV with acquired immune deficiency syndrome (AIDS) a characteristic neuropathology including macrophage infiltration, microglial nodules and multinucleated giant cells (44, 58, 64). Central nervous system (CNS) HIV infection appears to begin with the transmigration of peripheral HIV-infected cells (eg, monocytes or macrophages) across the blood brain barrier (BBB) (38, 46, 47, 53, 57, 82, 89, 100, 104) and consequently infection, primarily of microglia, the resident macrophages of the brain (24, 32, 37, 40, 50, 55, 64). Activation of microglia and the release of chemokine, cytokines and neurotoxins in conjunction with secreted HIV protein can damage the brain (36, 56, 76, 85, 103).
In addition to diseases such as HIV wherein the primary pathological process has an inflammatory component, recent hypotheses suggest that “neuroinflammation” is also causative in the brain damage that occurs in neurodegenerative diseases, for example, Alzheimer’s and Parkinson’s diseases (4, 70, 91). These theories speculate that microglial activation results in the release of noxious stimuli (eg, reactive oxygen species, chemokines, cytokines) that cause activation of nearby microglia and other cell types (eg, astrocytes, neurons) to release additional toxic stimuli. This cascade results in a self-perpetuating cycle of sustained chronic neuroinflammation that can drive neurodegeneration (eg, 69, 86). That microglia have a low activation threshold, however, suggests that they may be ubiquitously involved even in subtle brain pathologies (42). Thus, in neurodegenerative diseases, pervasive microglial activation may reflect neuronal injury, dysfunction or loss, and is more likely a response to than the cause of neuronal damage (81, 90).
Regardless of the underlying primary pathology, it is clear that in a variety of CNS disorders microglial activation, neuroinflammation and neurodegeneration are intimately connected (43). Thus, the identification of markers that can distinguish between component processes of these independent mechanisms is important in elucidating a better understanding of brain pathology. In vivo brain magnetic resonance (MR) techniques are unique in their ability for longitudinal tracking of disease course. Longitudinal study can assess exacerbation/remission cycles of the natural course of disease as well as treatment efficacy. Quantitative MR assessment tools include structural MR imaging (MRI), which provides assessment of brain macrostructure; diffusion tensor imaging (DTI), which assesses microstructural white matter tissue integrity; and MR spectroscopy (MRS), which quantifies brain chemicals. MRS, in particular, has been considered suitable for assessing neuroinflammatory disorders. Review of MRS studies in multiple sclerosis (MS) and neuroviral infections including HIV and hepatitis C (HCV) suggests that neuroinflammation is associated with elevated levels of myo-inositol (mI), choline-containing compounds (Cho) and total creatine (tCr) (22), whereas neuronal injury (dysfunction or loss) is associated with low levels of N-acetyl aspartate (NAA) and glutamate (Glu) (22). Because mI, an osmolyte, is primarily present in glial cells (11), it is considered a glial marker. The signal from Cho, including contributions from free choline, glycerophosphorylcholine and phosphorylcholine (74), is a marker for cell membrane synthesis and turnover. The signal from tCr, with contributions from creatine and phosphocreatine, represents the high-energy biochemical reserves of neurons and glia (52). NAA is an indicator of neuronal integrity, with decreases suggesting neuronal dysfunction (eg, 108, 110). Glu is a ubiquitous molecule used in cellular metabolism and is the principal excitatory neurotransmitter (33, 97; Table 1). The current study was conducted to determine whether higher mI, Cho and tCr, an MRS metabolite pattern proposed to reflect neuroinflammation, would be detected in a cohort of HIV-infected individuals; whether this pattern is exaggerated in individuals comorbid for HIV infection and alcoholism was also evaluated.
Table 1.
Magnetic resonance spectroscopy signals†.
| Metabolite | Contains | Location | Proposed roles/function(s) | |
|---|---|---|---|---|
| N-acteyl aspartate | NAA | N-acteyl aspartate, N-acetyl aspartate glutamate | Gray matter, primarily neurons | Amino acid, osmolyte, source of acetate for myelin lipid synthesis, storage form of aspartate, energy metabolism; marker for neuronal density/integrity |
| Total creatine | tCr | Creatine, phosphocreatine | Neurons, astrocytes, oligodendrocytes | Reservoir for ATP generation, influenced by the state of high-energy phosphate metabolism, osmolyte |
| Choline-containing compounds | Cho | Free choline, phosphocholine, glycerophosphocholine | White matter | Essential nutrient, required for acetylcholine and phosphatidylcholine synthesis, osmolyte; marker for cell membrane synthesis and turnover |
| Myo-inositol | mI | Myo-inositol | Gray matter, primarily glia | Osmolyte, storage form of glucose, precursor of myelin phophatidyl inositol, progenitor of the inositol polyphosphate messenger cascade, breakdown product of phosphatidyl inotisol; glial marker |
| Glutamate | Glu | Glutamate | Primarily neurons | Amino acid, key molecule in cellular metabolism, most abundant excitatory neurotransmitter, principal neurotransmitter of corticol efferents |
METHODS
Participants
All subjects provided written, informed consent to participate in this study, which was approved by the Institutional Review Boards of SRI International and Stanford University. MRS data were collected in 170 participants: 62 healthy controls (27 women, age 48.3 ± 20.4, range 20.0–86.3), 37 individuals with alcohol use disorders (13 women, age 48.5 ± 10.6, range 21.7– 67.0), 33 individuals positive for HIV (11 women, age 50.0 ± 9.1, range 25.6–64.3) and 38 individuals comorbid for alcoholism + HIV (13 women, age 51.0 ± 6.6, range 31.9–64.1; Table 2). Controls, reported in a previous study on healthy aging (109), were recruited from the local community by flyers, advertisement and word of mouth. The alcoholic subjects were recruited from local treatment programs. The HIV-infected subjects were recruited and screened through the AIDS Community Research Consortium by clinical research registered nurses or physicians. Subjects in the four groups underwent a formal interview with clinical research psychologists, who used the Structured Clinical Interview for the Diagnostic and Statistical Manual IV. Potential participants were excluded for axis I diagnoses of bipolar disorder or schizophrenia, or for any non-alcohol substance use (except cannabis) in the previous month or abuse in the previous 3 months. Additional exclusion criteria for all subjects were diagnoses or medical conditions that can affect brain functioning (eg, diabetes, head injury, epilepsy, uncontrolled hypertension, radiation, CNS opportunistic infection or chemotherapy) or preclude MR study (eg, pacemakers). At the start of each test day all subjects were given a breathalyzer test; subjects not achieving a score of 0.0 were not tested that day.
Table 2.
Group demographics: means, standard deviations and ranges.
| Control (C) n = 62 | Alcoholic (A) n = 37 | HIV infection (H) n = 33 | HIV + alcoholism (HA) n = 38 | P-value† | |
|---|---|---|---|---|---|
| Age | 48.33 ± 20.42 | 48.47 ± 10.61 | 50.00 ± 9.13 | 50.97 ± 6.56 | 0.7981 |
| Sex (M/F) | 35/27 | 24/13 | 22/11 | 25/13 | 0.6887 |
| Handedness score‡ | 24.23 ± 12.30 | 24.00 ± 13.55 | 24.06 ± 11.09 | 26.59 ± 14.23 | 0.7826 |
| Body mass index | 25.54 ± 4.30 | 26.83 ± 4.43 | 25.28 ± 3.76 | 25.26 ± 4.19 | 0.3212 |
| Systolic blood pressure | 124.66 ± 16.88 | 122.69 ± 15.01 | 124.55 ± 12.55 | 127.75 ± 14.98 | 0.5670 |
| Diastolic blood pressure | 71.89 ± 9.05 | 73.08 ± 11.74 | 73.30 ± 9.13 | 75.75 ± 9.73 | 0.3241 |
| Heart rate | 67.02 ± 10.66 | 68.86 ± 11.73 | 67.91 ± 14.78 | 68.50 ± 11.37 | 0.8851 |
| Socioeconomic status§ | 26.82 ± 12.06 | 41.00 ± 12.99 | 40.21 ± 15.13 | 43.08 ± 11.45 | 0.0001: C > A = H = HA |
| Education (years) | 15.87 ± 2.29 | 13.54 ± 2.33 | 13.42 ± 2.89 | 13.16 ± 2.22 | 0.0001: C > A = H = HA |
| National Adult Reading Test IQ | 114.03 ± 7.83 | 106.78 ± 9.69 | 105.36 ± 9.58 | 105.87 ± 8.25 | 0.0001: C > A = H = HA |
| Dementia Rating Scale | 140.19 ± 2.72 | 138.73 ± 4.35 | 136.42 ± 5.30 | 136.21 ± 4.48 | 0.0001: C = A > H = HA |
| Beck Depression Inventory-II | 2.85 ± 3.28 | 8.31 ± 5.53 | 10.67 ± 9.38 | 10.94 ± 8.42 | 0.0001: C < A = H = HA |
| Global assessment of functioning | 84.45 ± 8.57 | 68.49 ± 10.69 | 76.09 ± 9.52 | 68.84 ± 8.54 | 0.0001: C > H > A = HA |
| Lifetime alcohol consumption (kg) | 18.75 ± 55.53 | 1319.42 ± 1057.16 | 68.01 ± 63.40 | 828.87 ± 620.43 | 0.0001: A > HA > C = H |
| Hepatitis C positive | 1 | 7 | 10 | 18 | 0.0001: C < A < H < HA |
| Smoker (current or past) | 8 | 22 | 12 | 21 | 0.0001: HA = A > H = C |
| CD4 cell count | — | — | 587.36 ± 276.66 | 538.45 ± 331.75 | 0.5059 |
| Viral load (cml) | — | — | 9187 ± 26 103 | 7923 ± 38 264 | 0.8748 |
| CNS penetration effectiveness (CPE) | — | — | 5.15 ± 3.27 | 6.58 ± 3.42 | 0.0197: HA > H |
| Self-defined ethnicity: Caucasian | 36 | 16 | 12 | 7 | N/A |
| Self-defined ethnicity: Hispanic | 1 | 3 | 6 | 8 | N/A |
| Self-defined ethnicity: African American | 13 | 17 | 15 | 22 | N/A |
| Self-defined ethnicity: other | 12 | 1 | 0 | 1 | N/A |
Analyses of variance and follow-up t-tests or Pearson’s chi-squared test.
RH = 14–30; LH = 50–70.
Lower score = higher status.
CNS = central nervous system; HIV = human immunodeficiency virus.
The four groups were matched in age, ratio of women, body mass index (BMI), systolic and diastolic blood pressure, and heart rate (Table 1). Based on a quantitative handedness questionnaire (on which right-handed scores = 14–32 and left-handed scores = 50–70), all but 13 participants (5C, 3A, 2H, 3HA), who scored above 50, were right handed (average score = 23.5 ± 11.0) (25). Analysis of variance (ANOVA) and follow-up t-tests demonstrated that the control group relative to the other three groups had higher socioeconomic status [F(3,166) = 17.61, P ≤ 0.0001] (51), more education [F(3,166) = 14.25, P ≤ 0.0001] and higher estimated general intelligence [F(3,165) = 11.27, P = 0.0001], based on the National Adult Reading Test (NART) (80). On the Dementia Rating Scale (DRS), all but one participant (an H man, score = 121) scored within the normal range for healthy individuals living in the community (cutoff for dementia ≤124 out of 144) (65, 101). Lifetime consumption of alcohol averaged 1319 kg in the A group and 829 kg in the HA group. The two alcohol groups consumed significantly more alcohol in their lifetime than did the non-alcoholic groups, and the A group reported a higher total lifetime alcohol consumption than did the HA group. The two HIV groups were matched in CD4 count and viral load. All but four individuals in the H group and six individuals in the HA groups were on highly active antiretroviral HIV treatment (HAART). An AIDS-defining event was classified by the presence of one of the following: CD4 count <200, cytomegalovirus, Pneumocystis carinii pneumonia, Mycobacterium avium complex, Mycobacterium tuberculosis, cryptosporidiosis, toxoplasmosis or wasting syndrome attributed to HIV.
Blood draws
Blood collected from 146 subjects (38 C, 37 A, 33 H, 38 HA) was processed by Quest Diagnostics for determination of complete blood count (CBC) with differential, comprehensive metabolic panel (CMP), HIV variables including CD4 and CD8 counts, HCV and hepatitis B (HBV) status, and quantification of HIV and HCV viral load. Thiamine diphosphate (vitamin B1) levels were determined in whole blood by ARUP Laboratories, Salt Lake City, UT, USA. Blood analysis was missing on 24 healthy control subjects because they were recruited for an initial aging MRS study that did not include blood draws (106).
MRI acquisition
An axial fast spin echo (FSE) MRI [field of view = 24 cm, frequency encode = 256, average echo time (TE)1/TE2/repetition time (TR) = 17/102/7500 ms, phase encode = 192, echo train length = 8, slice thickness = 2.5 mm, spacing = 0 mm] was acquired on a GE 3T MR (GE Healthcare, USA) scanner and was used for MRS voxel placement.
MRS acquisition
MRS was performed using constant time point-resolved spectroscopy (CT-PRESS) (30). Single voxels were manually positioned in left or right striatum (10.6 cc), left or right cerebellum (9.8 cc) and central pons (5.9 cc); hemisphere of voxel placement was balanced across subjects and groups (Figure 1A). The acquisition time was ~9 minute per voxel [TE = 139 ms, 129 chemical shift (CS) encoding steps, Δt1/2 = 0.8 ms, TR = 2 s, 2 averages] (66). A scan without water suppression was acquired (17 CS encoding steps, Δt1/2 = 6.4 ms, 2 averages) to measure the tissue water content used to normalize the metabolite signal intensities. Data acquired without water suppression were apodized in t2 with a 5 Hz Gaussian line broadening and zero filled up to 4K points for each TE.
Figure 1.
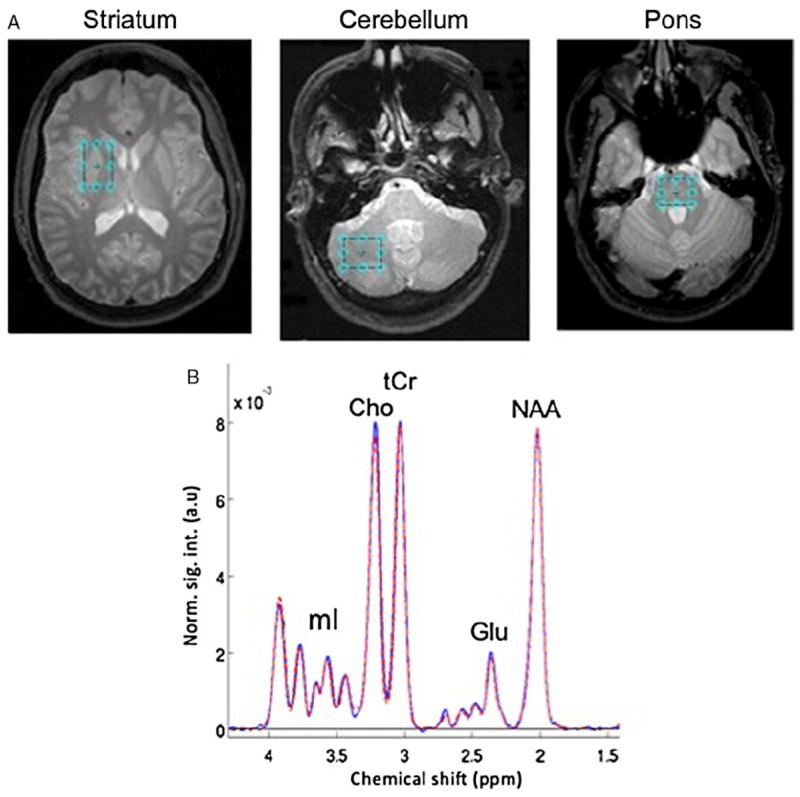
(A) Voxel placement in striatum, cerebellum and pons, and (B) spectra averaged from control subjects in the striatal voxel. a.u. = arbitrary units; Cho = cholinecontaining compounds; Glu = glutamate; mI = myo-inositol; NAA = N-acetyl aspartate; tCr = total creatine.
After performing a fast Fourier transform (FFT) along t2, water spectra were evaluated by peak integration. The amount of cerebrospinal fluid (CSF) and tissue water was estimated by fitting the data across the 17 TEs to a bi-exponential model (67). Apodization of the water-suppressed data entailed multiplication with sine-bell functions in both time dimensions and zero filling up to 4K × 1K data points. After performing a two-dimensional FFT, effectively decoupled one-dimensional CT-PRESS spectra were obtained by integrating the two-dimensional spectrum in magnitude mode along f2 within a ± 13 Hz interval around the spectral diagonal. The quality of the spectra allowed evaluation of signals of the major proton metabolites: NAA (2.01 ppm), tCr (3.03 and 3.93 ppm), Cho (3.20 ppm), Glu (2.35 ppm) and mI (3.52 ppm) (Figure 1B). After baseline subtraction, three large singlet resonances (NAA, tCr and Cho) were fitted simultaneously, and the Glu and mI resonances fit independently, with a Gaussian function within a ± 7.95 Hz window using a downhill simplex method (IDL AMOEBA). The integrated area under the fitted Gaussian was used for quantification.
Motion evaluation
Accuracy of voxel placement is potentially affected by subject motion in the time interval between voxel placement and acquisition as well as during acquisition itself, which can result in reduced spatial overlap between the prescribed and the actual voxel volume. To exclude voxels with significantly reduced overlap, subject motion was detected by comparison of the FSE images acquired before MRS acquisition and a three-plane anatomical localizer acquired thereafter.
To this end, binary masks of the prescribed voxel volumes were first generated in the space of the FSE images. The FSE images were then aligned with the post-MRS localizer by rigid image registration (http://nitrc.org/projects/cmtk). If there was no motion, the resulting image-to-image coordinate transformation should be identical to the ideal transformation, which is determined from the image coordinates in the scanner coordinate system as recorded in the DICOM image files. The deviation of the actual from the ideal transformation (ie, the difference transformation) represents the subject motion between the FSE used for voxel prescription and the post-MRS localizer scan. The effect of motion on a voxel depends not only on the detected motion but also on the location and size of that voxel (eg, rotation around the center of a voxel has a smaller effect than rotation by the same angle around a point outside the voxel). To quantify this effect, the aforementioned difference transformation was, therefore, applied to each prescribed voxel ROI in FSE space, yielding a reformatted voxel ROI, also in FSE space, which represented the voxel that was actually acquired. The overlap of prescribed and acquired voxel was then computed and expressed in percentage of the voxel volume. When there was no motion detected, the difference transformation was the identity mapping and both ROIs were identical, resulting in perfect 100% overlap. A threshold for partitioning of the overlap distribution at 62% for all three regions was used.
Statistical analysis
A total of seven striatal (five poor spectral quality, two low overlap; 3A, 3H, 1HA), 12 cerebellar (seven poor spectral quality, four low overlap, one never collected; 5C, 5A, 2HA) and 18 pontine (nine poor spectral quality, six low overlap, three never collected; 6C, 8A, 1H, 3HA) voxels were excluded. Thus, data of adequate quality were analyzed for 163 striatal voxels, 158 cerebellar voxels and 152 pontine voxels. Metabolite values used for analysis were age-corrected z-scores. ANOVA was used to evaluate group-by-region effects on metabolites. Significant effects were followed up by simple regressions or paired t-tests, where appropriate.
RESULTS
Four-group analyses
ANOVAs were used to determine group differences in the levels of five metabolites (NAA, tCr, Cho, Glu, mI) in three regions (striatum, cerebellum and pons). The only significant four-group ANOVAs were for Cho [F(162) = 2.92, P = 0.0360] and mI [F(162) = 4.19, P = 0.0069] in the striatum (Figure 2). Follow-up t-tests showed that group differences in striatal Cho (P = 0.0044) and mI (P = 0.0007) levels were due to higher levels in HA compared with the C group.
Figure 2.
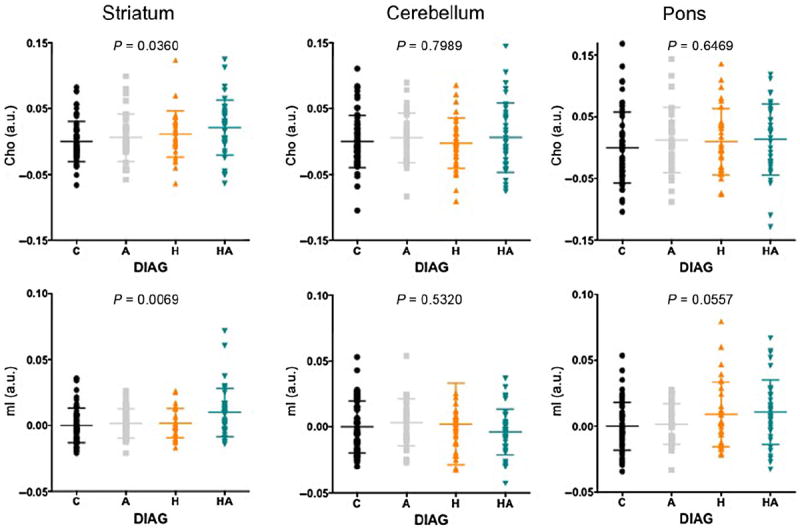
Four-group comparisons of Cho and mI levels in the striatum, cerebellum and pons. A = alcoholic; AIDS = acquired immune deficiency syndrome; a.u. = arbitrary units; C = control; Cho = choline-containing compounds; H = human immunodeficiency virus (HIV) positive; HA = HIV positive + alcoholic individuals; HCV = hepatitis C; mI = myo-inositol.
Correlations between Cho levels and blood markers
Correlations between various blood markers and brain Cho and mI levels were evaluated in only the H + HA groups. Although all laboratory results (eg, CBC, CMP) were evaluated for their relationship with regional brain Cho and mI levels, correlational relationships were limited. After examination of all potentially contributing factors, only four variables contributed to explaining the variance in regional Cho levels: the presence of an AIDSdefining event (yes/no), HCV status (yes/no), medication status (yes/no—on efavirenz or atripla, an HIV medication including efavirenz, emtricitabine, tenofovir) and levels of thiamine (ie, TDP) in whole blood. Of the HIV subjects, 15 H and 18 HA individuals had a history of an AIDS-defining event, 8 H and 9 HA individuals were on efavirenz, 10 H and 18 HA individuals tested positive for HCV. Whole-blood TDP levels (quantified in 15 H and 24 HA individuals) were lower in the HA than A group [F(39) = 4.33, P = 0.0443].
In the striatum, these four variables together explained40%of the variance in Cho levels [F(35) = 5.31, P = 0.0022]. Indeed, just medication status (yes/no—on efavirenz or atripla) and thiamine levels together explained 40% of the striatal Cho variance [F(35) = 11.17, P = 0.0002]. Figure 3 presents parametric and non-parametric results of the effects of each of these four variables independently on Cho levels in the three regions. In the striatum, having HCV was associated with higher striatal Cho levels [t(64) = 2.3, P = 0.0234; χ2 = 8.57, P = 0.0034], but being on efavirenz was associated with lower striatal Cho levels [t(65) = 4.2, P ≤ 0.0001; χ2 = 14.14, P = 0.0002]. These competing effects on Cho levels (ie, HCV and an AIDS-defining event associated with higher Cho, being on efavirenz and low thiamine levels associated with lower Cho) were also seen in the cerebellum and pons, and likely contribute to the variance remaining relatively consistent whether two or four variables are included in the multiple regressions.
Figure 3.
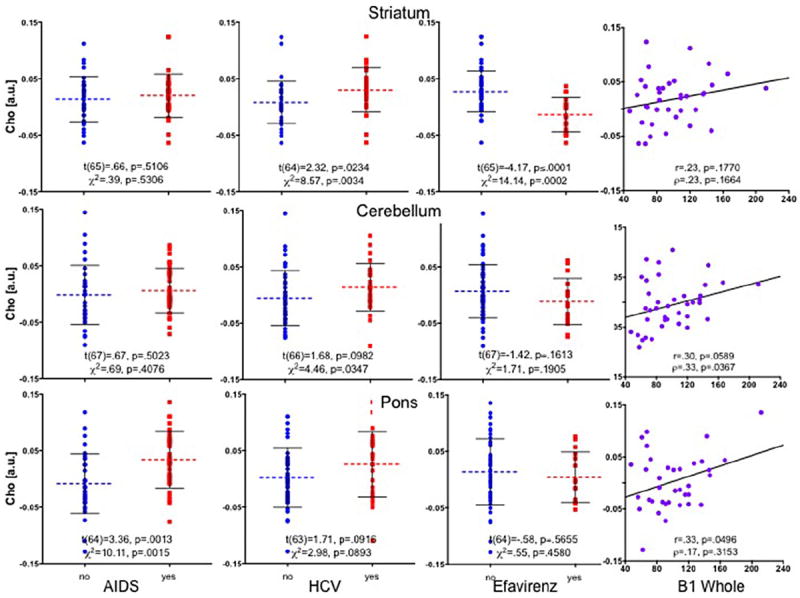
Striatal, cerebellar and pontine Cho levels in H + HA individuals grouped by having a history of an AIDS-defining event (yes/no), hepatitis C (HCV) status (yes/no), medication status (efaverinz, yes/no) and vitamin B1 (thiamine) levels. AIDS = acquired immune deficiency syndrome; a.u. = arbitrary units; Cho = choline-containing compounds; H = human immunodeficiency virus (HIV) positive; HA = HIV positive + alcoholic individuals.
Examination of all potentially contributing factors to the variance in striatal mI showed that total lifetime alcohol consumed was associated with higher mI (r = 0.28, P = 0.0230; ρ = 0.24, P = 0.0493), whereas being on HAART medication was associated with lower striatal mI levels [t(65) = 1.9, P = 0.0573; χ2 = 4.2, P = 0.0395] (Figure 4).
Figure 4.
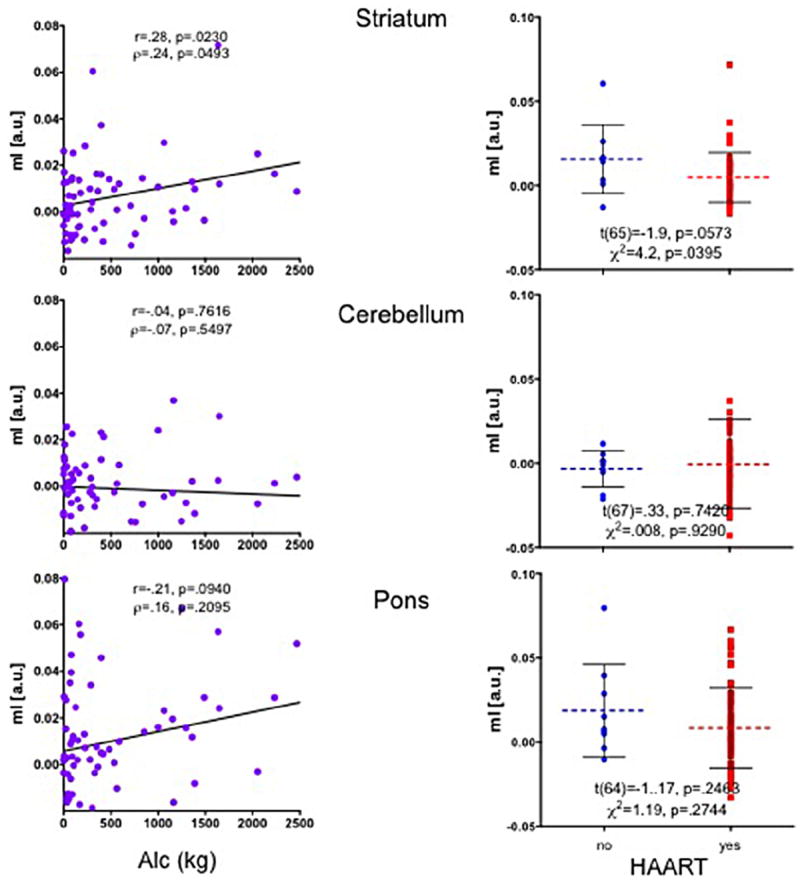
Striatal, cerebellar and pontine mI levels in H + HA individuals grouped by total lifetime alcohol consumed and medication status (HAART, yes/no). a.u. = arbitrary units; H = human immunodeficiency virus (HIV) positive; HA = HIV positive + alcoholic individuals; HAART = highly active antiretroviral HIV treatment; mI = myo-inositol; a.u. = arbitrary units.
DISCUSSION
Here, we attempted to identify a pattern of differences in MRSdetectable metabolites (ie, elevated mI, Cho and tCr) in HIV observed elsewhere (eg, 21, 61, 71, 98, 99) that might reflect neuroinflammation (22). In the current study, Cho and mI were elevated in the striatum of individuals comorbid for HIV and alcoholism compared with controls, but not in subjects with HIV alone. The other MRS metabolites (ie, NAA, tCr, Glu) measured in the striatum, cerebellum and pons were not different among the four groups.
One explanation for the discrepancy between current and previous findings is the status of HIV subjects included in the studies with respect to control of viral load. Although treatment-naive HIV infection may be associated with elevated mI and Cho levels that correlate with viral load (20, 35), concentrations of these metabolites normalize with treatment (19, 96). Such an interpretation is supported by the current findings showing that HIV-positive individuals taking efavirenz have lower striatal Cho levels, and those on HAART have lower striatal mI levels compared with those not on such a medication regime. Another interpretation, however, is that HAART medications, particularly efavirenz, rather than counteracting neuroinflammation in HIV are themselves toxic (1, 23), thereby causing reductions in Cho levels (34). Indeed, there is evidence that efavirenz may induce neurotoxicity by increasing brain proinflammatory cytokines (29).
Patterns of abnormal metabolite levels must be interpreted within the context of the disease examined. In addition to neuroinflammation, elevated levels of Cho have been interpreted as reflecting energy failure, membrane degradation, demyelination, angiopathy or edema in neurodegenerative disorders such as MS (14, 62). Elevated Cho levels have also been reported in pathologies including tumors (15), stroke (95), epilepsy (31), traumatic brain injury (13, 18, 93) and acute disseminated encephalomyelitis (3, 7). Relevant to the current study, HCV is associated with elevated Cho levels (45, 68, 102). By contrast, Wernicke’s encephalopathy, a neurological disorder caused by thiamine deficiency, is associated with abnormally low Cho levels prior to treatment (63, 79). Our animal models have revealed similar competing effects on Cho levels: high alcohol exposure is associated with elevations in Cho (107, 108, 110, 112), whereas thiamine deficiency, a model for Wernicke’s encephalopathy, is accompanied by reductions in Cho (111).
mI is an organic osmolyte that participates in volume regulatory mechanisms in astrocytes. Specifically, mI is reduced in hypoosmolar conditions but elevated in hyper-osmolar states such as hypernatremia, renal failure and diabetes (10, 49). mI is also elevated in acute MS during active myelin breakdown (27, 54) and in HCV (8) but reduced in anorexia nervosa (17) and hepatic encephalopathy (6, 59, 73, 92), a condition that has neuroinflammatory components (77, 113). Acute alcohol given to humans (5) or rats (2, 12) results in reduced mI, but treatment seeking alcoholdependent patient show elevated mI (94). It is thought that alcoholinduced hyper-osmolarity may trigger mI accumulation in chronic alcoholism in order to stabilize the intracellular environment. These later results support the current finding of higher mI in individuals who have consumed high levels of alcohol. As mentioned, lower levels of mI in individuals on HAART medications may reflect efficacy of treatment.
Few MRS studies have conducted histopathological analysis to confirm that the interpretations of changes to MRS-detectable metabolites are selective, robust and reliable (75). As an initial example, numerous MRS studies reference an in vitro NMR spectroscopy experiment conducted on rat brain tissue extracts to support the claim that mI is a glial marker (eg, 22, 41, 48, 87). However, even the original study (11) cautioned against overinterpretation because “these results (were) obtained from juvenile primary cells (and) cannot necessarily be extrapolated to the situation in the adult brain.” Furthermore, a similar study comparing mI levels in extracts from neuronal and a glioma cell lines found that the concentration of mI from the two cultures was similar (78).
Studies in which correlations between MRS-detectable metabolites and markers for inflammation were conducted expand on this point. In an MRS study of HIV, CSF levels of neopterin, a compound synthesized by macrophages and indicative of a proinflammatory immune status, were found to correlate modestly with higher mI in the posterior cingulate cortex (P = 0.1) and frontal white matter (P = 0.09) (26). In a similar MRS study in HIV, however, CSF neopterin levels did not correlate with MRSdetectable metabolites. This latter study instead showed that early HIV is associated with decreased NAA and Glu indicating neuronal injury (83).
In a macaque model of HIV (ie, simian immunodeficiency virus, SIV), lower NAA/tCr levels correlated with the presence of perivascular histiocytic infiltrates and multinucleated giant cells in brain parenchyma (60). Similarly, other SIV models found coincident increases in the percentage of CD14+CD16+ monocytes and decreases in NAA/tCr (16) with no effects of the infection on the ratios of Cho/tCr or mI/tCr (105). Such results suggest a relationship between NAA levels and inflammation, but NAA is clearly a non-specific marker of neuroinflammation. In a more recent MRS study of SIV, changes in tCr levels did not correlate with glial fibrillary acidic protein (GFAP) (ie, astrocytic) or ionized calcium binding adaptor molecule 1 (Iba-1) (ie, microglial) staining, but there was a modest relationship between higher tCr levels and histological evidence (ie, increased cellularity) for gliosis (88). Similarly, although marked gliosis was observed in postmortem tissue from SIV monkeys, this did not correlate with Cho levels quantified using in vitro MRS (39).
Thus, given the current results and the limited histopathology supporting interpretations of in vivo MRS findings, it is challenging to support the hypothesis that MRS-detectable elevations in mI, Cho and tCr represent a unique and robust pattern of metabolite changes that reflects neuroinflammation. Further considerations include the absence of standardized MRS methodology. For example, even though a number of studies have shown that tCr levels can change with age or disease (eg, 72, 84), tCr is still frequently used as a referent with the assumption that its concentration is stable. Indeed, the techniques currently available for MRS acquisition and analysis vary and are complex, thus making it difficult to achieve consistency across studies (28).
In conclusion, in vivo MRS markers alone are insufficient for identifying neuroinflammation. Indeed, it is unlikely that any single imaging modality will permit discrimination between neuroinflammatory and neurodegenerative mechanisms. A multimodal approach including postmortem histological confirmation will be necessary to achieve selective, robust and reliable markers for neuroinflammation.
Acknowledgments
The authors would like to thank Weiwei Chu for extracting relevant data from our ACCESS database and Priya Asok for her help in data quality assurance. This work was supported by grants from NIAAA and NBIB (AA017347, AA017168, AA013521-INIA, EB008381).
References
- 1.Abers MS, Shandera WX, Kass JS. Neurological and psychiatric adverse effects of antiretroviral drugs. CNS Drugs. 2014;28:131–145. doi: 10.1007/s40263-013-0132-4. [DOI] [PubMed] [Google Scholar]
- 2.Allison JH, Cicero TJ. Alcohol acutely depresses myo-inositol 1-phosphate levels in the male rat cerebral cortex. J Pharmacol Exp Ther. 1980;213:24–27. [PubMed] [Google Scholar]
- 3.Balasubramanya KS, Kovoor JM, Jayakumar PN, Ravishankar S, Kamble RB, Panicker J, Nagaraja D. Diffusion-weighted imaging and proton MR spectroscopy in the characterization of acute disseminated encephalomyelitis. Neuroradiology. 2007;49:177–183. doi: 10.1007/s00234-006-0164-2. [DOI] [PubMed] [Google Scholar]
- 4.Bartels AL, Leenders KL. Neuroinflammation in the pathophysiology of Parkinson’s disease: evidence from animal models to human in vivo studies with [11C]-PK11195 PET. Mov Disord. 2007;22:1852–1856. doi: 10.1002/mds.21552. [DOI] [PubMed] [Google Scholar]
- 5.Biller A, Bartsch AJ, Homola G, Solymosi L, Bendszus M. The effect of ethanol on human brain metabolites longitudinally characterized by proton MR spectroscopy. J Cereb Blood Flow Metab. 2009;29:891–902. doi: 10.1038/jcbfm.2009.12. [DOI] [PubMed] [Google Scholar]
- 6.Binesh N, Huda A, Thomas MA, Wyckoff N, Bugbee M, Han S, et al. Hepatic encephalopathy: a neurochemical, neuroanatomical, and neuropsychological study. J Appl Clin Med Phys. 2006;7:86–96. doi: 10.1120/jacmp.v7i1.2151. [DOI] [PMC free article] [PubMed] [Google Scholar]
- 7.Bizzi A, Ulug AM, Crawford TO, Passe T, Bugiani M, Bryan RN, Barker PB. Quantitative proton MR spectroscopic imaging in acute disseminated encephalomyelitis. AJNR Am J Neuroradiol. 2001;22:1125–1130. [PMC free article] [PubMed] [Google Scholar]
- 8.Bladowska J, Zimny A, Knysz B, Malyszczak K, Koltowska A, Szewczyk P, et al. Evaluation of early cerebral metabolic, perfusion and microstructural changes in HCV-positive patients: a pilot study. J Hepatol. 2013;59:651–657. doi: 10.1016/j.jhep.2013.05.008. [DOI] [PubMed] [Google Scholar]
- 9.Block ML, Hong JS. Microglia and inflammation-mediated neurodegeneration: multiple triggers with a common mechanism. Prog Neurobiol. 2005;76:77–98. doi: 10.1016/j.pneurobio.2005.06.004. [DOI] [PubMed] [Google Scholar]
- 10.Bothwell JH, Rae C, Dixon RM, Styles P, Bhakoo KK. Hypo-osmotic swelling-activated release of organic osmolytes in brain slices: implications for brain oedema in vivo. J Neurochem. 2001;77:1632–1640. doi: 10.1046/j.1471-4159.2001.00403.x. [DOI] [PubMed] [Google Scholar]
- 11.Brand A, Richter-Landsberg C, Leibfritz D. Multinuclear NMR studies on the energy metabolism of glial and neuronal cells. Dev Neurosci. 1993;15:289–298. doi: 10.1159/000111347. [DOI] [PubMed] [Google Scholar]
- 12.Braunova Z, Kasparova S, Mlynarik V, Mierisova S, Liptaj T, Tkac I, Gvozdjakova A. Metabolic changes in rat brain after prolonged ethanol consumption measured by 1H and 31P MRS experiments. Cell Mol Neurobiol. 2000;20:703–715. doi: 10.1023/a:1007002925592. [DOI] [PubMed] [Google Scholar]
- 13.Brooks WM, Stidley CA, Petropoulos H, Jung RE, Weers DC, Friedman SD, et al. Metabolic and cognitive response to human traumatic brain injury: a quantitative proton magnetic resonance study. J Neurotrauma. 2000;17:629–640. doi: 10.1089/089771500415382. [DOI] [PubMed] [Google Scholar]
- 14.Brooks WM, Sibbitt WL, Jr, Kornfeld M, Jung RE, Bankhurst AD, Roldan CA. The histopathologic associates of neurometabolite abnormalities in fatal neuropsychiatric systemic lupus erythematosus. Arthritis Rheum. 2010;62:2055–2063. doi: 10.1002/art.27458. [DOI] [PMC free article] [PubMed] [Google Scholar]
- 15.Callot V, Galanaud D, Le Fur Y, Confort-Gouny S, Ranjeva JP, Cozzone PJ. (1)H MR spectroscopy of human brain tumours: a practical approach. Eur J Radiol. 2008;67:268–274. doi: 10.1016/j.ejrad.2008.02.036. [DOI] [PubMed] [Google Scholar]
- 16.Campbell JH, Burdo TH, Autissier P, Bombardier JP, Westmoreland SV, Soulas C, et al. Minocycline inhibition of monocyte activation correlates with neuronal protection in SIV neuroAIDS. PLoS ONE. 2011;6:e18688. doi: 10.1371/journal.pone.0018688. [DOI] [PMC free article] [PubMed] [Google Scholar]
- 17.Castro-Fornieles J, Bargallo N, Lazaro L, Andres S, Falcon C, Plana MT, Junque C. Adolescent anorexia nervosa: cross-sectional and follow-up frontal gray matter disturbances detected with proton magnetic resonance spectroscopy. J Psychiatr Res. 2007;41:952–958. doi: 10.1016/j.jpsychires.2006.09.013. [DOI] [PubMed] [Google Scholar]
- 18.Cecil KM, Lenkinski RE, Meaney DF, McIntosh TK, Smith DH. High-field proton magnetic resonance spectroscopy of a swine model for axonal injury. J Neurochem. 1998;70:2038–2044. doi: 10.1046/j.1471-4159.1998.70052038.x. [DOI] [PubMed] [Google Scholar]
- 19.Chang L, Ernst T, Leonido-Yee M, Witt M, Speck O, Walot I, Miller EN. Highly active antiretroviral therapy reverses brain metabolite abnormalities in mild HIV dementia. Neurology. 1999;53:782–789. doi: 10.1212/wnl.53.4.782. [DOI] [PubMed] [Google Scholar]
- 20.Chang L, Ernst T, Witt MD, Ames N, Gaiefsky M, Miller E. Relationships among brain metabolites, cognitive function, and viral loads in antiretroviral-naive HIV patients. Neuroimage. 2002;17:1638–1648. doi: 10.1006/nimg.2002.1254. [DOI] [PubMed] [Google Scholar]
- 21.Chang L, Lee PL, Yiannoutsos CT, Ernst T, Marra CM, Richards T, et al. A multicenter in vivo proton-MRS study of HIV-associated dementia and its relationship to age. Neuroimage. 2004;23:1336–1347. doi: 10.1016/j.neuroimage.2004.07.067. [DOI] [PubMed] [Google Scholar]
- 22.Chang L, Munsaka SM, Kraft-Terry S, Ernst T. Magnetic resonance spectroscopy to assess neuroinflammation and neuropathic pain. J Neuroimmune Pharmacol. 2013;8:576–593. doi: 10.1007/s11481-013-9460-x. [DOI] [PMC free article] [PubMed] [Google Scholar]
- 23.Ciccarelli N, Fabbiani M, Di Giambenedetto S, Fanti I, Baldonero E, Bracciale L, et al. Efavirenz associated with cognitive disorders in otherwise asymptomatic HIV-infected patients. Neurology. 2011;76:1403–1409. doi: 10.1212/WNL.0b013e31821670fb. [DOI] [PubMed] [Google Scholar]
- 24.Cosenza MA, Zhao ML, Si Q, Lee SC. Human brain parenchymal microglia express CD14 and CD45 and are productively infected by HIV-1 in HIV-1 encephalitis. Brain Pathol. 2002;12:442–455. doi: 10.1111/j.1750-3639.2002.tb00461.x. [DOI] [PMC free article] [PubMed] [Google Scholar]
- 25.Crovitz HF, Zener KA. Group test for assessing hand and eye dominance. Am J Psychol. 1962;75:271–276. [PubMed] [Google Scholar]
- 26.Cysique LA, Moffat K, Moore DM, Lane TA, Davies NW, Carr A, et al. HIV, vascular and aging injuries in the brain of clinically stable HIV-infected adults: a (1)H MRS study. PLoS ONE. 2013;8:e61738. doi: 10.1371/journal.pone.0061738. [DOI] [PMC free article] [PubMed] [Google Scholar]
- 27.De Stefano N, Matthews PM, Antel JP, Preul M, Francis G, Arnold DL. Chemical pathology of acute demyelinating lesions and its correlation with disability. Ann Neurol. 1995;38:901–909. doi: 10.1002/ana.410380610. [DOI] [PubMed] [Google Scholar]
- 28.De Stefano N, Filippi M, Miller D, Pouwels PJ, Rovira A, Gass A, et al. Guidelines for using proton MR spectroscopy in multicenter clinical MS studies. Neurology. 2007;69:1942–1952. doi: 10.1212/01.wnl.0000291557.62706.d3. [DOI] [PubMed] [Google Scholar]
- 29.Decloedt EH, Maartens G. Neuronal toxicity of efavirenz: a systematic review. Expert Opin Drug Saf. 2013;12:841–846. doi: 10.1517/14740338.2013.823396. [DOI] [PubMed] [Google Scholar]
- 30.Dreher W, Leibfritz D. Detection of homonuclear decoupled in vivo proton NMR spectra using constant time chemical shift encoding: CT-PRESS. Magn Reson Imaging. 1999;17:141–150. doi: 10.1016/s0730-725x(98)00156-8. [DOI] [PubMed] [Google Scholar]
- 31.Filibian M, Frasca A, Maggioni D, Micotti E, Vezzani A, Ravizza T. In vivo imaging of glia activation using 1H-magnetic resonance spectroscopy to detect putative biomarkers of tissue epileptogenicity. Epilepsia. 2012;53:1907–1916. doi: 10.1111/j.1528-1167.2012.03685.x. [DOI] [PubMed] [Google Scholar]
- 32.Fischer-Smith T, Croul S, Adeniyi A, Rybicka K, Morgello S, Khalili K, Rappaport J. Macrophage/microglial accumulation and proliferating cell nuclear antigen expression in the central nervous system in human immunodeficiency virus encephalopathy. Am J Pathol. 2004;164:2089–2099. doi: 10.1016/S0002-9440(10)63767-4. [DOI] [PMC free article] [PubMed] [Google Scholar]
- 33.Fonnum F. Glutamate: a neurotransmitter in the mammalian brain. J Neurochem. 1984;42:1–11. doi: 10.1111/j.1471-4159.1984.tb09689.x. [DOI] [PubMed] [Google Scholar]
- 34.Fulham MJ, Bizzi A, Dietz MJ, Shih HH, Raman R, Sobering GS, et al. Mapping of brain tumor metabolites with proton MR spectroscopic imaging: clinical relevance. Radiology. 1992;185:675–686. doi: 10.1148/radiology.185.3.1438744. [DOI] [PubMed] [Google Scholar]
- 35.Fuller RA, Westmoreland SV, Ratai E, Greco JB, Kim JP, Lentz MR, et al. A prospective longitudinal in vivo 1H MR spectroscopy study of the SIV/macaque model of neuroAIDS. BMC Neurosci. 2004;5:10. doi: 10.1186/1471-2202-5-10. [DOI] [PMC free article] [PubMed] [Google Scholar]
- 36.Gendelman HE, Baldwin T, Baca-Regen L, Swindells S, Loomis L, Skurkovich S. Regulation of HIV1 replication by interferon alpha: from laboratory bench to bedside. Res Immunol. 1994;145:679–684. doi: 10.1016/s0923-2494(05)80054-9. discussion 84–85. [DOI] [PubMed] [Google Scholar]
- 37.Gendelman HE, Persidsky Y, Ghorpade A, Limoges J, Stins M, Fiala M, Morrisett R. The neuropathogenesis of the AIDS dementia complex. AIDS. 1997;11(Suppl A):S35–S45. [PubMed] [Google Scholar]
- 38.Ghafouri M, Amini S, Khalili K, Sawaya BE. HIV-1 associated dementia: symptoms and causes. Retrovirology. 2006;3:28. doi: 10.1186/1742-4690-3-28. [DOI] [PMC free article] [PubMed] [Google Scholar]
- 39.Gonzalez RG, Cheng LL, Westmoreland SV, Sakaie KE, Becerra LR, Lee PL, et al. Early brain injury in the SIV-macaque model of AIDS. AIDS. 2000;14:2841–2849. doi: 10.1097/00002030-200012220-00005. [DOI] [PubMed] [Google Scholar]
- 40.Gonzalez-Scarano F, Martin-Garcia J. The neuropathogenesis of AIDS. Nat Rev Immunol. 2005;5:69–81. doi: 10.1038/nri1527. [DOI] [PubMed] [Google Scholar]
- 41.Govindaraju V, Young K, Maudsley AA. Proton NMR chemical shifts and coupling constants for brain metabolites. NMR Biomed. 2000;13:129–153. doi: 10.1002/1099-1492(200005)13:3<129::aid-nbm619>3.0.co;2-v. [DOI] [PubMed] [Google Scholar]
- 42.Graeber MB. Changing face of microglia. Science. 2010;330:783–788. doi: 10.1126/science.1190929. [DOI] [PubMed] [Google Scholar]
- 43.Graeber MB, Streit WJ, Kreutzberg GW. Axotomy of the rat facial nerve leads to increased CR3 complement receptor expression by activated microglial cells. J Neurosci Res. 1988;21:18–24. doi: 10.1002/jnr.490210104. [DOI] [PubMed] [Google Scholar]
- 44.Gray F, Chretien F, Vallat-Decouvelaere AV, Scaravilli F. The changing pattern of HIV neuropathology in the HAART era. J Neuropathol Exp Neurol. 2003;62:429–440. doi: 10.1093/jnen/62.5.429. [DOI] [PubMed] [Google Scholar]
- 45.Grover VP, Pavese N, Koh SB, Wylezinska M, Saxby BK, Gerhard A, et al. Cerebral microglial activation in patients with hepatitis C: in vivo evidence of neuroinflammation. J Viral Hepat. 2012;19:e89–e96. doi: 10.1111/j.1365-2893.2011.01510.x. [DOI] [PubMed] [Google Scholar]
- 46.Grovit-Ferbas K, Harris-White ME. Thinking about HIV: the intersection of virus, neuroinflammation and cognitive dysfunction. Immunol Res. 2010;48:40–58. doi: 10.1007/s12026-010-8166-x. [DOI] [PubMed] [Google Scholar]
- 47.Haase AT. The AIDS lentivirus connection. Microb Pathog. 1986;1:1–4. doi: 10.1016/0882-4010(86)90026-4. [DOI] [PubMed] [Google Scholar]
- 48.Haris M, Cai K, Singh A, Hariharan H, Reddy R. In vivo mapping of brain myo-inositol. Neuroimage. 2011;54:2079–2085. doi: 10.1016/j.neuroimage.2010.10.017. [DOI] [PMC free article] [PubMed] [Google Scholar]
- 49.Häussinger D, Laubenberger J, Dahl SV, Ernst T, Bayer S, Langer M, et al. Proton magnetic resonance spectroscopy studies on human brain myo-inositol in hypo-osmolarity and hepatic encephalopathy. Gastroenterology. 1994;107:1475–1480. doi: 10.1016/0016-5085(94)90552-5. [DOI] [PubMed] [Google Scholar]
- 50.Heindel WC, Jernigan TL, Archibald SL, Achim CL, Masliah E, Wiley CA. The relationship of quantitative brain magnetic resonance imaging measures to neuropathologic indexes of human immunodeficiency virus infection. Arch Neurol. 1994;51:1129–1135. doi: 10.1001/archneur.1994.00540230067015. [DOI] [PubMed] [Google Scholar]
- 51.Hollingshead A. Four-Factor Index of Social Status. Yale University, Department of Sociology; New Haven, CT: 1975. [Google Scholar]
- 52.Inglese M, Li BS, Rusinek H, Babb JS, Grossman RI, Gonen O. Diffusely elevated cerebral choline and creatine in relapsing-remitting multiple sclerosis. Magn Reson Med. 2003;50:190–195. doi: 10.1002/mrm.10481. [DOI] [PubMed] [Google Scholar]
- 53.Kaul M, Garden GA, Lipton SA. Pathways to neuronal injury and apoptosis in HIV-associated dementia. Nature. 2001;410:988–994. doi: 10.1038/35073667. [DOI] [PubMed] [Google Scholar]
- 54.Koopmans RA, Li DK, Zhu G, Allen PS, Penn A, Paty DW. Magnetic resonance spectroscopy of multiple sclerosis: in-vivo detection of myelin breakdown products. Lancet. 1993;341:631–632. doi: 10.1016/0140-6736(93)90391-s. [DOI] [PubMed] [Google Scholar]
- 55.Kramer-Hammerle S, Rothenaigner I, Wolff H, Bell JE, Brack-Werner R. Cells of the central nervous system as targets and reservoirs of the human immunodeficiency virus. Virus Res. 2005;111:194–213. doi: 10.1016/j.virusres.2005.04.009. [DOI] [PubMed] [Google Scholar]
- 56.Langford D, Masliah E. Crosstalk between components of the blood brain barrier and cells of the CNS in microglial activation in AIDS. Brain Pathol. 2001;11:306–312. doi: 10.1111/j.1750-3639.2001.tb00401.x. [DOI] [PMC free article] [PubMed] [Google Scholar]
- 57.Langford TD, Letendre SL, Marcotte TD, Ellis RJ, McCutchan JA, Grant I, et al. Severe, demyelinating leukoencephalopathy in AIDS patients on antiretroviral therapy. AIDS. 2002;16:1019–1029. doi: 10.1097/00002030-200205030-00008. [DOI] [PMC free article] [PubMed] [Google Scholar]
- 58.Langford TD, Letendre SL, Larrea GJ, Masliah E. Changing patterns in the neuropathogenesis of HIV during the HAART era. Brain Pathol. 2003;13:195–210. doi: 10.1111/j.1750-3639.2003.tb00019.x. [DOI] [PMC free article] [PubMed] [Google Scholar]
- 59.Laubenberger J, Haussinger D, Bayer S, Gufler H, Hennig J, Langer M. Proton magnetic resonance spectroscopy of the brain in symptomatic and asymptomatic patients with liver cirrhosis. Gastroenterology. 1997;112:1610–1616. doi: 10.1016/s0016-5085(97)70043-x. [DOI] [PubMed] [Google Scholar]
- 60.Lentz MR, Westmoreland SV, Lee V, Ratai EM, Halpern EF, Gonzalez RG. Metabolic markers of neuronal injury correlate with SIV CNS disease severity and inoculum in the macaque model of neuroAIDS. Magn Reson Med. 2008;59:475–484. doi: 10.1002/mrm.21556. [DOI] [PMC free article] [PubMed] [Google Scholar]
- 61.Letendre SL, Zheng JC, Kaul M, Yiannoutsos CT, Ellis RJ, Taylor MJ, et al. Chemokines in cerebrospinal fluid correlate with cerebral metabolite patterns in HIV-infected individuals. J Neurovirol. 2011;17:63–69. doi: 10.1007/s13365-010-0013-2. [DOI] [PMC free article] [PubMed] [Google Scholar]
- 62.Mader I, Rauer S, Gall P, Klose U. (1)H MR spectroscopy of inflammation, infection and ischemia of the brain. Eur J Radiol. 2008;67:250–257. doi: 10.1016/j.ejrad.2008.02.033. [DOI] [PubMed] [Google Scholar]
- 63.Mascalchi M, Belli G, Guerrini L, Nistri M, Del Seppia I, Villari N. Proton MR spectroscopy of Wernicke encephalopathy. AJNR Am J Neuroradiol. 2002;23:1803–1806. [PMC free article] [PubMed] [Google Scholar]
- 64.Masliah E, DeTeresa RM, Mallory ME, Hansen LA. Changes in pathological findings at autopsy in AIDS cases for the last 15 years. AIDS. 2000;14:69–74. doi: 10.1097/00002030-200001070-00008. [DOI] [PubMed] [Google Scholar]
- 65.Mattis S. Dementia Rating Scale (DRS) Professional Manual. Psychological Assessment Resources, Inc.; Odessa, FL: 2004. [Google Scholar]
- 66.Mayer D, Spielman DM. Detection of glutamate in the human brain at 3 T using optimized constant time point resolved spectroscopy. Magn Reson Med. 2005;54:439–442. doi: 10.1002/mrm.20571. [DOI] [PubMed] [Google Scholar]
- 67.Mayer D, Zahr NM, Sullivan EV, Pfefferbaum A. In vivo metabolite differences between the basal ganglia and cerebellum of the rat brain detected with proton MRS at 3T. Psychiatry Res. 2007;154:267–273. doi: 10.1016/j.pscychresns.2006.11.005. [DOI] [PMC free article] [PubMed] [Google Scholar]
- 68.McAndrews MP, Farcnik K, Carlen P, Damyanovich A, Mrkonjic M, Jones S, Heathcote EJ. Prevalence and significance of neurocognitive dysfunction in hepatitis C in the absence of correlated risk factors. Hepatology. 2005;41:801–808. doi: 10.1002/hep.20635. [DOI] [PubMed] [Google Scholar]
- 69.McGeer PL, McGeer EG. Inflammation of the brain in Alzheimer’s disease: implications for therapy. J Leukoc Biol. 1999;65:409–415. doi: 10.1002/jlb.65.4.409. [DOI] [PubMed] [Google Scholar]
- 70.McGeer PL, McGeer EG. Inflammation, autotoxicity and Alzheimer disease. Neurobiol Aging. 2001;22:799–809. doi: 10.1016/s0197-4580(01)00289-5. [DOI] [PubMed] [Google Scholar]
- 71.Meyerhoff DJ, Bloomer C, Cardenas V, Norman D, Weiner MW, Fein G. Elevated subcortical choline metabolites in cognitively and clinically asymptomatic HIV+ patients. Neurology. 1999;52:995–1003. doi: 10.1212/wnl.52.5.995. [DOI] [PubMed] [Google Scholar]
- 72.Meyerhoff DJ, Blumenfeld R, Truran D, Lindgren J, Flenniken D, Cardenas V, et al. Effects of heavy drinking, binge drinking, and family history of alcoholism on regional brain metabolites. Alcohol Clin Exp Res. 2004;28:650–661. doi: 10.1097/01.ALC.0000121805.12350.CA. [DOI] [PMC free article] [PubMed] [Google Scholar]
- 73.Miese F, Kircheis G, Wittsack HJ, Wenserski F, Hemker J, Modder U, et al. 1H-MR spectroscopy, magnetization transfer, and diffusion-weighted imaging in alcoholic and nonalcoholic patients with cirrhosis with hepatic encephalopathy. AJNR Am J Neuroradiol. 2006;27:1019–1026. [PMC free article] [PubMed] [Google Scholar]
- 74.Miller BL. A review of chemical issues in 1H NMR spectroscopy: N-acetyl-L-aspartate, creatine and choline. NMR Biomed. 1991;4:47–52. doi: 10.1002/nbm.1940040203. [DOI] [PubMed] [Google Scholar]
- 75.Miller DH. Magnetic resonance spectroscopy: a possible in vivo marker of disease progression for multiple sclerosis? JAMA Neurol. 2014;71:828–830. doi: 10.1001/jamaneurol.2014.896. [DOI] [PubMed] [Google Scholar]
- 76.Minagar A, Shapshak P, Fujimura R, Ownby R, Heyes M, Eisdorfer C. The role of macrophage/microglia and astrocytes in the pathogenesis of three neurologic disorders: HIV-associated dementia, Alzheimer disease, and multiple sclerosis. J Neurol Sci. 2002;202:13–23. doi: 10.1016/s0022-510x(02)00207-1. [DOI] [PubMed] [Google Scholar]
- 77.Monfort P, Cauli O, Montoliu C, Rodrigo R, Llansola M, Piedrafita B, et al. Mechanisms of cognitive alterations in hyperammonemia and hepatic encephalopathy: therapeutical implications. Neurochem Int. 2009;55:106–112. doi: 10.1016/j.neuint.2009.01.021. [DOI] [PubMed] [Google Scholar]
- 78.Moore GJ, Koch S, Chen G, et al. myo-Inositol is not exclusively glial in the human CNS. Proc Intl Soc Mag Reson Med. 1999;7:33. Abstract. [Google Scholar]
- 79.Murata T, Fujito T, Kimura H, Omori M, Itoh H, Wada Y. Serial MRI and (1)H-MRS of Wernicke’s encephalopathy: report of a case with remarkable cerebellar lesions on MRI. Psychiatry Res. 2001;108:49–55. doi: 10.1016/s0925-4927(01)00304-3. [DOI] [PubMed] [Google Scholar]
- 80.Nelson HE. The National Adult Reading Test (NART) Nelson Publishing Company; Windsor, Canada: 1982. [Google Scholar]
- 81.O’Callaghan JP, Sriram K, Miller DB. Defining “neuroinflammation”. Ann N Y Acad Sci. 2008;1139:318–330. doi: 10.1196/annals.1432.032. [DOI] [PubMed] [Google Scholar]
- 82.Peluso R, Haase A, Stowring L, Edwards M, Ventura P. A Trojan Horse mechanism for the spread of visna virus in monocytes. Virology. 1985;147:231–236. doi: 10.1016/0042-6822(85)90246-6. [DOI] [PubMed] [Google Scholar]
- 83.Peluso MJ, Meyerhoff DJ, Price RW, Peterson J, Lee E, Young AC, et al. Cerebrospinal fluid and neuroimaging biomarker abnormalities suggest early neurological injury in a subset of individuals during primary HIV infection. J Infect Dis. 2013;207:1703–1712. doi: 10.1093/infdis/jit088. [DOI] [PMC free article] [PubMed] [Google Scholar]
- 84.Pfefferbaum A, Adalsteinsson E, Spielman D, Sullivan EV, Lim KO. In vivo spectroscopic quantification of the N-acetyl moiety, creatine, and choline from large volumes of brain gray and white matter: effects of normal aging. Magn Reson Med. 1999;41:276–284. doi: 10.1002/(sici)1522-2594(199902)41:2<276::aid-mrm10>3.0.co;2-8. [DOI] [PubMed] [Google Scholar]
- 85.Pulliam L, Herndier BG, Tang NM, McGrath MS. Human immunodeficiency virus-infected macrophages produce soluble factors that cause histological and neurochemical alterations in cultured human brains. J Clin Invest. 1991;87:503–512. doi: 10.1172/JCI115024. [DOI] [PMC free article] [PubMed] [Google Scholar]
- 86.Qian L, Flood PM, Hong JS. Neuroinflammation is a key player in Parkinson’s disease and a prime target for therapy. J Neural Transm. 2010;117:971–979. doi: 10.1007/s00702-010-0428-1. [DOI] [PMC free article] [PubMed] [Google Scholar]
- 87.Ratai EM, Pilkenton SJ, Greco JB, Lentz MR, Bombardier JP, Turk KW, et al. In vivo proton magnetic resonance spectroscopy reveals region specific metabolic responses to SIV infection in the macaque brain. BMC Neurosci. 2009;10:63. doi: 10.1186/1471-2202-10-63. [DOI] [PMC free article] [PubMed] [Google Scholar]
- 88.Ratai EM, Annamalai L, Burdo T, Joo CG, Bombardier JP, Fell R, et al. Brain creatine elevation and N-acetylaspartate reduction indicates neuronal dysfunction in the setting of enhanced glial energy metabolism in a macaque model of neuroAIDS. Magn Reson Med. 2011;66:625–634. doi: 10.1002/mrm.22821. [DOI] [PMC free article] [PubMed] [Google Scholar]
- 89.Rezai-Zadeh K, Gate D, Town T. CNS infiltration of peripheral immune cells: D-Day for neurodegenerative disease? J Neuroimmune Pharmacol. 2009;4:462–475. doi: 10.1007/s11481-009-9166-2. [DOI] [PMC free article] [PubMed] [Google Scholar]
- 90.Rock KL, Latz E, Ontiveros F, Kono H. The sterile inflammatory response. Annu Rev Immunol. 2010;28:321–342. doi: 10.1146/annurev-immunol-030409-101311. [DOI] [PMC free article] [PubMed] [Google Scholar]
- 91.Rogers J, Mastroeni D, Leonard B, Joyce J, Grover A. Neuroinflammation in Alzheimer’s disease and Parkinson’s disease: are microglia pathogenic in either disorder? Int Rev Neurobiol. 2007;82:235–246. doi: 10.1016/S0074-7742(07)82012-5. [DOI] [PubMed] [Google Scholar]
- 92.Ross BD, Jacobson S, Villamil F, Korula J, Kreis R, Ernst T, et al. Subclinical hepatic encephalopathy: proton MR spectroscopic abnormalities. Radiology. 1994;193:457–463. doi: 10.1148/radiology.193.2.7972763. [DOI] [PubMed] [Google Scholar]
- 93.Schuhmann MU, Stiller D, Skardelly M, Bernarding J, Klinge PM, Samii A, et al. Metabolic changes in the vicinity of brain contusions: a proton magnetic resonance spectroscopy and histology study. J Neurotrauma. 2003;20:725–743. doi: 10.1089/089771503767869962. [DOI] [PubMed] [Google Scholar]
- 94.Schweinsburg B, Taylor M, Videen J, Alhassoon O, Patterson T, Grant I. Elevated myo-inositol in gray matter of recently detoxified but not long-term abstinent alcoholics: a preliminary MR spectroscopy study. Alcohol Clin Exp Res. 2000;24:699–705. [PubMed] [Google Scholar]
- 95.Stuckey DJ, Anthony DC, Lowe JP, Miller J, Palm WM, Styles P, et al. Detection of the inhibitory neurotransmitter GABA in macrophages by magnetic resonance spectroscopy. J Leukoc Biol. 2005;78:393–400. doi: 10.1189/jlb.1203604. [DOI] [PubMed] [Google Scholar]
- 96.Tarasow E, Wiercinska-Drapalo A, Jaroszewicz J, Orzechowska-Bobkiewicz A, Dzienis W, Prokopowicz D, Walecki J. Antiretroviral therapy and its influence on the stage of brain damage in patients with HIV—1H MRS evaluation. Med Sci Monit. 2004;10(Suppl. 3):101–106. [PubMed] [Google Scholar]
- 97.Thangnipon W, Taxt T, Brodal P, Storm-Mathisen J. The corticopontine projection: axotomy-induced loss of high affinity L-glutamate and D-aspartate uptake, but not of gamma-aminobutyrate uptake, glutamate decarboxylase or choline acetyltransferase, in the pontine nuclei. Neuroscience. 1983;8:449–457. doi: 10.1016/0306-4522(83)90191-4. [DOI] [PubMed] [Google Scholar]
- 98.Tracey I, Carr CA, Guimaraes AR, Worth JL, Navia BA, Gonzalez RG. Brain choline-containing compounds are elevated in HIV-positive patients before the onset of AIDS dementia complex: a proton magnetic resonance spectroscopic study. Neurology. 1996;46:783–788. doi: 10.1212/wnl.46.3.783. [DOI] [PubMed] [Google Scholar]
- 99.Valcour V, Chalermchai T, Sailasuta N, Marovich M, Lerdlum S, Suttichom D, et al. Central nervous system viral invasion and inflammation during acute HIV infection. J Infect Dis. 2012;206:275–282. doi: 10.1093/infdis/jis326. [DOI] [PMC free article] [PubMed] [Google Scholar]
- 100.Vazeux R, Brousse N, Jarry A, Henin D, Marche C, Vedrenne C, et al. AIDS subacute encephalitis. Identification of HIV-infected cells. Am J Pathol. 1987;126:403–410. [PMC free article] [PubMed] [Google Scholar]
- 101.Vitaliano PP, Breen AR, Albert MS, Russo J, Prinz PN. Memory, attention, and functional status in community-residing Alzheimer type dementia patients and optimally healthy aged individuals. J Gerontol. 1984;39:58–64. doi: 10.1093/geronj/39.1.58. [DOI] [PubMed] [Google Scholar]
- 102.Weissenborn K, Krause J, Bokemeyer M, Hecker H, Schuler A, Ennen JC, et al. Hepatitis C virus infection affects the brain-evidence from psychometric studies and magnetic resonance spectroscopy. J Hepatol. 2004;41:845–851. doi: 10.1016/j.jhep.2004.07.022. [DOI] [PubMed] [Google Scholar]
- 103.Wiley CA. Detection of HIV-1 DNA in microglia/macrophages, astrocytes and neurons isolated from brain tissue with HIV-1 encephalitis by laser capture microdissection. Brain Pathol. 2003;13:415. doi: 10.1111/j.1750-3639.2003.tb00040.x. [DOI] [PMC free article] [PubMed] [Google Scholar]
- 104.Wiley CA, Schrier RD, Nelson JA, Lampert PW, Oldstone MB. Cellular localization of human immunodeficiency virus infection within the brains of acquired immune deficiency syndrome patients. Proc Natl Acad Sci U S A. 1986;83:7089–7093. doi: 10.1073/pnas.83.18.7089. [DOI] [PMC free article] [PubMed] [Google Scholar]
- 105.Williams K, Westmoreland S, Greco J, Ratai E, Lentz M, Kim WK, et al. Magnetic resonance spectroscopy reveals that activated monocytes contribute to neuronal injury in SIV neuroAIDS. J Clin Invest. 2005;115:2534–2545. doi: 10.1172/JCI22953. [DOI] [PMC free article] [PubMed] [Google Scholar]
- 106.Zahr NM, Mayer D, Pfefferbaum A, Sullivan EV. Low striatal glutamate levels underlie cognitive decline in the elderly: evidence from in vivo molecular spectroscopy. Cereb Cortex. 2008;18:2241–2250. doi: 10.1093/cercor/bhm250. [DOI] [PMC free article] [PubMed] [Google Scholar]
- 107.Zahr NM, Mayer D, Vinco S, Orduna J, Luong R, Sullivan EV, Pfefferbaum A. In vivo evidence for alcohol-induced neurochemical changes in rat brain without protracted withdrawal, pronounced thiamine deficiency, or severe liver damage. Neuropsychopharmacology. 2009;34:1427–1442. doi: 10.1038/npp.2008.119. [DOI] [PMC free article] [PubMed] [Google Scholar]
- 108.Zahr NM, Mayer D, Rohlfing T, Hasak M, Hsu O, Vinco S, et al. Brain injury and recovery following binge ethanol: evidence from in vivo magnetic resonance spectroscopy. Biol Psychiatry. 2010;67:846–854. doi: 10.1016/j.biopsych.2009.10.028. [DOI] [PMC free article] [PubMed] [Google Scholar]
- 109.Zahr NM, Mayer D, Rohlfing T, Chanraud S, Gu M, Sullivan EV, Pfefferbaum A. In vivo glutamate measured with magnetic resonance spectroscopy: behavioral correlates in aging. Neurobiol Aging. 2013;34:1265–1276. doi: 10.1016/j.neurobiolaging.2012.09.014. [DOI] [PMC free article] [PubMed] [Google Scholar]
- 110.Zahr NM, Mayer D, Rohlfing T, Orduna J, Luong R, Sullivan EV, Pfefferbaum A. A mechanism of rapidly reversible cerebral ventricular enlargement independent of tissue atrophy. Neuropsychopharmacology. 2013;38:1121–1129. doi: 10.1038/npp.2013.11. [DOI] [PMC free article] [PubMed] [Google Scholar]
- 111.Zahr NM, Alt C, Mayer D, Rohlfing T, Manning-Bog A, Luong R, et al. Associations between in vivo neuroimaging and postmortem brain cytokine markers in a rodent model of Wernicke’s encephalopathy. Exp Neurol. 2014;25:109–119. doi: 10.1016/j.expneurol.2014.06.015. [DOI] [PMC free article] [PubMed] [Google Scholar]
- 112.Zahr NM, Mayer D, Rohlfing T, Hsu O, Vinco S, Orduna J, et al. Rat strain differences in brain structure and neurochemistry in response to binge alcohol. Psychopharmacology (Berl) 2014;231:429–445. doi: 10.1007/s00213-013-3253-z. [DOI] [PMC free article] [PubMed] [Google Scholar]
- 113.Zemtsova I, Gorg B, Keitel V, Bidmon HJ, Schror K, Haussinger D. Microglia activation in hepatic encephalopathy in rats and humans. Hepatology. 2011;54:204–215. doi: 10.1002/hep.24326. [DOI] [PubMed] [Google Scholar]