

Abstract
Background
In breastfed infants, iron deficiency before 6 mo of life, although uncommon, is observed in industrialized countries. Iron supplementation starting at an early age may prevent iron deficiency.
Objective
The study assessed the effect of early iron supplementation of breastfed infants and tested the hypothesis that iron supplementation enhances iron status. Potential adverse effects (tolerance, growth) were monitored.
Design
The prospective, placebo-controlled study involved exclusively breastfed infants who were randomly assigned at 1 mo of age to iron (N=37) or placebo (N=38). Iron (7 mg/d as multivitamin preparation with ferrous sulfate) or Placebo (multivitamin preparation without iron) were given from 1 to 5.5 mo of age. Complementary foods were allowed after 4 mo. Infants were followed to 18 mo of age. Blood concentrations of ferritin, transferrin receptor and hemoglobin as well as red cell indices were determined at bi-monthly intervals. Stool consistency and color and feeding behavior were recorded.
Results
Fe supplementation caused modest augmentation of iron status during the intervention at 4 and 5.5 mo but not thereafter. Iron supplements were well tolerated and had no measurable effect on growth. One infant developed iron deficiency anemia by 5.5 mo of age. Plasma ferritin and hemoglobin tracked over time.
Conclusion
Early iron supplementation of breastfed infants is feasible and transiently increases iron status but not hematologic status. Iron is tolerated by most infants. The prevalence of iron deficiency anemia is low (3%) among unsupplemented breastfed infants in the first 6 mo of life.
Keywords: Iron, breastfed infant, iron supplementation
INTRODUCTION
Full-term infants are born with ample amounts of body iron in the form of hemoglobin iron, storage iron and functional tissue iron. This iron endowment usually provides all the iron the infant needs for growth during the first 4 to 6 mo of life. When the endowment becomes exhausted, the infant requires iron from external sources for growth. Breast milk provides only small amounts (0.2-0.4 mg/L) of highly available iron (1,2) that cannot meet the needs for growth and replacement of losses, estimated at about 0.7 mg per day of absorbed iron (3).
There is evidence that some normal infants are born with diminished iron stores (4-6). Such infants could exhaust their iron endowment and become iron deficient before 6 months of age. Indeed, Makrides et al. (7) reported that in Adelaide, Australia, 1% of 6-month-old breastfed infants had iron deficiency anemia (IDA) and 15% had iron deficiency (ID). Domellöf et al. (8) found the prevalence of IDA among 4-mo-old breastfed infants to be about 1% in Sweden and 3% in Honduras. By 6 mo of age, the prevalence of IDA in Honduras had increased to 18.8% while it was still 1% in Sweden. Similarly, Lind et al. (9) found IDA in about 2% of 6-month-old Swedish infants and ID in 9%. In Norway, Hay et al. (10) reported the prevalence of “low iron status” to be 4% at 6 mo of age. Lozoff et al. (11) reported for Chile that 3.6% of predominantly breastfed infants had IDA at 5-6 mo of age. In Denmark, on the other hand, Michaelsen et al. (12) detected no iron deficiency with or without anemia at 6 mo of age. Iron deficiency in young infants that is severe enough to cause anemia carries the risk of impaired neurocognitive development (11,13).
One strategy for the prevention of ID in breastfed infants could be the provision of iron supplementation beginning before 6 months of age. The present study was designed to test the hypothesis that early iron supplementation augments iron stores of breastfed infants. It would have been desirable to test the hypothesis that iron supplementation prevents iron deficiency, but power calculation indicated that study of the required number of subjects was not feasible. In the present placebo-controlled randomized study, iron supplementation was started at 1 mo of age and was ended at 5.5 mo of age, by which age most breastfed infants receive complementary foods as potential sources of iron. Because iron supplementation has in some studies been shown to have adverse effects on growth (14-17), growth was carefully monitored.
SUBJECTS AND METHODS
Study design
The study was designed as a randomized double-blind, placebo-controlled trial. Normal infants who were exclusively breastfed at 1 mo of age and whose mothers intended to breast feed to at least 5.5 mo of age were enrolled at 1 mo (28 d) of age and followed through 18 mo of age. The study intervention (iron supplementation, Fe, or placebo, Plac) occurred between 1 and 5.5 mo of age. Infants were randomly assigned to one of the study groups at the time of enrollment. Infants visited the study center every 28 days until 12 mo of age and again at 15 and 18 mo. From 1 to 5.5 mo, infants in the Fe Group received daily 7 mg of iron, whereas infants in the Placebo Group received drops of similar appearance but that contained no iron. Blood was obtained by heel stick at enrollment, at 4 mo (112 d), 5.5 mo (168 d), 7 mo (224 d), 9 mo (280 d), 12 mo, 15 mo and 18 mo. Blood was used for determination of plasma concentrations of ferritin (PF), soluble transferrin receptor (sTfR) and hemoglobin, and of red cell indices. C-reactive protein (CRP) was determined in the first 35 subjects but was discontinued thereafter when it was found not to be useful in classifying elevated PF values (see below).
Enrollment occurred in two phases, with an initial phase involving 40 infants (birth dates Feb to Nov 1998) and a second phase involving 35 infants (birth dates Jan to Oct 2001). The hiatus in enrollment was dictated by the availability of funds. Infants in the initial phase were similar in mean weight (4296 g) and length (53.9 cm) at enrollment to infants in the second phase (mean weight 4512 g, mean length 53.9 cm). Infants in the initial phase had significantly lower PF (unadjusted and adjusted) at most ages than infants enrolled in the second phase. However, there was no phase-x-treatment interaction on PF.
Sample size
Sample size was determined on the basis of plasma ferritin concentration (PF), which is proportional to iron stores, the endpoint of primary interest. We reasoned that for early iron supplementation to be clinically useful, it would have to augment iron stores not only during supplementation but also for some time thereafter. We therefore chose as endpoint PF at 9 mo of age, i.e., 3.5 mo after cessation of supplementation. Our own data (18) indicated that in 9-mo-old infants PF concentration has a SD of 16.5 μg/L. We considered a PF difference of 12 μg/L to be clinically relevant. To detect a difference of 12 μg/L at alpha=0.05 and beta=0.20, we needed 31 subjects for a two-sided test. With an estimated attrition rate of 15%, we needed to enroll 74 infants.
Feedings
To be eligible for enrollment at 1 mo of age, infants had to be exclusively breastfed, which was defined as absence of supplemental formula and complementary foods. Vitamin supplements were permitted, but the use of medicinal iron was prohibited at all times. There were otherwise no rules or restrictions regarding the infant’s diet. However, to remain in the study, at 4 mo infants had to be predominantly breastfed (defined as less than 200 ml/d of formula) and at 5.5 mo had to be receiving at least some breast milk. At 4 mo 7 infants received small amounts of supplemental formula, whereas 3 infants (1 at 2 mo, 2 at 4 mo) received more than 200 ml of formula and were dropped from the study. Seven infants received small amounts of infant cereal. At 5.5 mo of age, all of the 63 infants remaining in the study were breastfed, but 17 also received formula and all but two received cereal and/or other complementary foods. At 9 mo, 41 infants were breastfed (14 with supplemental formula and all but two with complementary foods) and 20 infants were fed formula but were no longer breastfed. At 12 mo, 26 infants were breastfed and only 4 of them also received formula; the remaining infants were fed formula (n=10) or cow milk (n=20). At 18 mo of age, 10 subjects were still (partially) breastfed.
Subjects
The subjects were term infants of either gender with birth weight >2500 g who were considered normal by their physicians and the investigators. By chance all were Caucasian. The study team was not involved in providing health care to the subjects. However, when abnormal laboratory results were encountered, the subject’s parents and physician were notified. The study protocol was reviewed and approved by the University of Iowa Institutional Review Board and one parent provided written informed consent for each child.
Of 75 infants enrolled at 1 mo of age, 37 (18 females, 19 males) were randomly assigned to Fe and 38 (19 females, 19 males) to Plac (Figure 1). Four infants (3 Fe, 1 Plac) were withdrawn within 1 month of enrollment because the parents felt that the infants did not “tolerate” the study supplement. Intolerance consisted in constipation (1 Fe, 1 Plac), vomiting (1 Fe) or loose stools (1 Fe). Four additional infants dropped off after enrollment because the family moved away (1 Fe) or for unknown reasons (1 Fe, 2 Plac). Four infants lost eligibility and were excluded because they were no longer predominantly breastfed (1 Fe at 2 mo and 2 Plac at 4 mo) or because the infant (1 Plac) received iron drops prescribed by his physician. Thus, the intervention was completed at 5.5 mo of age by 63 infants (31 Fe, 32 Plac). No data were obtained beyond the point where infants left the study, for whatever reason.
Figure 1.

Flow of participants through the trial
Study supplements
Infants received study supplements from 1 to 5.5 months of age. Infants assigned to Fe received daily 0.7 ml of a vitamin-iron preparation (Tri-Vi-Sol with Iron, Mead Johnson Nutritionals, Evansville, IN). This provided daily 7 mg of iron in the form of ferrous sulfate in addition to 1059 IU of vitamin A, 270 IU of vitamin D and 24.5 mg of vitamin C. From an earlier study (19) we knew that breastfed infants absorb on average 7.8% of supplemental iron given between meals in the form of a vitamin-ferrous sulfate preparation. Infants assigned to the placebo group (Plac) received daily 0.7 ml of a vitamin preparation (Tri-Vi-Sol, Mead Johnson Nutritionals) that provided the same amounts of vitamins but no iron. The supplements were provided in amber 50 ml bottles that were indistinguishable and were labeled only by code. Droppers calibrated at 0.7 ml were provided. The parents were instructed to give the study supplement once a day by dropper directly into the mouth of the infant and to do so just at the beginning of a feeding. Supplement bottles were weighed before dispensing and at each visit parents returned used supplement bottles, which were weighed back to determine the amount of supplement consumed by the infant.
Procedures
Infants visited the study center every 28 days. Visits occurred within the specified tolerance limits of ± 4 d (1-9 mo) and ± 7 d (12-18 mo), respectively, with the exception of 14 visits (5 between 1 and 9 mo and 9 between 12 and 18 mo) which occurred outside these limits. At each visit weight and length were measured using established methods (20) by two individuals (out of a pool of 5) trained in anthropometric methods. Length was measured by 2 measurers who each made separate measurements in alternating positions. If their measurements did not agree to within 4 mm, the measurements were repeated until agreement was reached. The average of the two measurements was used. Scales were calibrated at regular intervals. Before each visit, parents completed a feeding questionnaire and a stool and behavior questionnaire. The feeding questionnaire asked whether the infant was fed formula and/or complementary foods and how much of these the infant typically consumed. In the stool questionnaire the parents recorded for each of the four preceding days the color, number and consistency of stools as well as feeding-related behaviors such as spitting up, fussiness and gas. The questionnaires were checked at the time of the visit for completeness by the nursing staff and any ambiguities were clarified.
Blood Collection and analysis
At selected ages capillary blood was collected by heel stick, using a disposable spring-loaded device (Tenderfoot, International Technidyne Corporation, Edison, NJ). Approximately 1 ml of blood was collected into heparin-treated tubes. Hemoglobin concentration (Hgb) and red cell indices (MCV, RDW) were determined immediately on whole blood using a Coulter AcT diff Hematology Analyzer (Coulter Corporation, Irving, TX). The blood was then centrifuged and plasma used for determination of PF (by radioimmuno assay using the Quantimune kit, Bio-Rad Laboratories, Hercules, CA), sTfR by enzyme immunoassay using the Ramco (Houston, TX) kit (catalog number TF-94). CRP concentration was determined by a two-sided ELISA assay developed in our laboratory.
Data analysis
Iron deficiency was defined as PF < 10 μg/L and anemia as Hb < 105 g/L before 9 mo of age and as Hb<100 g/L at 9 mo and above (21).
Statistical analysis was performed on data from the 63 subjects who completed the intervention to 5.5 mo. Since no data were obtained beyond the point where subjects left the study, intention-to-treat analysis was not performed. Data for 3 infants who developed iron deficiency in the first year of life (see below) were excluded from analysis from the point where treatment with iron or dietary means was initiated. Because there was an inverse correlation of PF with current body weight (but not with birth weight) at all ages except 1 mo, PF values were adjusted for current body weight. And because of a sizable (not significant) difference of PF between groups at 1 mo, PF values were also adjusted for PF at 1 mo. Adjusted and unadjusted PF values showed non-normal distribution at most ages. Statistical analysis was therefore performed after log transformation, but only non-transformed values with arithmetic means and SD are shown. PF and other indicators of iron status were compared between study groups by 2-factor (group, gender) ANOVA procedures. Weight and length measurements were corrected to the exact nominal ages by parabolic interpolation. Weight and length attained and gains in weight and length were compared by ANOVA procedures. Gains in weight and length were also calculated with correction for initial weight and length, respectively, by ANCOVA. Percentiles of weight and length were calculated based on the CDC 2000 growth references (24). Stool and behavior data were expressed as proportions of total observations for each subject. Proportions for study groups were compared by t-test. Total number of stools was also compared by t-test.
Elevated PF: Because ferritin is an acute-phase reactant, during inflammation or infection PF may be elevated and not be reflective of iron stores. The presence of iron deficiency can thus be masked and the size of iron stores overestimated. Unfortunately, concurrent determination of CRP is not a reliable means of identifying PF values that are acute-phase elevated. From our longitudinal data it became evident that PF may sometimes be normal in the presence of elevated CRP, and conversely, PF may be clearly elevated when CRP is normal. Presumably the explanation is that ferritin rises sooner and remains elevated longer than CRP (22,23). We have therefore classified a PF value as “elevated” if it was two-fold greater than the mean of the preceding and subsequent value (or either of these values in the case of PF at 1 and 18 mo). The classification of elevated PF values therefore rested entirely on 2 adjacent PF values and not on CRP.
RESULTS
At 1 mo of age, 37 infants were randomly assigned to Fe and 38 to Plac. Of these, 63 infants (31 Fe, 32 Plac) completed the intervention at 5.5 mo (see Figure 1). The 12 infants who left the study before 5.5 mo included 4 infants (3 Fe, 1 Plac) who were withdrawn because they were felt not to be tolerating the study supplements, 4 infants who were excluded because they ceased being predominantly breastfed (1 Fe, 2 Plac) or because the infant (1 Plac) received iron drops prescribed by his physician, and 4 infants (2 Fe, 2 Plac) who left for other or unknown reasons (see: Subjects for details). Fifty-two subjects completed the study to 18 mo.
Feedings
At 4 mo of age 7 study infants received small amounts (<200 ml/d) of supplemental formula and 7 received small amounts of infant cereal. At 5.5 mo of age, all of the 63 infants remaining in the study were still breastfed, but 17 also received formula and all but two received cereal and/or other complementary foods. At 9 mo, 20 infants were no longer breastfed and were fed formula, and all infants who were breastfed received complementary foods and 14 received supplemental formula. At 12 mo, 23 infants were breastfed and only 4 of them also received formula; the remaining infants were fed formula (n=10) or cow milk (n=20). At 18 mo of age, 10 subjects were still (partially) breastfed. Compliance with the study intervention was very good. Disappearance of supplements among those who completed the intervention averaged 113% of expected (range 88-145%) in Fe and 112% of expected (range 89-130%) in Plac.
Iron status
Iron status data are summarized in Table 1. During the period 1-9 mo a total of 7 PF values were classified as elevated and excluded from data analysis, and between 12 and 18 mo a further 5 PF values were excluded. Data for PF are shown unadjusted as well as adjusted for current body weight and initial PF. Adjusted PF data are shown in Figure 2 for the 63 infants who completed the study. At 1 mo of age mean unadjusted PF was somewhat lower (not statistically significant) in Fe than in Plac. In both study groups,PF showed the expected decline with age. It is evident that iron supplementation slowed down the decline somewhat. The difference between Fe and Plac in unadjusted PF was statistically significant (by ANOVA) at 5.5 and 7.5 mo, whereas the difference in adjusted PF was statistically significant at 4 and 5.5 mo. The age X treatment interaction on adjusted PF was statistically significant at p=0.001 through 5.5 mo. After 7.5 mo neither adjusted nor unadjusted PF differed significantly. At 1 mo unadjusted PF was higher (p=0.05) in females than in males, and PF remained higher at subsequent ages with the exception of 15 and 18 mo. Overall the gender-related difference was significant (p=0.010) for unadjusted PF (not for adjusted PF); there was no gender X treatment interaction on PF at any age.
Table 1.
| Age | 1 mo | 4 mo | 5.5 mo | 7.5 mo | 9 mo | 12 mo | 15 mo | 18 mo | |
|---|---|---|---|---|---|---|---|---|---|
| Number of Subjects | Fe | 31 | 31 | 31 | 31 | 30 | 25 | 25 | 25 |
| Plac | 32 | 32 | 32 | 29 | 29 | 28 | 27 | 27 | |
| PF (μg/L) | Fe | 279 ± 129 | 152 ± 82 | 118 ± 98 | 85 ± 74 | 57 ± 44 | 43 ± 34 | 29 ± 17 | 26 ± 18 |
| Plac | 316 ± 121 | 123 ± 80 | 64 ± 48 | 50 ± 34 | 43 ± 28 | 31 ± 18 | 27 ± 18 | 25 ± 14 | |
| p | 0.0044 | 0.031 | |||||||
| PF adj.3 (μg/L) | Fe | 294 ± 133 | 143 ± 71 | 97 ± 61 | 66 ± 55 | 44 ± 23 | 36 ± 18 | 26 ± 12 | 23 ± 14 |
| Plac | 298 ± 118 | 109 ± 62 | 63 ± 41 | 51 ± 26 | 45 ± 24 | 32 ± 20 | 28 ± 21 | 27 ± 17 | |
| p | 0.038 | 0.009 | |||||||
| sTfR (mg/L) | Fe | 3.76 ±1.34 | 5.65 ± 1.61 | 4.81 ± 1.60 | 5.43 ± 2.04 | 5.33 ±1.71 | 5.51 ±2.04 | 5.34 ± 1.90 | 4.69 ±1.33 |
| Plac | 3.54 ±1.10 | 5.74 ± 1.83 | 6.01 ± 1.57 | 5.77 ± 1.84 | 5.64 ±2.03 | 5.29 ±2.29 | 5.42 ± 2.15 | 5.50 ±1.94 | |
| p | 0.005 | ||||||||
| Ln[sTfR/PF] | Fe | 2.68 ±0.61 | 3.75 ± 0.74 | 3.94 ± 0.95 | 4.32 ± 0.73 | 4.80 ±0.88 | 4.99 ±0.75 | 5.23 ± 0.68 | 5.39 ±0.66 |
| Plac | 2.49 ±0.59 | 4.09 ± 1.00 | 4.78 ± 0.96 | 4.88 ±0.65 | 5.00 ±0.75 | 5.20 ±0.76 | 5.42 ± 0.91 | 5.49 ±0.76 | |
| p | 0.001 | 0.008 | |||||||
| Hgb (g/L) | Fe | 132 ± 17 | 118 ± 7 | 121 ± 9 | 117 ± 9 | 116 ± 9 | 117 ± 10 | 115 ± 10 | 121 ± 10 |
| Plac | 127 ± 13 | 117 ± 7 | 117 ± 8 | 115 ± 10 | 115 ± 8 | 117 ± 7 | 120 ± 8 | 122 ± 8 | |
| p | |||||||||
| RDW (%) | Fe | 15.3 ± 1.0 | 12.2 ± 0.8 | 12.6 ± 0.6 | 13.3 ± 0.9 | 13.3 ± 0.9 | 13.7 ± 0.8 | 13.7 ± 0.8 | 14.2 ± 1.0 |
| Plac | 15.4 ± 0.9 | 12.6 ± 0.9 | 12.9 ± 1.1 | 14.0 ± 1.3 | 14.2 ± 1.3 | 14.2 ± 1.2 | 14.3 ± 1.1 | 14.3 ± 1.1 | |
| p | (0.055) | 0.035 | 0.002 | 0.022 | |||||
| MCV (fL) | Fe | 98 ± 2 | 82 ± 3 | 79 ± 3 | 80 ± 3 | 81 ± 3 | 81 ± 2 | 80 ± 4 | 80 ± 4 |
| Plac | 96 ± 4 | 81 ± 3 | 78 ± 3 | 78 ± 3 | 79 ± 3 | 79 ± 4 | 80 ± 4 | 80 ± 4 | |
| p | 0.046 | 0.010 |
PF= plasma concentration of ferritin, sTfR = plasma concentration of soluble transferrin receptor, Hgb = concentration of hemoglobin. Fe = iron group, Plac = placebo group. Values are means ± SD.
data for 63 subjects who completed intervention at 5.5 mo; data for infants who were treated for iron deficiency excluded after start of treatment
adjusted for current weight and PF at 1 mo (values at 1 mo adjusted only for current weight); values generated from the residuals of regression of log PF on body weight and initial PF. Residuals were added to mean log PF and ant-logarithms were used to generate adjusted PF in original units
values in same column differ significantly between Fe and Plac if a p-level (ANOVA, ANCOVA) is specified
Figure 2.
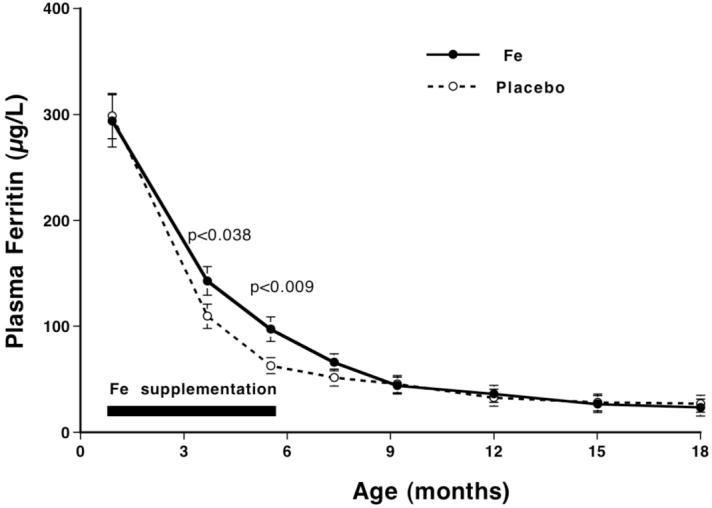
Adjusted plasma ferritin concentration (PF) (adjusted for current weight and PF at 1 mo) between 1 and 18 mo. N=31 in Fe, 32 in Plac at 1 through 5.5 mo, fewer at later ages. Horizontal bar indicates intervention period. Error bars indicate SE. P-values refer to comparisons between Fe and Plac by ANCOVA. The age X treatment interaction was statistically significant at p=0.001.
Plasma sTfR concentrations in both groups were low at 1 mo and rose subsequently. At 5.5 mo but not at other ages, sTfR was significantly lower (p=0.005, ANOVA) in Fe than in Plac. Ln[sTfR/PF] similarly started low at 1 mo and increased subsequently, and did so less in Fe than in Plac. The difference between Fe and Plac was statistically significant at 5.5 mo (p=0.001) and at 7.5 mo (p=0.006). Hemoglobin concentration showed the expected decline between 1 and 4 mo of age but there were no differences between Fe and Plac at any age. On the other hand, RDW was significantly lower in Fe than in Plac at 7.5 mo, 9 mo and 15 mo, and MCV was significantly higher in Fe than in Plac at 7.5 mo and 9 mo. RDW was significantly lower in females than in males overall (p=0.002) and at 5.5 mo, 7.5 mo and 9 mo of age.
Iron deficiency
One infant in Plac developed iron deficiency anemia at 5.5 mo of age with PF of 5 μg/L, sTfR of 9.09 mg/L and Hgb of 93 g/L. This infant at 4 mo of age had PF of 6 μg/L and hemoglobin of 111 g/L. Because PF determinations were at the time run in batches, the low PF was not appreciated until after the visit at 5.5 mo. Treatment with ferrous sulfate was initiated and at 6.5 mo PF was 20 μg/L, sTfR 6.44 mg/L and Hgb 101 g/L. At 1 mo of age this infant had a PF of 60 μg/L, the lowest value observed in the present study at 1 mo of age, suggesting that this infant may have been born with low iron stores. The pregnancy was uncomplicated and the mother took vitamin-iron supplements during pregnancy. Birth weight of the female infant was 3076 g and weight at 5.5 mo was 6410 g. The baby consumed modest amounts of iron-fortified cereal beginning at 4 mo. Another infant in Plac was found to be iron deficient at 5.5 mo with PF of 6 μg/L, but sTfR was 6.80 mg/L and Hgb was 116 g/L. This male infant weighed 4678 g at birth and weighed 9941 g at 5.5 mo of age and consumed iron-fortified cereal beginning at 4 mo. Treatment with iron was recommended but the mother declined and elected instead to feed generous amounts of iron fortified wet-pack cereal. At follow-up one mo later, PF was 31 μg/L, sTfR 9.36 mg/L and Hgb 116 g/L.
One infant in Fe developed anemia at 9 mo (Hgb 91 g/L). Since PF was 13 μg/L and sTfR 6.89 mg/L, iron deficiency seemed to be the cause of the anemia and ferrous sulfate was recommended. The parents instead elected to feed substantial amounts of meat and iron-fortified cereal. One month later PF was still 14 μg/L but hemoglobin was 104 g/L, and 2 mo later PF was 18 μg/L and hemoglobin was 99 g/L. The infant left the study at this point. At 15 and 18 mo of age, 3 subjects in each study group developed iron deficiency without anemia. In each group one subject had PF<10 μg/L both at 15 and at 18 mo and two subjects each had PF<10 μg/L at 18 mo only.
Tracking and relations among iron status indicators
The extent of tracking over age of (unadjusted) PF and Hgb was assessed for the entire study population (Fe and Plac combined) with the use of linear correlation coefficients. As Table 2 shows, tracking of PF was rather strong. Although correlation coefficients tended to decrease with increasing length of interval, they remained statistically significant throughout. Tracking of hemoglobin was also strong for most intervals beginning at 4 mo but was absent for intervals beginning at 1 mo.
Table 2.
Tracking (linear correlation coefficients) among PF and Hgb values, respectively, at different ages. Data for 63 infants who completed the intervention to 5.5 mo
| Age | 4 mo | 5.5 mo | 7.5 mo | 9 mo | 12 mo | 15 mo | 18 mo |
|---|---|---|---|---|---|---|---|
| Plasma ferritin concentration (PF) | |||||||
| 1 mo | 0.568 a | 0.322 a | 0.319 a | 0.387 a | 0.367 a | 0.293 | 0.327 a |
| 4 mo | 0.716 a | 0.609 a | 0.738 a | 0.543 a | 0.348 a | 0.323 a | |
| 5.5 mo | 0.916 a | 0.802 a | 0.799 a | 0.435 a | 0.540 a | ||
| 7.5 mo | 0.718 a | 0.825 a | 0.453 a | 0.557 a | |||
| 9 mo | 0.724 a | 0.526 a | 0.393 a | ||||
| 12 mo | 0.678 a | 0.682 a | |||||
| 15 mo | 0.346 a | ||||||
| Hemoglobin concentration (Hgb) | |||||||
| 1 mo | 0.107 | 0.147 | -0.171 | -0.106 | -0.080 | 0.092 | -0.059 |
| 4 mo | 0.639 a | 0.539 a | 0.412 a | 0.238 | -0.012 | 0.128 | |
| 5.5 mo | 0.581 a | 0.449 a | 0.191 | 0.052 | 0.260 | ||
| 7.5 mo | 0.646 a | 0.297 a | 0.418 a | 0.507 a | |||
| 9 mo | 0.508 a | 0.527 a | 0.402 a | ||||
| 12 mo | 0.670 a | 0.534 a | |||||
| 15 mo | 0.585 a | ||||||
correlation statistically significant (p<0.05)
The relationship among indicators of iron status and of these with weight and weight gain were assessed with linear correlations. PF was, with a single exception, not significantly correlated with sTfR or any hematological indicator. PF was significantly (p<0.05) inversely correlated with weight at all ages except 1 mo, and at some ages also with weight gain. sTfR was not significantly correlated with PF or hematological indicators, with the exception of a correlation with weight at 4 mo and with Hgb at 5.5 mo, the age at which 2 infants in the placebo group were diagnosed with ID. sTfR was significantly correlated with weight at 4 mo. Correlations of Ln[sTfR/PF] mostly followed correlations of PF (with opposite sign).
Stool characteristics
For each infant we obtained 20 days of stool records (4 days preceding each monthly study visit) during the intervention period. There was no difference in consistency and number of stools between Fe and Plac infants at any age. Between 4 mo and 5.5 mo of age, infants in Fe had significantly (p<0.05) more green and black stools than infants in Plac. There were no significant differences in the frequency of regurgitation, fussiness, colic and gassiness between groups.
Growth
Growth data are summarized in Table 3. In spite of random allocation to study groups, male infants in the placebo group were at birth and at enrollment substantially and significantly heavier and longer than infants in the Fe group. The differences persisted at 5.5 mo of age. Although gain in weight was significantly less among Fe females (but not among Fe males) than among Plac females, overall (both genders) weight gain was not significantly different between Fe and Plac. After correction by ANCOVA for initial weight, the difference in weight gain in females was no longer statistically significant. Length was similarly greater in male Plac infants at enrollment, but differences in gain in length were small and not significant and remained non-significant after correction for initial length by ANCOVA. There was no gender X treatment interaction on growth. Mean percentiles for weight and length also reflect the fact that infants in Plac by chance were heavier and longer than infants in Fe. Changes in mean percentiles for weight and length between 1 and 5.5 mo did not differ between Fe and Plac.
Table 3.
Weight, length and gain in weight and length of 63 infants who completed the intervention to 5.5 months1, 2
| Birth weight | Weight 1 mo (g) | Weight 5.5 mo (g) | Weight gain 1-5.5 mo (g/d) (percentile change) | |||||
|---|---|---|---|---|---|---|---|---|
| Fe | Plac | Fe | Plac | Fe | Plac | Fe | Plac | |
| M | 3245±522 | 3982±401 | 4096 ± 613 | 4901a ±504 | 7440 ± 840 | 8289 a ±960 | 23.9 ± 3.6 | 24.2 ± 5.6 |
| (39.5) | (78.2a) | (40.2) | (75.5a) | (41.7) | (67.1 a) | (+1.5) | (-8.3) | |
| n=15 | n=15 | n=15 | n=15 | n=15 | n=15 | n=15 | n=15 | |
| F | 3423±576 | 3591±405 | 4123 ±427 | 4409 ± 489 | 6877 ± 661 | 7581 a ±855 | 19.7± 5.1 | 22.7 a ± 4.6 |
| (47.8) | (61.7) | (51.0) | (65.1) | (45.6) | (67.6 a) | (-5.6) | (+2.5) | |
| n=16 | n=17 | n=16 | n=17 | n=16 | n=17 | n=16 | n=17 | |
| M+F | (43.8) | (69.4 a) | (45.8) | (70.0 a) | (43.6) | (67.4 a) | (-2.1) | (-2.6) |
| Length 1 mo (cm) | Length 5.5 mo (cm) | Length gain 1-5.5 mo (mm/d) (percentile change) | ||||||
|---|---|---|---|---|---|---|---|---|
| Fe | Plac | Fe | Plac | Fe | Plac | |||
| M | 53.1 ± 2.9 | 55.5 a ± 1.5 | 65.5 ± 2.7 | 67.3 a ± 2.1 | 0.882±0.098 | 0.843±0.103 | ||
| (39.7) | (64.5 a) | (43.4) | (62.6 a) | (+3.7) | (-1.9) | |||
| F | 53.2 ± 1.5 | 53.7 ± 1.4 | 64.2 ± 1.5 | 64.8 ± 1.6 | 0.786±0.072 | 0.792±0.061 | ||
| (49.5) | (56.6) | (46.3) | (55.0) | (-3.2) | (-1.6) | |||
| M+F | (44.8) | (60.3 a) | (44.9) | (58.6 a) | (+0.1) | (-1.7) | ||
x̄±SD, M, male; F, female
values in parentheses are mean percentile values, calculated based on the CDC growth reference (24)
value significantly (p<0.05) different from corresponding value in Fe Group by ANOVA and F-test
DISCUSSION
This study demonstrated that supplementation of breastfed infants with medicinal iron (ferrous sulfate) in a dose of 7 mg/d from 1 to 5.5 mo of age of caused some preservation of the iron endowment. But the effect was modest and did not extend beyond the period of supplementation. The small effect size was surprising, given that an earlier study had shown that on average 7.8% of supplemental iron (equal to 0.55 mg/d from intake of 7 mg/d) is absorbed by breastfed infants (19).
In the present study, two infants (6 %) in the placebo group became iron deficient by 5.5 mo of age. This is consistent with the prevalence of iron deficiency reported for other industrialized countries (7-10). One of the two infants developed IDA at 5.5 mo of age and appeared to have been born with diminished iron stores, as indicated by a PF of 60 μg/L at 1 mo of age. Tamura et al. (6) have shown that infants born with low PF concentrations are at risk of impaired neuro-developmental outcome, possibly because of unrecognized iron deficiency during early infancy. Georgieff et al. (5) found that such infants are in poor iron status at 9 mo of age. One infant in the Fe group developed probable IDA at 9 mo of age. In the second year of life, 6 infants developed ID, which was mild (without anemia) and was mostly transient.
An earlier study by Friel et al. (25) with a design similar to the present study also found that iron supplementation of breastfed infants led to a slowing down of the decrease of PF. But contrary to the present study, Friel et al. (25) found a significant effect of iron on hemoglobin but not on PF at the end of the supplementation period at 6 mo of age. Also in contrast to the present study, 33% of infants receiving placebo and 7% of infants receiving iron were iron deficient (PF<12 μg/L) at 6 months; 14% of infants receiving placebo had IDA at 6 months.
Given the potential of severe iron deficiency to cause long-term behavioral abnormalities (11,13), efforts to prevent iron deficiency among breastfed infants are warranted. Preventive strategies include screening with selective supplementation, and universal supplementation. The purpose of the present study was to assess the feasibility and the effectiveness of universal supplementation. Iron deficiency among breastfed babies has been reported at 4 mo to 6 mo of age, but the earliest age at which it can occur in full-term infants is not known. We elected to start iron supplementation at 1 mo of age. Because complementary foods as possible sources of iron are not customarily fed at that early an age, we chose medicinal iron as the source of iron. Iron was given through 5.5 mo of age, an age by which complementary foods have customarily been introduced and are relied upon to provide iron to the infant. Because of financial constraints the present trial was able to assess only the effect of medicinal iron on iron status and not whether it prevents iron deficiency or has adverse effects.
The ferrous sulfate-multivitamin preparation was well tolerated by most study infants and was, with the exception of a tendency to more greenish stools, free of side effects. Ferrous sulfate has a metallic taste and infants are often said to be reluctant to take it. But in our study no mother reported consistent difficulty or inability to administer the study supplements. Although 3 infants (8%) had side effects, the effects were not consistent. The fact that our extensive stool and behavior data showed no differences between Fe and Plac suggests that ferrous sulfate given as part of a multivitamin preparation is tolerated without side effects by the great majority of infants. Dewey et al. (15) reported a significant negative effect of iron supplementation on length gain among Swedish infants (but not among Honduran infants) between 4 and 9 months of age. In young Indonesian children (12 - 18 mo), Idjradinata et al. (14) showed that iron supplementation slowed growth significantly. Iron supplementation of iron replete, but not of iron deplete, infants and children was reported by Majumdar et al. (16) and by Lind et al. (17) to reduce growth. On the other hand, in the study by Dijkhuizen et al. (26) iron supplementation between 4 and 10 mo was found to have no effect on growth, but that study did not take into account the initial iron status of subjects. Thus it appears that the deleterious effects of iron are limited to infants with replete iron stores.
Infants in the present study had replete iron stores, but iron supplementation had no unequivocal effect on growth. In particular there was no suggestion of an effect on length gain. Subgroup analysis showed that Fe significantly decreased weight gain (but not length gain) of female infants. This leaves open the possibility that Fe has an effect on weight gain in females only. Another possibility is that interpretation of growth data in our male infants was compromised by the high birth weight of these infants, so that an effect may have been concealed in male infants as well as in the combined genders. Also, the study was powered to detect large effects on iron status and therefore could have missed a modest-size effect on growth. In the present study iron was given right before a feeding and not between feedings, which may have limited the amount of iron absorbed. Also, most infants received some other foods (cereal, formula) during the latter part of the intervention period (from 4 to 5.5 mo).
The present study had limitations. Due to limited sample size, the study could not determine whether iron supplementation prevents iron deficiency. Also, it had sufficient statistical power only to detect relatively large adverse effects but not modest-size effects, for example on growth. Infants who left the study early were not followed, which did not allow for intention-to-treat analysis. The study had a weakness in that by chance there was a substantial difference in weight and length of subjects at birth and throughout the intervention period. This weakened the interpretation of the growth data and may have confounded the iron status data. A strength of the study was that infants were observed longitudinally from 1 to 18 mo of age and that plasma ferritin was determined at 1 mo, which provided a measure of the iron endowment at birth.
Plasma ferritin showed strong tracking across ages, with significant correlations between values obtained as far apart as 17 mo. Hay et al. (10) reported tracking of serum ferritin between 6 and 12 mo (r=0.34) but not between 6 mo and 24 mo or between 12 mo and 24 mo. Hernell and Lönnerdal (27) reported “strong tracking” (no data given) of serum ferritin and other indicators of iron status. Gender-related differences have been described by other investigators. Hay et al. (10) found significantly higher ferritin concentrations at 6 mo in girls than in boys. MCV was also higher in girls than boys at 6, 12 and 24 mo. Domellöf et al. (28) found girls to have higher PF, Hgb and MCV and lower TfR than boys at 4 mo, 6 mo and 9 mo of age.
In conclusion, the present study has shown that iron supplementation of breastfed infants from an early age is feasible but is only moderately effective in temporarily preserving the infants’ iron endowment. Although no adverse effects if iron were detected, the study’s power to detect adverse effects was limited. Two infants who did not receive iron became iron deficient by 5.5 mo of age (one with anemia). Whether iron supplementation is effective in preventing iron deficiency would need to be studied in a larger cohort. However, because of the low prevalence of early iron deficiency, screening with selective treatment would seem to be a more suitable approach to the prevention of iron deficiency than universal supplementation.
Acknowledgement
We thank Charles Rebouche, Ph.D., and Joyce Dunlap, CLA for performing the laboratory analyses. Assistance with statistical analysis by Hannes Ledolter, PhD, is gratefully acknowledged.
Footnotes
Supported by the National Institutes of Health (grant HD40315) and by Mead Johnson Nutritionals, Evansville, IN, through a grant and donation of the iron-vitamin supplements.
LITERATURE CITED
- 1.Saarinen UM, Siimes MA, Dallman PR. Iron absorption in infants: High bioavailability of breast milk iron as indicated by the extrinsic tag method of iron absorption and by the concentration of serum ferritin. J Pediat. 1977;91:36–39. doi: 10.1016/s0022-3476(77)80439-3. [DOI] [PubMed] [Google Scholar]
- 2.Hicks PD, Zavaleta N, Chen Z, Absrams SA, Lönnerdal B. Iron deficiency, but not anemia, upregulates iron absorption in breast-fed Peruvian infants. J Nutr. 2006;136:2435–38. doi: 10.1093/jn/136.9.2435. [DOI] [PubMed] [Google Scholar]
- 3.Food and Nutrition Board. Institute of Medicine . Dietary reference intakes for vitamin A, vitamin K, arsenic, boron, chromium, copper, iodine, iron, manganese, molybdenum, nickel, silicon, vanadium and zinc. National Academy Press; Washington: 2000. [Google Scholar]
- 4.Georgieff MK, Landon MB, Mills MM, Hedlund BE, Faassen AE, Schmidt RL, Ophoven JJ, Widness JA. Abnormal iron distribution in infants of diabetic mothers: Spectrum and maternal antecedents. J. Pediatr. 1990;117:455–61. doi: 10.1016/s0022-3476(05)81097-2. [DOI] [PubMed] [Google Scholar]
- 5.Georgieff MK, Wewerka SW, Nelson CA, de Regnier R-A. Iron status at 9 months of infants with low iron stores at birth. J. Pediatr. 2002;141:405–9. doi: 10.1067/mpd.2002.127090. [DOI] [PubMed] [Google Scholar]
- 6.Tamura T, Goldenberg RL, Hou J, Johnston KE, Cliver SP, Ramey SL, Nelson KG. Cord serum ferritin concentrations and mental psychomotor development of children at five years of age. J Pediatr. 2002;140:165–70. doi: 10.1067/mpd.2002.120688. [DOI] [PubMed] [Google Scholar]
- 7.Makrides M, Leeson R, Gibson RA, Simmer K. A randomized controlled clinical trial of increased dietary iron in breast-fed infants. J Pediat. 1998;133:559–62. doi: 10.1016/s0022-3476(98)70069-1. [DOI] [PubMed] [Google Scholar]
- 8.Domellöf M, Cohen RJ, Dewey KG, Hernell O, Rivera LL, Lönnerdal B. Iron supplementation of breast-fed Honduran and Swedish infants from 4 to 9 months of age. J Pediatr. 2001;138:679. doi: 10.1067/mpd.2001.112895. [DOI] [PubMed] [Google Scholar]
- 9.Lind T, Lönnerdal B, Persson L-A, Stenlund H, Tennefors K, Hernell O. Effects of weaning cereals with different phytate contents on hemoglobin, iron stores, and zinc: a randomized intervention in infants from 6 to 12 mo of age. Am J Clin Nutr. 2003;78:168–75. doi: 10.1093/ajcn/78.1.168. [DOI] [PubMed] [Google Scholar]
- 10.Hay G, Sandstad B, Whitelaw A, Borch-Iohnsen B. Iron status in a group of Norwegian children aged 6-24 months. Acta Paediatr. 2004;93:592–598. [PubMed] [Google Scholar]
- 11.Lozoff B, De Andraca I, Castillo M, Smith JB, Walter T, Pino P. Behavioral and developmental effects of preventing iron-deficiency anemia in healthy full-term infants. Pediatrics. 2003;112:846–54. [PubMed] [Google Scholar]
- 12.Michaelsen KF, Milman N, Samuelson G. A longitudinal study of iron status in healthy Danish infants: effects of early iron status, growth velocity and dietary factors. Acta Paediatr. 1995;84:1035–44. doi: 10.1111/j.1651-2227.1995.tb138212.x. [DOI] [PubMed] [Google Scholar]
- 13.Lozoff B, Beard J, Connor J, Felt B, Georgieff M, Schallert T. Long-lasting neural and behavioral effects of iron deficiency in infancy. Nuttr Rev. 2006;64:S34–43. doi: 10.1301/nr.2006.may.S34-S43. [DOI] [PMC free article] [PubMed] [Google Scholar]
- 14.Idjradinata P, Watkins WE, Pollitt E. Adverse effect of iron supplementation on weight gain of iron-replete young children. Lancet. 1994;343:1252–54. doi: 10.1016/s0140-6736(94)92151-2. [DOI] [PubMed] [Google Scholar]
- 15.Dewey KG, Dommellöf M, Cohen RJ, Rivera LL, Hernell O, Lönnerdal B. Iron supplementation affects growth and morbidity of breast-fed infants: Results of a randomized trial in Sweden and Honduras. J Nutr. 2002;1342:3249–55. doi: 10.1093/jn/132.11.3249. [DOI] [PubMed] [Google Scholar]
- 16.Majumdar I, Paul P, Talib H, Ranga S. The effect of iron therapy on the growth of iron-replete and iron-deplete children. J Trop Pediat. 2003;49:84–88. doi: 10.1093/tropej/49.2.84. [DOI] [PubMed] [Google Scholar]
- 17.Lind T, Seswandhana R, Persson L-A, Lönnerdal B. Iron supplementation of iron-replete Indonesian infants is associated with reduced weight-for-age. Acta Paediat. 2008;97:770–775. doi: 10.1111/j.1651-2227.2008.00773.x. [DOI] [PubMed] [Google Scholar]
- 18.Ziegler EE, Jiang T, Romero E, Vinco A, Frantz JA, Nelson SE. Cow’s milk and intestinal blood loss in late infancy. J Pediatr. 1999;135:720–6. doi: 10.1016/s0022-3476(99)70091-0. [DOI] [PubMed] [Google Scholar]
- 19.Fomon SJ, Ziegler EE, Nelson SE, Serfass RE, Frantz JA. Erythrocyte incorporation of iron by 56-day-old infants fed a 58Fe-labeled supplement. Pediatr Res. 1995;38:373–78. doi: 10.1203/00006450-199509000-00017. [DOI] [PubMed] [Google Scholar]
- 20.Fomon SJ, Nelson SE. Size and growth. In: Fomon SJ, editor. Nutrition of Normal Infants. Mosby; St. Louis: 1993. pp. 36–84. [Google Scholar]
- 21.Domellöf M, Dewey KG, Lönnerdal B, Cohen RJ, Hernell O. The diagnostic criteria for iron deficiency should be reevaluated. J Nutr. 2002;132:3680–6. doi: 10.1093/jn/132.12.3680. [DOI] [PubMed] [Google Scholar]
- 22.Beard JL, Murray-Kolb LE, Rosales FJ, Solomons NW, Angelilli ML. Interpretation of serum ferritin concentrations as indicators of total-body iron stores in survey populations: the role of biomarkers for the acute phase response. Am J Clin Nut. 2006;84:1498–505. doi: 10.1093/ajcn/84.6.1498. [DOI] [PubMed] [Google Scholar]
- 23.Feelders RA, Vreugdenhil G, Eggermont AMM, Kuiper-Kramer PA, van Eijk HG, Swaak AJG. Regulation of iron metabolism in the acute-phase response: interferon γ and tumour necrosis factor α induce hypoferraemia, ferritin production and a decrease in circulating transferrin receptors in cancer patients. Eur J Clin Invest. 1998;28:520–527. doi: 10.1046/j.1365-2362.1998.00323.x. [DOI] [PubMed] [Google Scholar]
- 24.Ogden CL, Kuczmarski RJ, Flegal KM, Mei Z, Guo S, Wei R, Grummer-Strawn LM, Curtin LR, Roche AF, Johnson CL. Centers for Disease Control and Prevention 2000 growth charts for the United States: Improvements to the 1977 National Center for Health Statistics version. Pediatrics. 2002;109:45–60. doi: 10.1542/peds.109.1.45. [DOI] [PubMed] [Google Scholar]
- 25.Friel JK, Aziz K, Andrews WL, Harding SV, Courage ML, Adams RJ. A double-blind, randomized control trial of iron supplementation in early infancy in healthy term breast-fed infants. J Pediatr. 2003;143:582–6. doi: 10.1067/S0022-3476(03)00301-9. [DOI] [PubMed] [Google Scholar]
- 26.Dijkhuizen MA, Wieringa FT, West CE, Martuti S, Muhilal Effects of iron and zinc supplementation in Indonesian infants on micronutrient status and growth. J Nutr. 2001;131:2860–65. doi: 10.1093/jn/131.11.2860. [DOI] [PubMed] [Google Scholar]
- 27.Hernell O, Lönnerdal B. Iron status of infants fed low-iron formula: no effect of added bovine lactoferrin or nucleotides. Am J Clin Nutr. 2002;76:858–64. doi: 10.1093/ajcn/76.4.858. [DOI] [PubMed] [Google Scholar]
- 28.Domellöf M, Lönnerdal B, Dewey KB, Cohen RJ, Rivera LL, Hernell O. Sex differences in iron status during infancy. Pediatrics. 2002;110:545–52. doi: 10.1542/peds.110.3.545. [DOI] [PubMed] [Google Scholar]