Abstract
The inhibitory effect of NO-donating aspirin (NO-ASA) on colon cancer has been demonstrated in vivo and in vitro but its mechanism is still obscure. We investigated the effect of NO-ASA on angiogenesis. Four groups of athymic mice (N = 12) bearing subcutaneous xenotransplants of HT-29 human colon cancer cells were injected intratumorally twice a week for 3 weeks with vehicle or m-NO-ASA or p-NO-ASA; the fourth group received no injections. The necrotic area of tumors, expressed as percentage of total area, was similar in the non-injected and vehicle-injected groups (51.8 ± 2.8 versus 52.2 ± 4.1, P > 0.05; mean ± SEM for these and subsequent values). Compared with the vehicle group, the necrotic area of tumors was higher in the m-NO-ASA-treated (61.0 ± 2.7, P < 0.02) and p-NO-ASA (65.8 ± 2.4, P < 0.001)-treated groups. NO-ASA decreased microvessel density: vehicle = 11.7 ± 0.8; m-NO-ASA = 7.8 ± 0.6 (P = 0.0003 versus vehicle) and p-NO-ASA 6.2 ± 0.7 (P = 0.0001 versus vehicle). The expression of vascular endothelial growth factor (VEGF) was significantly reduced in response to NO-ASA, with the p- isomer being more potent than the m-. NO-ASA altered the spatial distribution of VGEF expression, with 16.7% of the vehicle-treated xenografts displaying diminished VEGF in the inner region of the area between necrosis and the outer perimeter of the tumor, compared with those treated with m- (58.3%) or p-NO-ASA (75%, P < 0.01 for both versus control). Our findings indicate that NO-ASA suppresses the expression of VEGF, which leads to suppressed angiogenesis. The antiangiogenic activity of NO-ASA may be part of its antineoplastic effect.
Introduction
The novel NO-donating non-steroidal anti-inflammatory drugs promise to bring to cancer prevention two highly desirable properties: greater safety and greater efficacy compared with their conventional counterparts [(1) and reviewed in ref. 2]. In vitro and in vivo studies indicate that NO-donating non-steroidal anti-inflammatory drugs (NSAIDs) are much more effective than traditional NSAIDs in modulating cancer cell kinetics and in inhibiting the formation of neoplastic lesions in the colon and pancreas (3–5).
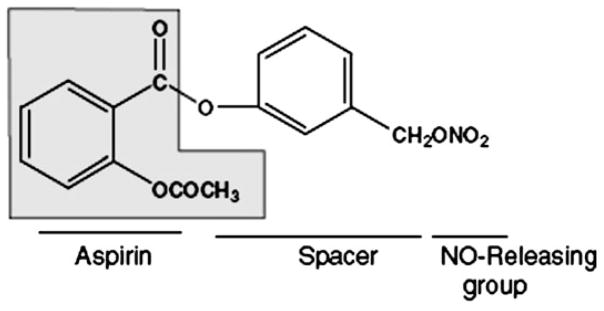
Of the available NO-donating non-steroidal anti-inflammatory drugs, NO-donating aspirin (NO-ASA) is the most likely contender for use as a chemopreventive agent (Figure 1); most of the relevant work has focused on its meta and para positional isomers (6). NO-ASA’s mechanism of action as a chemopreventive agent against colon and other cancers is complex and not fully understood (7,8). Indeed, several studies have attempted to decipher the mechanism underlying the remarkable efficacy of NO-ASA. It is now clear that NO-ASA targets multiple signaling mechanisms in the neoplastic cell, including modulation of NO synthesis and cell signaling mediated by the NF-κB, Wnt, mitogen-activated protein kinases and other pathways, but the relative contribution of each effect remains unknown (9–12).
Fig. 1.
NO-ASA. The structure of the meta positional isomer highlights its main components: conventional aspirin (shaded), the NO-donating moiety (-ONO2) and the chemical spacer linking the two.
Several biological processes are essential for tumor growth and progression. In general, they include increased cell proliferation and decreased apoptosis. In addition, alterations in cell cycle phase distribution, cellular adhesion, cellular migration and angiogenesis promote the development and growth of tumors. Among them, angiogenesis is considered a critical requirement for the growth of any solid tumor. Initially thriving on oxygen diffused from pre-existent neighboring vessels, tumor cells, like any tissue in the body, need direct blood supply to grow beyond a minimum size of 2–3 mm3 [reviewed in ref. 13]. A variety of factors have been described that either promote (angiogenic) or inhibit (angiostatic) angiogenesis, a process that sustains tumor growth. An important angiogenic factor is the vascular endothelial growth factor-A (VEGF-A), which has a multitude of vascular effects. VEGF-A is overproduced under the transcriptional control of hypoxia inducible factor-1, which, in turn, responds to tumor hypoxia. The VEGF-A gene is expressed as multiple splice variants, among them isoforms with 121, 145, 165 and 189 amino acids; VEGF-A121 is the only freely diffusible isoform [reviewed in ref. 14]. VEGF-A fragments, generated by plasmin or matrix metalloproteinases, activate signaling cascades (starting with VEGF receptors) that elicit the growth of new blood vessels. Inhibitors of the process of angiogenesis have already been developed, most of them interfering with signal transduction by VEGF receptors (15,16).
In the present study, we used HT-29 xenografts in nude mice to explore whether NO-ASA inhibits tumor-associated angiogenesis. Our findings document a significant antiangiogenic effect of NO-ASA mediated by VEGF suppression, and suggest that inhibition of angiogenesis may be a significant part of the action of NO-ASA against colon cancer.
Materials and methods
Cell line and reagents
The human colon cancer cell line HT-29 (American Type Tissue Collection, Manassas, VA) was cultured in McCoy’s 5A medium (Mediatech, Herndon, VA) containing 10% heat-inactivated fetal bovine serum (Hyclone, Logan, UT). NO-ASA was prepared fresh in 0.5% methyl carboxycellulose (Sigma, St Louis, MO) prior to its administration to mice. Antibodies were from Santa Cruz Biotechnology, Santa Cruz, CA, except for the anti-VEGF antibody (recognizes the ~34–50 kDa isoforms of VEGF), which was from Calbiotech (Spring Valley CA).
Xenograft tumor model
Male athymic nu/nu mice aged 5 weeks (Harlan Bioproducts, Indianapolis, IN) were maintained in a maximum isolation environment, according to an institutionally approved animal protocol, and given food and water ad libitum. After 1 week’s acclimation, 1 × 10⁶ HT-29 cells suspended in 100 μl of sterile Dulbecco’s phosphate-buffered saline (Mediatech) were implanted subcutaneously into the right flank of each mouse. The animals were divided into three groups and after 3 weeks, they were injected intratumorally twice a week for 3 weeks with vehicle (group 1) or 200 μl of a 300 μM solution of m-NO-ASA (group 2) or p-NO-ASA (group 3). At the end of the study period, mice were euthanized and the tumors, cut sagittally, were fixed in 10% buffered formalin.
Measurement of the necrotic area of tumors
Paraffin-embedded sections were stained with hematoxylin and eosin. The slides were scanned to obtain the entire tumor surface area in its greatest dimensions. Using the ImageJ program (http://rsb.info.nih.gov/ij/), we measured the surface area of both the entire tumor and its necrotic region; the latter was expressed as a percentage of the former.
Measurement of microvessel density
Microvessel density (MVD) was measured by determining endothelial cell staining using the anti-Platelet endothelial cell adhesion molecule-1 (anti-PCAM-1) antibody. Any brown-stained endothelial cell cluster that was separated from adjacent microvessels was considered a single countable micro-vessel. Vessel lumens were not necessary for a structure to be defined as a microvessel. We selected six peritumoral view fields per slide corresponding to 2, 4, 6, 8, 10 and 12 o’clock positions (×200 magnification) and the average value was calculated as the MVD of each sample. The scoring of these slides (as well as for the immunohistochemistry described below) was determined by two independent appraisers who were blinded to the identity of the slides.
Immunohistochemistry
Paraffin sections were deparaffinized, rehydrated and antigen retrieval obtained by heating in a microwave for 15 min in 0.01 M citrate buffer (pH 6.0). Endogenous peroxidase activity was blocked by applying 3% hydrogen peroxide. After 15 min of blocking with horse serum, the primary antibody VEGF at 1:100, PECAM-1 at 1:100 or the control isotype IgG was applied and incubated overnight at 4°C. Slides were washed three times with phosphate-buffered saline for 5 min. The biotinylated secondary antibody and the streptavidin–biotin complex (Vector Laboratories, Burlingame, CA) were applied, each for 30 min at room temperature with interval washings. After rinsing with phosphate-buffered saline, the slides were immersed for 5 min in the coloring substrate 3,3′-diaminobenzidine (Sigma) at 0.4 mg/ml with 0.003% hydrogen peroxide, rinsed with distilled water, counterstained with hematoxylin, dehydrated and a coverslip was applied.
Scoring for VEGF expression
We used the following scale: negative staining for VEGF was scored as 0. The positive staining of VEGF was scored as: weak = 1, medium = 2 and strong = 3. Tumor cells with no, weak, medium and strong VEGF staining were expressed, respectively, as a percentage of the total tumor cells. We selected six peritumoral view fields per slide corresponding to 2, 4, 6, 8, 10 and 12 o’clock positions (×400 magnification) and the average value was calculated for each sample.
Scoring for the pattern of VEGF expression
In some tumors, the expression of VEGF was stronger in the outer region of the area between necrosis and the outer perimeter of the tumor and weak or absent in their inner region, creating a pattern of unequal VEGF distribution. In each group of mice, we determined the percentage of tumors showing this pattern of unequal distribution in VEGF expression.
Statistical methods
Initially, data were examined descriptively using means, standard deviations and graphs. Each outcome was tested for normality using Kolmogorov–Smirnov test statistics and normal probability plots. MVD and percentage of tumor area necrotic levels were compared among treatment and control groups using one-way analysis of variance followed by Dunnett’s post hoc comparisons procedure where each treatment is compared with control and Type-I error is adjusted. All results were considered significant at P < 0.05 (17). In all other instances, outcomes between animal groups were compared using either the unpaired t-test or the χ2 test.
Results
NO-ASA induces necrosis in xenografts of HT-29 human colon cancer cells
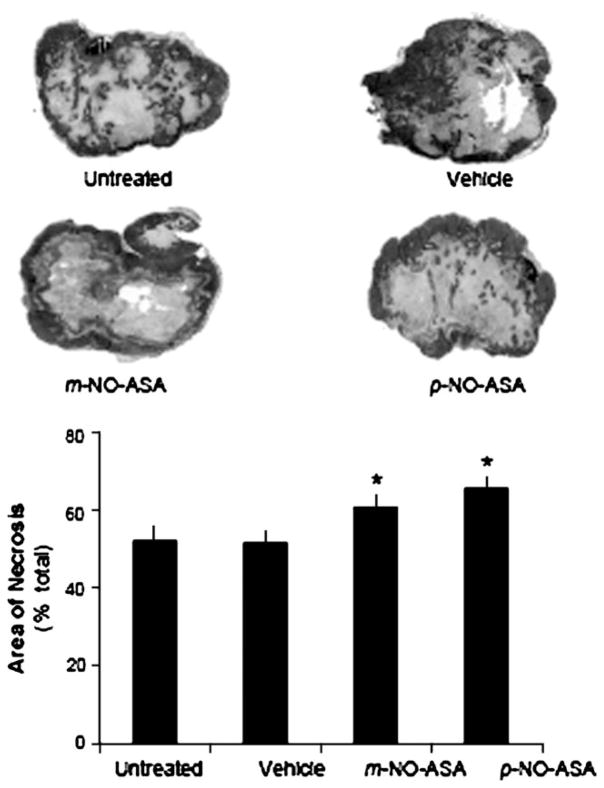
Necrotic areas were seen in all xenografts. As shown in Figure 2, the area of necrosis in the treated xenografts was more extensive and contiguous, often reaching the outer surface of the tumor. In contrast, in untreated and vehicle-treated tumors the area of necrosis had a discontinuous appearance and was mostly centrally located. Measurement of the area of necrosis revealed that vehicle-injected tumors had virtually identical areas of necrosis compared with the untreated group, expressed as percentage of the total area (51.8 ± 2.8 versus 52.2 ± 4.1; mean ± SEM for these and all subsequent values). In contrast, the necrotic areas of tumors in the p-NO-ASA-treated group (65.8 ± 2.4) and in m-NO-ASA-treated group (61.0 ± 2.7) were higher than that in vehicle group (51.8 ± 2.8). In the analysis evaluating percentage of tumor area that was necrotic, the overall group effect was significant [F(3,41) = 5.52, P = 0.003]. Post hoc tests showed p-NO-ASA treatment [t(41) = 3.49, Dunnett-adjusted P = 0.003) exhibiting significantly higher percentage of necrotic levels relative to vehicle control, whereas m-NO-ASA treatment [t(41) = 2.31, Dunnett-adjusted P = 0.07] trended toward a similar effect.
Fig. 2.
NO-ASA induces necrosis in HT-29 xenografts. Representative micrographs of tumors form the four study groups. There were 12 mice per group, except for the untreated group (n = 8). Tissues, processed as described in Materials and Methods, were stained with hematoxylin and eosin and the area of necrosis was measured. *Statistically significant difference compared with the vehicle control group. The histogram shows the mean ± SEM of the necrotic area expressed as percentage of the total tumor section surface area. Magnification ×5.
The difference between m-NO-ASA and p-NO-ASA was not statistically significant. These changes correspond to a 17 and 27% increase over vehicle in response to m- and p-NO-ASA, respectively.
The differences in the total surface area of the tumors between the four groups were not statistically significant (data not shown).
NO-ASA decreases MVD in xenografts
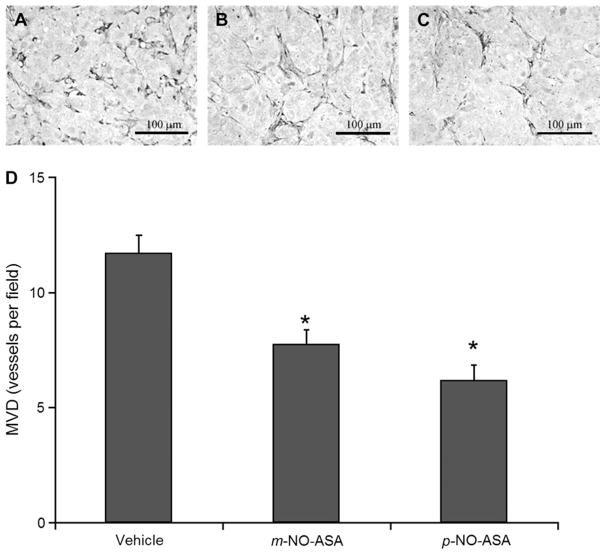
To gain an understanding of the mechanism underlying the necrotic effect of NO-ASA, we examined the possibility that this could be due to decreased angiogenesis. Thus, we determined the MVD in these xenografts. As shown in Figure 3, in the remaining non-necrotic area of the xenografts (randomly selected fields, not necessarily bordering on the margins of necrosis), there is ample vascularity in the vehicle-treated tumors. This vascularity is significantly decreased in the m-NO-ASA-treated and more so in the p-NO-ASA-treated xenografts. Treatment with m-NO-ASA decreased MVD by 34% compared with vehicle (11.7 ± 0.8 versus 7.8 ± 0.6). Additionally, treatment with p-NO-ASA decreased MVD by 47% compared with vehicle (11.7 ± 0.8 versus 6.2 ± 0.7).
Fig. 3.
NO-ASA reduces MVD in HT-29 xenografts. Representative sections of tumors injected with (A) vehicle, (B) m-NO-ASA or (C) p-NO-ASA that show endothelial cell staining using the anti-PECAM-1 antibody. There were 12 mice per group. The number of microvessels within a given area was determined as in Materials and Methods and their mean ± SEM values are depicted in the graph below. *Statistically significant difference compared with the vehicle control group. Original magnification ×200. The bar represents 100 μm.
All data were approximately normal. There was a significant overall group effect [F(2,33) = 17.1, P < 0.0001] when comparing MVD levels among the three groups. Post hoc tests revealed both m-NO-ASA treatment [t(33) = −4.1, Dunnett-adjusted P = 0.0006] and p-NO-ASA treatment [t(33) = −5.7, Dunnett-adjusted P < 0.0001] exhibited significantly lower MVD levels relative to vehicle control.
NO-ASA decreases the expression of VGEF in xenografts
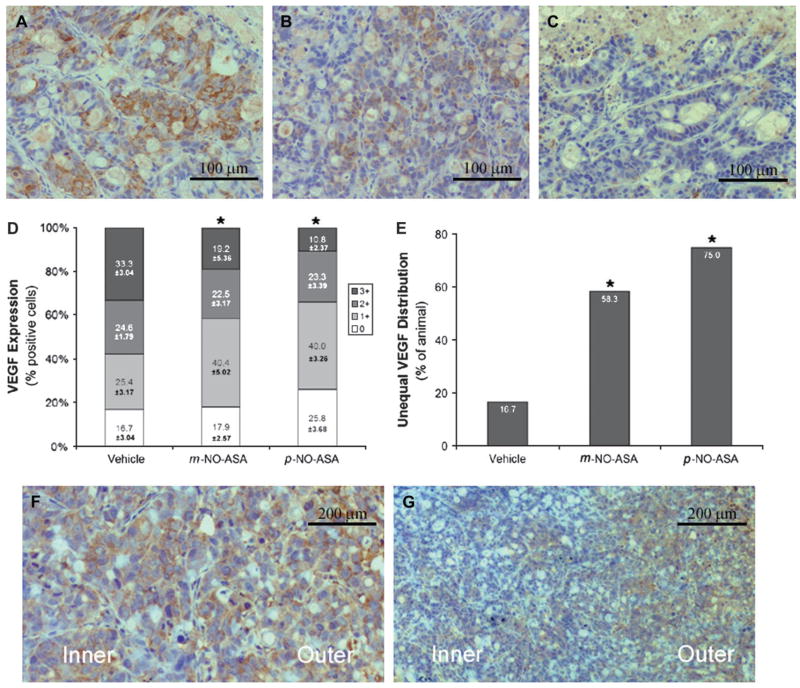
Given these changes in MVD, we examined by immunohistochemistry the expression of VEGF, which stimulates the growth of new vessels. To determine the expression of VEGF in these xenografts, we scored them based on the intensity of VEGF staining by immunohistochemistry. As shown in Figure 4A–D, there is a progressive decrease in the intensity of expression of VEGF from vehicle-treated to m- and more in p-NO-ASA-treated xenografts. For example, the percentage of cells that stained highly positive (3+) for VEGF was greater in vehicle-treated xenografts (33.3 ± 2.34) compared with m- and p-NO-ASA-treated xenografts (19.2 ± 5.36, P < 0.05 and 10.8 ± 2.37, P < 0.01, respectively). Conversely, those cells that stained weakly positive (1+) for VEGF were greater in m- and p-NO-ASA-treated xenografts (40.4 ± 5.02, P < 0.05 and 40.0 ± 3.26, P < 0.01, respectively) than in vehicle-treated xenografts (25.4 ± 3.17). The differences between the three groups are not significant for the other two levels of VEGF expression (0 and 2+). These findings document a significant reduction in the expression of VEGF in response to the two isomers of NO-ASA, with the p- being more potent than the m-.
Fig. 4.
The effect of NO-ASA on VEGF expression in HT-29 xenografts. VEGF expression: representative sections of tumors injected with vehicle (A), m-NO-ASA (B) or p-NO-ASA (C) that were stained for VEGF expression. (D) The percentage of tumors showing each level of VEGF staining intensity. Unequal VEGF distribution pattern: representative sections of tumors injected with vehicle (F) or m-NO-ASA (G) that depict the equal (F) and unequal (G) VEGF distribution patterns between the inner and outer regions of the non-necrotic tumor tissue. The percentage of animals showing the unequal distribution pattern is shown in (E). *Statistically significant difference compared with the vehicle control group. Original magnification ×400 for A, B and C and ×200 for F and G. *Statistically significant difference compared with the vehicle control group. The bar represents 100 μm (A, B and C) or 200 μm (F and G).
NO-ASA alters the spatial distribution of VGEF expression in xenografts
We noticed that VEGF expression in the area between necrosis and the outer perimeter of the tumor followed one of two patterns (Figure 4E–G). In the first pattern, there was roughly equal expression of VEGF in these two areas. In the second pattern, the expression of VEGF was markedly diminished in the inner area compared with the outer area. Of note, the necrotic area per se had no VEGF expression.
When the samples were scored based on these two patterns of VEGF expression, there was a dramatic difference between vehicle- and NO-ASA-treated xenografts (Figure 4). With regards to the second pattern (unequal VEGF distribution), only 16.7% of the vehicle-treated xenografts displayed this pattern, compared with 58.3% of the xenografts treated with m-NO-ASA and 75% of those treated with p-NO-ASA. These differences are statistically significant (both P < 0.01). Thus, treatment with NO-ASA reduced dramatically the expression of VEGF adjacent to the necrotic area as opposed to the more distal areas.
Discussion
In our continuing attempt to assess the mechanism of action of NO-ASA as a chemopreventive agent, we have investigated its link to angiogenesis. Our findings demonstrate that NO-ASA, when applied intratumorally led to tissue necrosis, which was accompanied or preceded by inhibition of angiogenesis through a mechanism that blocked VEGF expression.
There are two major changes that we observed in these tumor xenografts. First, NO-ASA induced tissue necrosis around the site of its injection. Although tissue necrosis from the injection of a volume of liquid per se into a tissue mass (e.g. pressure necrosis) is a possibility, nevertheless this is virtually excluded as the area of necrosis is essentially identical in vehicle-injected and non-injected xenotransplants. The two positional isomers of NO-ASA increased the area of necrosis inside the tumors and this effect was statistically highly significant compared with controls. Moreover, the necrotic effect of the two isomers of NO-ASA displayed the expected difference between them, with the p- isomer being more potent than the m-. That there were no differences in the size of the xenografts between the four groups may indicate that the local effect is less pronounced than the systemic effect of NO-ASA; it has been reported that NO-ASA given systemically reduces the size of xenografts (18). A possible explanation of this discrepancy may be found in the limited bioavailability of the locally injected drug (the entire volume was discharged at the center of the tumor). This idea is supported by the finding that the inner area of the non-necrotic rim of tumor tissue showed greater suppression of VEGF expression than its outer area.
The second change that was observed was a clear-cut effect of NO-ASA on angiogenesis. The MVD was reduced by NO-ASA becoming almost half of control in response to p-NO-ASA. The differential effect of the two isomers was again observed, testifying in a way to the specificity of the observed changes. Underlying the changes in MVD were changes in VEGF expression. There are highly significant reductions in the expression of VEGF in the NO-ASA-treated tumors, with the p- isomer being more potent than the m-. The spatial distribution of these changes is characteristic and entirely consistent with the notion that they were due to NO-ASA that was diffusing outward from the site of its injection in the tumors. Only a small fraction (16.7%) of the vehicle-treated tumors had diminished VEGF expression adjacent to the centrally located area of necrosis. In sharp contrast, 58.3 and 75% of the m- and p-NO-ASA-treated tumors, respectively, had their VEGF expression suppressed near the area of tumor necrosis.
The simplest explanation of these findings is that NO-ASA suppressed the expression of VEGF as it diffused out of its injection site, which then led to suppression of angiogenesis followed by tumor ischemic necrosis. This notion is consistent with current understanding of the effect of VEGF inhibition on tumor growth (13).
Our data cannot directly assess the contribution of the antiangiogenic effect of NO-ASA to its overall antitumor effect. An inhibitory effect of NO-ASA on VEGF expression could be central to NO-ASA’s effect on tumor vascular blood supply. Based on the role of angiogenesis in tumor formation and the mode of action of other anticancer agents, it is plausible that this mechanism explains, at least in part, the anticancer effect of NO-ASA. It is also reasonable to speculate that enhancing the antiangiogenic effect of NO-ASA by combining it with other agents may increase further its antitumor efficacy.
Acknowledgments
Funding
National Institutes of Health (2R01 CA92423).
Abbreviations
- MVD
microvessel density
- NO-ASA
NO-donating aspirin
- VEGF
vascular endothelial growth factor
Footnotes
Conflict of Interest Statement: None declared.
References
- 1.Yeh RK, et al. NO-donating nonsteroidal antiinflammatory drugs (NSAIDs) inhibit colon cancer cell growth more potently than traditional NSAIDs: a general pharmacological property? Biochem Pharmacol. 2004;67:2197–2205. doi: 10.1016/j.bcp.2004.02.027. [DOI] [PubMed] [Google Scholar]
- 2.Rigas B. The use of nitric oxide-donating nonsteroidal anti-inflammatory drugs in the chemoprevention of colorectal neoplasia. Curr Opin Gastroenterol. 2007;23:55–59. doi: 10.1097/MOG.0b013e32801145b0. [DOI] [PubMed] [Google Scholar]
- 3.Williams JL, et al. NO-donating aspirin inhibits intestinal carcinogenesis in Min (APC(Min/+)) mice. Biochem Biophys Res Commun. 2004;313:784–788. doi: 10.1016/j.bbrc.2003.12.015. [DOI] [PubMed] [Google Scholar]
- 4.Rao CV, et al. Nitric oxide-releasing aspirin and indomethacin are potent inhibitors against colon cancer in azoxymethane-treated rats: effects on molecular targets. Mol Cancer Ther. 2006;5:1530–1538. doi: 10.1158/1535-7163.MCT-06-0061. [DOI] [PubMed] [Google Scholar]
- 5.Ouyang N, et al. Nitric oxide-donating aspirin prevents pancreatic cancer in a hamster tumor model. Cancer Res. 2006;66:4503–4511. doi: 10.1158/0008-5472.CAN-05-3118. [DOI] [PubMed] [Google Scholar]
- 6.Kashfi K, et al. Positional isomerism markedly affects the growth inhibition of colon cancer cells by nitric oxide-donating aspirin in vitro and in vivo. J Pharmacol Exp Ther. 2005;312:978–988. doi: 10.1124/jpet.104.075994. [DOI] [PubMed] [Google Scholar]
- 7.Hulsman N, et al. Chemical insights in the concept of hybrid drugs: the antitumor effect of nitric oxide-donating aspirin involves a quinone methide but not nitric oxide nor aspirin. J Med Chem. 2007;50:2424–2431. doi: 10.1021/jm061371e. [DOI] [PubMed] [Google Scholar]
- 8.Kashfi K, et al. The mechanism of action of nitric oxide-donating aspirin. Biochem Biophys Res Commun. 2007;358:1096–1101. doi: 10.1016/j.bbrc.2007.05.038. [DOI] [PubMed] [Google Scholar]
- 9.Nath N, et al. Nitric oxide-donating aspirin inhibits beta-catenin/T cell factor (TCF) signaling in SW480 colon cancer cells by disrupting the nuclear beta-catenin-TCF association. Proc Natl Acad Sci USA. 2003;100:12584–12589. doi: 10.1073/pnas.2134840100. [DOI] [PMC free article] [PubMed] [Google Scholar]
- 10.Williams JL, et al. Growth inhibition of human colon cancer cells by nitric oxide (NO)-donating aspirin is associated with cyclooxygenase-2 induction and beta-catenin/T-cell factor signaling, nuclear factor-kappaB, and NO synthase 2 inhibition: implications for chemoprevention. Cancer Res. 2003;63:7613–7618. [PubMed] [Google Scholar]
- 11.Spiegel A, et al. NO-donating aspirin inhibits both the expression and catalytic activity of inducible nitric oxide synthase in HT-29 human colon cancer cells. Biochem Pharmacol. 2005;70:993–1000. doi: 10.1016/j.bcp.2005.06.027. [DOI] [PubMed] [Google Scholar]
- 12.Hundley TR, et al. Nitric oxide-donating aspirin inhibits colon cancer cell growth via mitogen-activated protein kinase activation. J Pharmacol Exp Ther. 2006;316:25–34. doi: 10.1124/jpet.105.091363. [DOI] [PubMed] [Google Scholar]
- 13.Folkman J. Angiogenesis. Annu Rev Med. 2006;57:1–18. doi: 10.1146/annurev.med.57.121304.131306. [DOI] [PubMed] [Google Scholar]
- 14.van Kempen LC, et al. Tumours can adapt to anti-angiogenic therapy depending on the stromal context: lessons from endothelial cell biology. Eur J Cell Biol. 2006;85:61–68. doi: 10.1016/j.ejcb.2005.10.003. [DOI] [PubMed] [Google Scholar]
- 15.Zhong H, et al. Antiangiogenesis drug design: multiple pathways targeting tumor vasculature. Curr Med Chem. 2006;13:849–862. doi: 10.2174/092986706776361085. [DOI] [PubMed] [Google Scholar]
- 16.Cardones AR, et al. VEGF inhibitors in cancer therapy. Curr Pharm Des. 2006;12:387–394. doi: 10.2174/138161206775201910. [DOI] [PubMed] [Google Scholar]
- 17.Dunnett C. A multiple comparisons procedure for comparing several treatments with a control. J Am Stat Assoc. 1955;50:1096–1121. [Google Scholar]
- 18.Tesei A, et al. Study of molecular mechanisms of pro-apoptotic activity of NCX 4040, a novel nitric oxide-releasing aspirin, in colon cancer cell lines. J Transl Med. 2007;5:52. doi: 10.1186/1479-5876-5-52. [DOI] [PMC free article] [PubMed] [Google Scholar]


