Abstract
The shock-induced collapse of a pre-existing nucleus near a solid surface in the focal region of a lithotripter is investigated. The entire flow field of the collapse of a single gas bubble subjected to a lithotripter pulse is simulated using a high-order accurate shock- and interface-capturing scheme, and the wall pressure is considered as an indication of potential damage. Results from the computations show the same qualitative behavior as that observed in experiments: a re-entrant jet forms in the direction of propagation of the pulse and penetrates the bubble during collapse, ultimately hitting the distal side and generating a water-hammer shock. As a result of the propagation of this wave, wall pressures on the order of 1 GPa may be achieved for bubbles collapsing close to the wall. The wall pressure decreases with initial stand-off distance and pulse width and increases with pulse amplitude. For the stand-off distances considered in the present work, the wall pressure due to bubble collapse is larger than that due to the incoming shockwave; the region over which this holds may extend to ten initial radii. The present results indicate that shock-induced collapse is a mechanism with high potential for damage in shockwave lithotripsy.
I. INTRODUCTION
In shockwave lithotripsy (SWL), the most common treatment for kidney stone disease,1 focused shockwaves are used to pulverize kidney stones. In a typical procedure, several hundreds to thousands of shockwaves are fired at rates of 0.5–2 Hz.2 In the focal region, a lithotripter pulse consists of a steep compressive shock front followed by a longer duration expansion tail with a tensile (negative) pressure. Since kidney stones can be immersed in urine and possibly in pooled blood, this tension can lead to the formation and growth of bubbles near the stone. Though the precise mechanisms of stone comminution are still debated,3 the two mechanisms thought to be most important are stress waves propagating within the stone4–6 and cavitation erosion due to bubble collapse along the stone surface.7,8 The mechanisms by which cavitation bubbles damage surfaces are complex.9,10 The bubble collapse is nonspherical, as illustrated by the formation of a re-entrant jet,11 and shockwaves are generated when the jet impacts the distal side, which in turn leads to a secondary loading of the stone. These processes are further complicated by the formation of bubble clusters or clouds on the surface of the solid.12 While previous numerical studies considered averaged models for bubble clouds produced in SWL,13 direct simulation of the detailed nonspherical near-surface bubble collapse under conditions relevant to SWL has not yet been reported.
In SWL, it is clear (at least in vitro) that nucleation of bubbles takes place at existing gas nuclei, which become more numerous as the treatment progresses.12 Due to the tensile portion of the lithotripter pulse, vapor bubbles grow and gather along the surface of the stone before collapsing. This (Rayleigh) collapse14 of vapor bubbles occurs in SWL at a time of O(100) μs after the passage of the pulse. However, this phenomenon is preceded by the collapse of pre-existing gas nuclei on a time scale of microseconds under the effect of the compressive portion of the shock. Though bubbles undergoing this so-called shock-induced collapse (SIC) are initially fewer than those undergoing Rayleigh collapse, the number of gas bubbles is roughly equal to that of cavitation bubbles after a sufficient number of shocks have passed; furthermore, sonoluminescence intensity measurements suggest that higher temperatures are achieved in SIC,15 thus highlighting the importance of this phenomenon in SWL and motivating the present work. In this paper, we provide the first systematic study of the bubble dynamics and damage potential associated with SIC in SWL. We show that the collapse of even tiny existing bubbles with a diameter of O(10) μm can lead to locally high pressures on the order of 1 GPa on the stone surface. We note that Rayleigh collapse of vapor bubbles has been shown to be important for cavitation erosion;9,10 however, existing numerical algorithms are unable to simulate satisfactory Rayleigh collapse16 so that comparisons between SIC and Rayleigh collapse are not currently possible.
Because of the tremendous challenges of resolving the very fast and small scales occurring in bubble collapse both experimentally and computationally, only a limited amount of results has been reported. Experimentally, Rayleigh collapse of a cavitation bubble9,10,17 has been studied more extensively than SIC.18–20 Computationally, shock-capturing methods solving the full compressible Euler equations are currently being developed and validated using two-dimensional interface problems so that both shockwaves and interfaces are handled appropriately.21–23 However, few systematic studies of bubble collapse using such methods have been published at this time.24–26
To simulate SIC, a high-order accurate shock- and interface-capturing scheme was developed27 and is used here to simulate the full flow field generated by the interaction of a lithotripter pulse with a gas bubble near a solid surface. This allows the visualization of the bubble response and the shockwaves generated during the process; in particular, the wall pressure is computed, thus giving a measure of potential damage. A detailed description of the methodology is presented in Sec. II, where the modeling of the lithotripter pulse and the problem setup are first discussed; then, the equations of motion and the numerical method are stated. The overall behavior of the bubble collapse is described in Sec. III. Then, the damage potential of SIC in SWL is examined by performing a parameter study in Sec. IV. Finally, the article ends with a summary of the findings and an outlook for future work.
II. METHODOLOGY
A. Problem setup
The focal region of a lithotripter is characterized by a cigar-shaped area where the wavefront is nearly planar. For simplicity, we assume that the stone is larger than this focal zone, which itself is much larger than the pre-existing spherical bubble. The lithotripter pulse is modeled as a compressive shock front of constant amplitude followed by a long expansion tail that includes a negative (tensile) pressure. The waveform is represented by the following analytical function:28
| (1) |
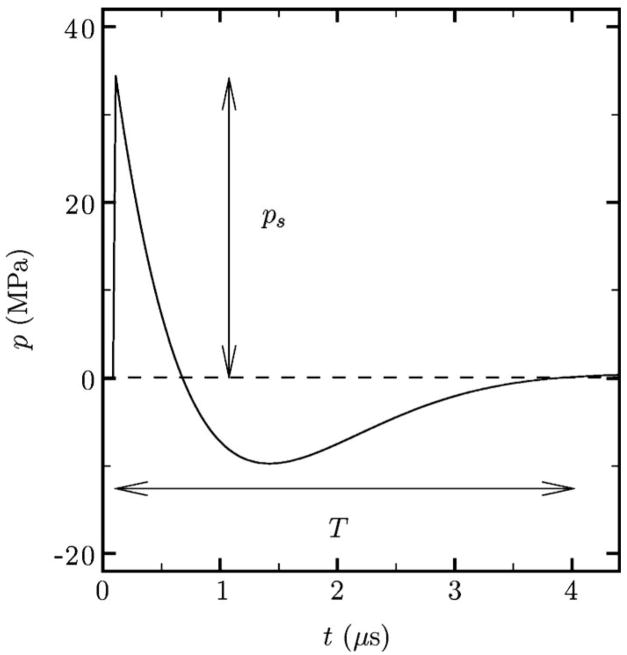
where po is the atmospheric pressure. The parameters are chosen to closely match the waveform in a Dornier HM3 lithotripter shown in Fig. 1, with nominal values of α =1.48×10⁸ s−1, ω =1.21×10⁸ s−1, and ps =35 MPa; other types of lithotripters generate at least qualitatively similar waveforms. The pulse amplitude, ps, and characteristic time, T, are defined in the figure; in particular, T is equal to the second zero of the function given by Eq. (1) (i.e., the time when the pressure becomes positive again after the first tensile region). The pulse width is then given by σ=sT, where s is the speed of propagation of the pulse and is approximately equal to the sound speed in water in the present cases. The values of α and ω lead to a nominal pulse width of σ =6.75 mm; in order to understand the dependence of the results on the pulse width, σ is varied in Sec. IV C. Typical peak positive pressures at the focus range from 9 to 114 MPa and negative (tensile) pressures as low as −10 MPa have been measured.29 We also vary the pulse amplitude in Sec. IV B to assess its impact on bubble collapse. The kidney stone is assumed to have infinite impedance so that all waves are completely reflected with no losses; this results in approximate pressure doubling at the stone surface, which can be understood by considering the reflection of a planar shockwave in water off a solid surface.16,30 In reality, kidney stones have a finite impedance approximately three to five times that of water.31,32
FIG. 1.
Pressure waveform of a lithotripter pulse at the focus.
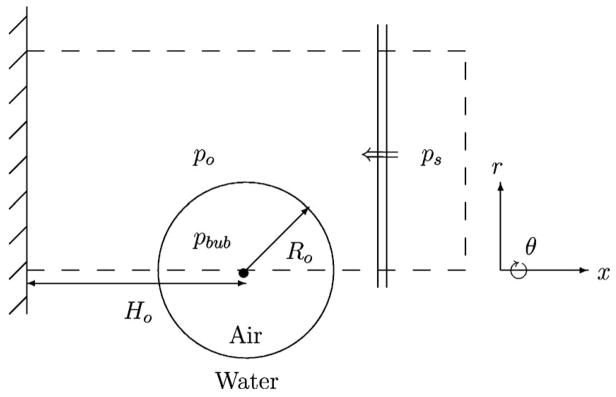
A slice through the center of the computational domain is shown in Fig. 2. The domain consists of a cylinder, along whose centerline an isolated spherical air bubble of radius, Ro, is initially in equilibrium with its surroundings. When present, the wall constitutes the left boundary of the domain. The initial stand-off distance is denoted Ho and the dependence of the wall pressure on this parameter is studied in Sec. IV A. As the simulation progresses, the bubble collapses nonspherically. We record the full flow field at different times and compute an average bubble radius, R(t), based on the bubble volume, and an average stand-off distance, H(t), estimated using the position of the bubble centroid. Appropriate boundary conditions are used at the edge of the cylinder to extend the domain to infinity, while reflecting conditions are employed to represent the wall. The shock described by Eq. (1) is initialized inside the domain and propagates toward the left, impinging the wall normally. The terms proximal and distal denote the near-shock and near-wall sides of the bubble, respectively (i.e., the right and left sides of the bubble in the present setup). The assumption of axisymmetry allows the reduction in the problem from three spatial dimensions to axisymmetric coordinates (cylindrical coordinates with azimuthal symmetry, i.e., there is no θ-dependence), thus greatly alleviating the computational expense; each computational cell consists of an annular region. In practice, the shock is not necessarily aligned with the stone normal so that the interaction between the shockwave and the bubble is a fully three-dimensional process; the present assumption of axisymmetry constitutes the geometrical configuration for which the bubble collapse is most energetic because of symmetry. A full three-dimensional simulation is required to compute the more general problem, in which case an additional parameter, the angle between the shock and the wall normal, should be introduced.
FIG. 2.
Schematic of the problem geometry.
B. Governing equations and numerical method
The main characteristics of single-bubble collapse in SWL are large nonspherical interface deformations and the generation and propagation of shockwaves. Since interactions between different types of waves and interfaces are the most important flow features, compressibility effects in gases and liquids are primordial. On the other hand, diffusive effects, surface tension, and mass transfer are not expected to play a significant role until the final stages of collapse, rebound, and subsequent growth. Based on these molecular effects, we consider compressible multicomponent flows,33 which constitute a subset of multiphase flows where the different fluid components, characterized by their respective (constant) ratio of specific heats, are immiscible. The bubble contains only noncondensible gas, which is assumed to behave ideally. We note that the present study focuses on bubbles solely containing air. When considering cavitation bubbles, mass transfer must be introduced in order to monitor the phase change between vapor and water, though the resulting gas-vapor mixture within the bubble is still expected to behave ideally. The liquid is water and obeys an appropriate equation of state described below. The resulting inviscid and adiabatic flows are governed by the Euler equations, written here in cylindrical coordinates with azimuthal symmetry:
| (2) |
where ρ is the density, u is the axial velocity, v is the radial velocity, p is the pressure, and E is the total energy. The axial direction is represented by the x-coordinate, the radial direction is represented by the r-coordinate, and time is t; subscripts in Eq. (2) denote differentiation with respect to that variable. These equations are closed by specifying an appropriate equation of state in each fluid. We model water using the stiffened equation of state,34
| (3) |
where γ and B are empirical constants with values of 6.59 and 4049 atm,35 respectively. For the air inside the bubble, we can take B =0 and γ =1.4 to obtain the perfect gas relation from Eq. (3). In what follows, the ambient density and sound speed of the water, ρL and cL (along with the initial bubble radius, Ro), are used to nondimensionalize all quantities appearing in the model and results. When quoting dimensional results, we shall use ρL =998 kg/m3 and cL =1647 m/s. This value of cL is approximately 10% larger than usual and is based on the derivation of the stiffened equation of state.35 However, the impact of this discrepancy on the results is negligible since the shocks considered in the present work are weak (i.e., Ms =1+ ε, where 0≪ ε ≪1). Because the fluid components are assumed immiscible, interfaces are specified by a discontinuity in the fluid composition characterized by γ and B. Since mass transfer is neglected, interfaces between two fluid components are advected by the flow. The nominal location of the interface between liquid and gas is taken as the value of γint=1.42.
In order to accurately solve the governing equations, we have previously developed a numerical method with the following properties: high-order accuracy (good convergence in smooth regions and little dissipation at discontinuities), conservation (discrete conservation of mass, momentum, and energy), shock capturing (prevention of spurious oscillations at shockwaves), and interface capturing (prevention of spurious oscillations at interfaces). From a practical standpoint, it is also desirable that the scheme be computationally efficient and easy to implement. In order to achieve these goals, an existing quasiconservative interface-capturing formulation36 was extended27 by implementing a high-order accurate finite volume weighted essentially non-oscillatory (WENO) 37 reconstruction of the average primitive variables and modifying the Harten-Lax-van Leer solver with contact restoration (HLLC) 38 solver to solve appropriate advection equations. This method is implemented here in cylindrical coordinates with azimuthal symmetry on a stretched grid.16
C. Nondimensional parameters
Dimensional analysis can be used to minimize the number of (independent) parameters governing the physics of SIC. From the equations of motion and the problem description, the following three nondimensional groups can be formed: a nondimensional stand-off distance, Ho/Ro, a non-dimensional pulse width, σ/Ro, and the ratio of the maximum (initial) shock pressure to the ambient pressure, ps/po. In the present work, the pressure ratio is varied in the range ps/po =34–710, which corresponds to lithotripters with peak pressures in the range 3.4–72 MPa and to shock Mach numbers in the range Ms =1.003–1.050. We note that the lower bound nominally corresponds to the (Rayleigh) collapse of a cavitation bubble since in that case ps/po → po/pv≈ 34. Based on the numerical results, it was determined that the effect of the wall on the emitted shockwave is minor for initial stand-off distances greater than five initial radii. Thus, the range Ho/Ro =1.05–4.5 is considered. Values less than unity are considered in experiments;10,17 however, because the bubble is not initially spherical in such a situation, the amount of gas at Ro is not the same so that it is not clear whether meaningful comparisons can be made. Finally, we have considered 67.5<σ/Ro <1350. If the lithotripter pulse is fixed (with σ=6.75 mm, as quoted in Sec. II A), this range corresponds to bubbles with 5 μm <Ro= 100 μm, which spans reasonable estimates for measured bubble nuclei in SWL.39 Conversely, if the bubble size is held fixed (say, with Ro =10 μm), then the range corresponds to lithotripter pulses with different expansion durations, with 0.675 mm <σ <13.5 mm.
III. GENERAL OBSERVATIONS OF SHOCK-INDUCED COLLAPSE
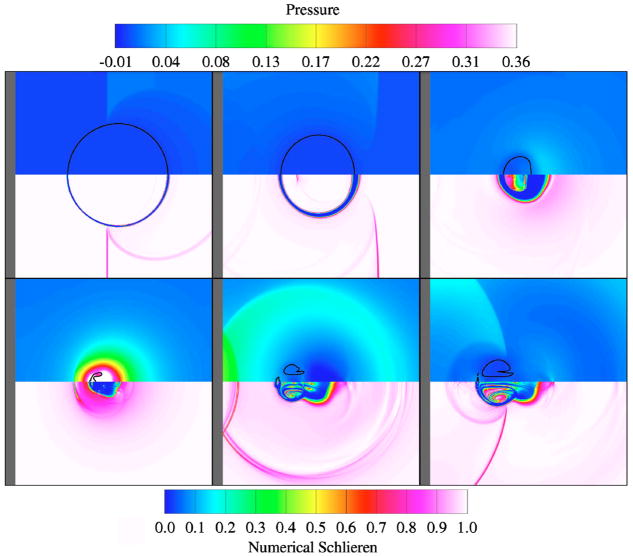
In order to illustrate the general flow features, SIC for a baseline case with ps/po =353, Ho/Ro =2.0, and σ/Ro =135 is considered. In physical parameters, this corresponds to a 35 MPa shock impacting a 50 μm radius bubble initially located 100 μm away from the solid surface. A qualitative description of the events is presented in Fig. 3. Slices across the computational domain through the centerline show numerical schlieren40 (top) and pressure contours (bottom). The numerical schlieren contours have the advantage of allowing both shockwaves and interfaces to be visualized; however, they tend to smear discontinuities. The location of the interface is highlighted in black in the pressure plot and the dark area on the left of each frame denotes the wall. When the left-moving shock hits the bubble, an expansion wave is reflected because of the high impedance mismatch, while a weak shock is transmitted (frame 1). The shock then diffracts off the bubble and later intersects along the axis behind the bubble. Thereafter, the lithotripter pulse reflects off the wall and effectively doubles the local pressure; the initial transmitted shock focuses, not exactly in the center of the bubble but at a location that can be deduced from ray tracing (frame 2). We note that another shock is transmitted within the bubble when the incoming pulse interacts with the bubble again after reflection off the wall. The bubble proceeds to collapse nonspherically, while complex wave interactions take place within the bubble (frame 3). The distal side flattens, starts to involute, and eventually takes the form of a re-entrant jet. At collapse, the jet has penetrated the bubble and impacts the distal side; this generates a water-hammer shockwave, which propagates spherically outward (frame 4). The strength of the shock is higher in the direction of the jet. The bubble then takes the shape of a vortex ring and convects toward the wall, while the water-hammer shockwave reflects off the wall back onto the bubble (frame 5). As the bubble expands again, the shock interacts with it and reflects back onto the wall as an expansion wave (frame 6).
FIG. 3.
(Color online) Pressure (top) and numerical schlieren (bottom) contours for SIC in SWL (ps/po =353, Ho/Ro =2.0, and σ/Ro =135) at tcL/Ro =5.12,9.77,11.9,12.8,14.0,15.3. This figure is in color in the online version.
A. Bubble dynamics
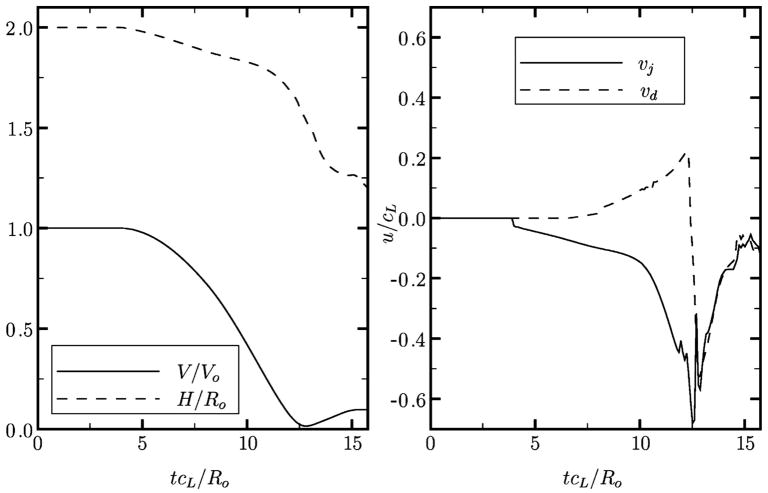
To better understand the bubble dynamics, the history of the bubble volume, stand-off distance, jet velocity, and velocity of the distal side is plotted in Fig. 4. After the passage of the shock (tcL/Ro ≈ 4), the bubble begins to collapse. In the initial stages, the collapse is slow, as observed in the early migration of the bubble toward the wall and in the gradual increase in jet velocity. The external shock reaches the distal bubble side at tcL/Ro ≈ 6, and induces it to contract. In the latter stages, high interfacial velocities are achieved; the bubble collapses to a very small size and accelerates toward the wall. The jet eventually impacts the distal side, causing a large deceleration of the interface; this occurs slightly before the bubble reaches its minimum volume. The shockwaves generated by the impact of the jet onto the distal side and by the achievement of the minimum volume are difficult to distinguish.20 After collapse, the bubble still migrates toward the wall.
FIG. 4.
History of the bubble volume and displacement (left) and velocity of the jet and of the distal side (right) for SIC in SWL (ps/po =353, Ho/Ro =2.0, and σ/Ro =135).
Upon the impact of the jet onto the distal side of the bubble, a water-hammer pressure is generated. For the impact of a liquid jet onto a liquid surface, the water-hammer equation simplifies to
| (4) |
where vj is the jet velocity (vj ≈ 1120 m/s) and vd is the velocity of the distal side (vd ≈ 364 m/s). The local sound speed and density at the moment of impact are 1330 m/s and 1400 kg/m3 so that the computed water-hammer pressure is 1.5 GPa. In the simulations, the local pressure at the jet is 1.8 GPa, giving reasonable agreement. This analysis illustrates that very high local velocities and pressures are achieved in the liquid during the process. Comparisons with experimental findings are provided for the jet velocity in Sec. IV C.
B. Wall pressure
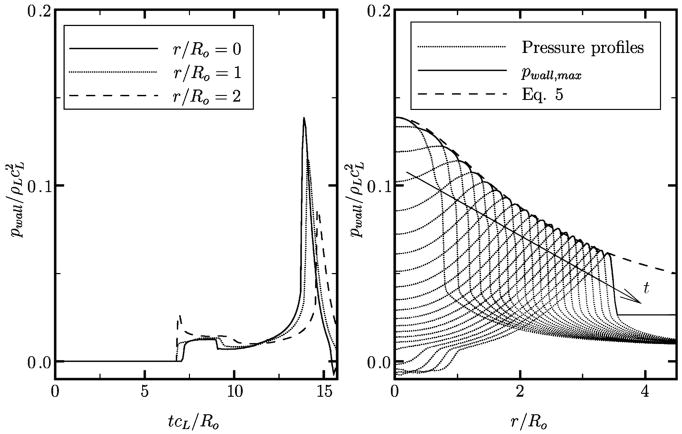
The wall pressure is an important quantity indicative of the damage potential of bubble collapse. Figure 5 shows the history of the wall pressure at different locations along the wall and pressure profiles along the wall at different times. First, the lithotripter pulse hits the wall at tcL/Ro ≈ 7. The pressure along the centerline (r/Ro =0) is slightly lower and delayed compared to other locations because, when the initial pulse impacts the bubble, a portion of the wave is reflected and the external shock has to diffract around the bubble. In other words, the bubble shields the wall by some amount that depends on Ho/Ro. The shock then reflects off the wall and impacts the bubble again. Because of the impedance mismatch, the amplitude inverts so that, upon the interaction with the resulting expansion wave, the wall pressure decreases at tcL/Ro ≈ 9. The large pressure rise then observed is caused by the water-hammer shock generated upon bubble collapse; hence, the maximum pressure due to bubble collapse (approximately 380 MPa) is much larger than that due to the pulse in the present case; this is further discussed in Sec. IV A. Later in the wall pressure history, negative pressures (tension) are achieved due to the reflection of the water-hammer shock onto the bubble and the subsequent inversion in the amplitude.
FIG. 5.
History of the wall pressure (left) and pressure profiles along the wall (right) for SIC in SWL (ps/po =353, Ho/Ro =2.0, and σ/Ro =135).
Because the water-hammer shock propagates spherically outward, the pressure is inversely proportional to the radial distance from the origin of the shock.41,42 Thus, using basic geometry, the wall pressure is given by
| (5) |
where y is the radial coordinate along the wall, Hc is the distance from the collapse location to the wall for a given Ho/Ro, and a and b are constants that can be determined if at least two pressure measurements are known. Equation (5) is the dashed curve in Fig. 5, which agrees very well with the computational results. This equation explains why the shock resulting from the collapse of a bubble far away (large Hc) looks essentially planar when it impacts the wall. Using Eq. (5), the radius of the area over which the wall pressure is larger than that of the pulse is given by
| (6) |
In this particular case, Lr/Ro ≈ 10, meaning that the area over which the pressure due to bubble collapse is larger than that of the lithotripter pulse is 100 times larger than the initial projected area of the bubble. Although bubbles undergoing SIC are initially small (Ro ≈10 μm) and collapse to an even smaller size, the area over which they act is much larger (Rarea ≈ 100 μm). Thus, only a few nuclei are needed to generate sizable surfaces of high pressure along the stone.
As illustrated by the present flow visualizations, the large wall pressure observed in Fig. 5 is caused by the shockwave emitted during bubble collapse, not by the impact of the jet onto the distal side. For the latter phenomenon to be important, the bubble must be located very close to the wall initially (i.e., Ho/Ro < 1), as is the case in prior experiments of Rayleigh collapse.10,17
IV. DAMAGE POTENTIAL OF SHOCK-INDUCED COLLAPSE
As a measure of the damage potential of SIC in SWL, the maximum wall pressure generated by bubble collapse is considered in the following parametric study. The dependence on the initial stand-off distance, pulse amplitude, and pulse width is studied.
A. Dependence on the initial stand-off distance
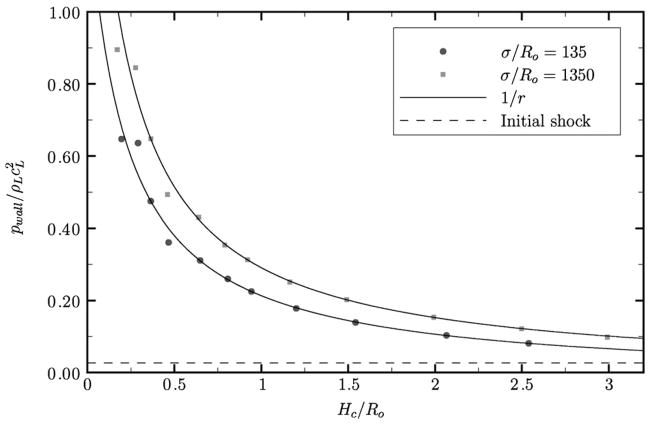
The distance at which bubbles are likely to cause damage is of great importance for practical purposes. The dependence of the maximum wall pressure along the centerline on the stand-off distance for ps/po =353 and σ/Ro =135,1350 is shown in Fig. 6 to illustrate the effect of small and large isolated bubbles in SWL (holding σ fixed). The pressure due to the pulse is also included (dashed line); it was compiled by running the simulation with no bubble. Because the bubble migrates toward the wall by some amount dependent on Ho/Ro, the stand-off distance at collapse is considered since this is when the shockwave is emitted. The same number of computational points is used across the bubble for each σ/Ro. Because the extent of the potential damage scales with the initial bubble radius, the pressure is averaged over the first ten cells in the case σ/Ro =1350 so that the area over which the pressure is recorded is the same in both cases. As expected, bubbles close to the wall generate a higher pressure (up to 2.4 GPa), which is inversely proportional to distance from the origin, as remarked in Sec. III B. The maximum pressure due to bubble collapse is thus much larger than that of the incoming pulse for the range of Ho/Ro considered in the present study; in the case of σ/Ro → ∞, the collapse of a bubble within Ho ≈ 8Ro generates a wall pressure higher than that of the lithotripter pulse. Hence, bubbles within this distance show the potential of SIC for surface erosion.
FIG. 6.
Wall pressure along the centerline as a function of the initial standoff distance for two different bubble sizes (ps/po =353).
In addition, the results show that the smaller bubble generates higher wall pressures, thus showing a higher potential for damage; however, the extent of the damage scales with the initial radius. This phenomenon is due to the fact that the high pressure of the compressive part of the pulse is exerted over a longer time for a bubble that is small compared to the pulse width. As a generalization, the results indicate that the collapse of a bubble that is large compared to the pulse width (e.g., cavitation bubble) is more gentle than that of a small bubble (e.g., gas nucleus). The dependence of the bubble dynamics on the pulse width is investigated in Sec. IV C. Experiments of SIC (Ref. 43) have measured wall pressures up to approximately 11 MPa for SIC, though lower amplitude shockwaves were used.
B. Dependence on the pulse amplitude
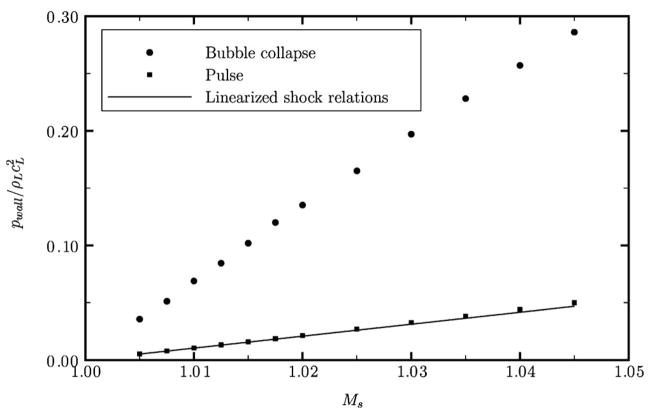
The dependence of the wall pressure on the shock amplitude and initial stand-off distance is useful when considering shock propagation through a bubble cloud near a solid surface. Figure 7 shows the dependence of the maximum wall pressure along the centerline on the Mach number of the pulse, Ms, for SIC with Ho/Ro =2.0 and σ/Ro =135. The Mach number is related to the pressure ratio across the shock.16 The wall pressure due to bubble collapse increases linearly with increasing shock amplitude, with a slope steeper than that of the wall pressure due to the pulse. The measurements of the wall pressure due to the pulse match the linearized shock relations
FIG. 7.
Wall pressure due to the bubble collapse and to the pulse as a function of the amplitude of the shockwave for Ho/Ro =2.0 and σ/Ro =135.
| (7) |
where the factor of 2 accounts for pressure doubling and Ms =1+ ε, with 0 <ε≪1.
In bubble clouds, the damage due to the bubbles closest to the surface could be assessed by combining the present analysis with a model for shock propagation through bubbly mixtures.44,45 As the shock propagates through the cloud, it becomes attenuated, such that the bubbles nearest to the wall only feel a fraction of the original shock amplitude. Thus, if the initial stand-off distance and the shock amplitude at that location in the cloud are known, the results of this section can be used to predict the potential damage due to the SIC of a single bubble, which can then be averaged over a given area to represent the damage due to multiple bubbles. It should be noted that the present analysis applied to gas bubbles, while clouds consist of vapor bubbles in most applications.
C. Dependence on the pulse width
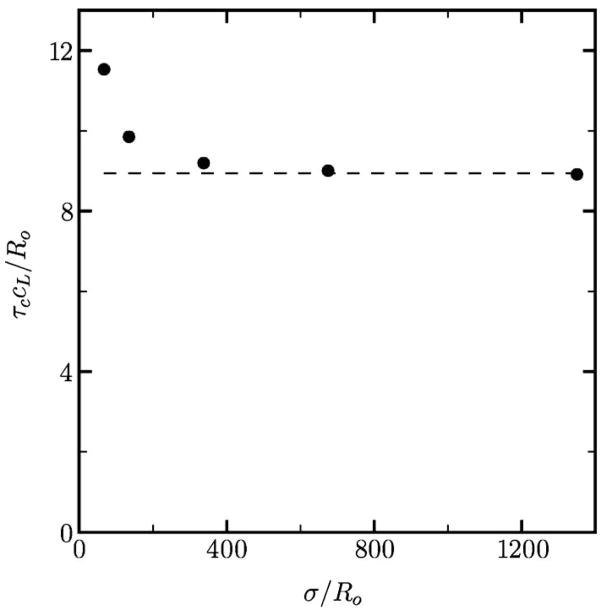
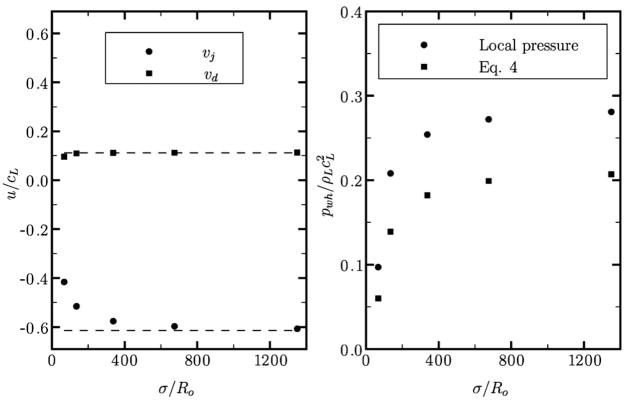
The finite width of the lithotripter pulse has important consequences. Changing this quantity leads to two possible interpretations: a variable pulse width (which is a property of the lithotripter) and a variable initial bubble radius (which depends on the bubble population), as discussed in Sec. IV A. In order to understand the effect of the pulse width in SWL, Fig. 8 shows the collapse time, τc, and Fig. 9 depicts the maximum interfacial velocity (jet and distal side) and the water-hammer pressure for free-field collapse with ps/po =353. The dashed line represents the limiting case of σ/Ro → ∞ (i.e., a stepwise increase in pressure, followed by no expansion). For the parameters considered in the present study, the collapse time occurs well before the arrival of the negative tail of the pulse (at tcL/Ro ≈ 23). Thus, the dynamics of collapse are only affected by the compressive portion of the pulse. Yet, the results show that the dynamics are sensitive to the pulse width. As the pulse width is increased, the behavior of the bubble tends to that resulting from the interaction with a shockwave that has infinite width; the data for σ/Ro =675 are already close to the asymptotic value.
FIG. 8.
Collapse time as a function of the pulse width for free-field SIC in SWL (ps/po =353).
FIG. 9.
Maximum velocity of the jet and of the distal side (left) and measured and computed water-hammer pressure (right) as a function of the pulse width for free-field SIC in SWL (ps/po =353).
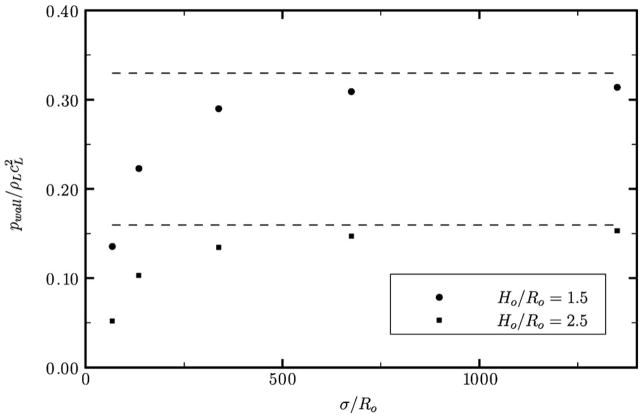
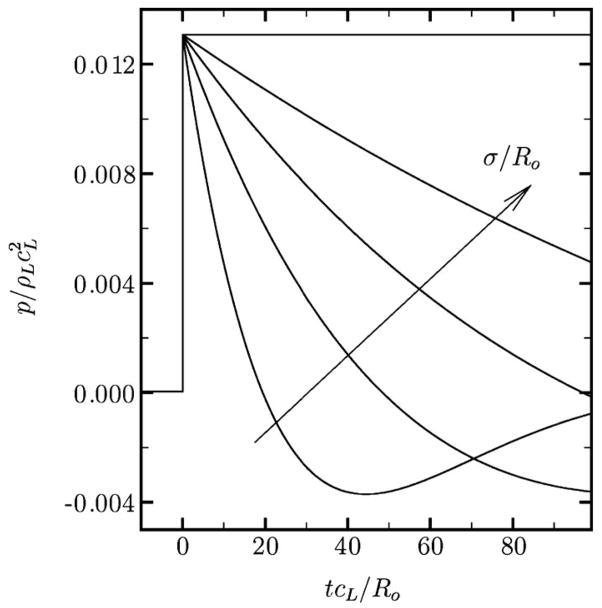
The behavior of the maximum wall pressure in SIC near a solid surface follows a similar trend, as seen in Fig. 10, though the asymptote is achieved for larger values of σ/Ro. This phenomenon may be understood by the fact that increasing the pulse width subjects the bubble to a high pressure for a longer time, as shown schematically in Fig. 11. An alternate view is to hold σ fixed so that the bubble radius is the variable, as discussed previously; similarly, a smaller bubble is exposed to the high pressure for a longer time.
FIG. 10.
Wall pressure along the centerline as a function of pulse width for different initial stand-off distances in SWL with ps/po =353.
FIG. 11.
Waveform for increasing σ/Ro.
In experiments of SIC of a gas bubble near an aluminum foil,19 a pressure ratio of ps/po ≈ 650 is used. The pulse width in this case is σ ≈ 10 mm and the range is σ/Ro =11.4–20.8, which corresponds to large bubbles. A trend similar to the present results is observed for the collapse time, which falls in the range τccL/Ro =6.51–9.36, as a function of the pulse width (or initial bubble radius). The collapse time decreases with increasing pulse width, eventually asymptoting to the value represented by a stepwise increase in pressure. Jet velocities of approximately 600–700 m/s are achieved in this range of σ/Ro; the present simulations yield a jet velocity of 660 m/s for ps/po =353 and σ/Ro =67.5 (the smallest value of σ/Ro considered here). Although the parameters are different, similar orders of magnitude and trends are achieved in the simulations. In free-field experiments with lower pulse amplitude18 (ps/po =100–200), jet velocities up to 150 m/s are attained for Ro =50 μm, while jet velocities of 360–700 m/s are achieved in the simulations. In these experiments, however, the rise time is much slower than in the simulations, and measured values constitute lower bounds limited by the resolution of the laboratory equipment.
V. CONCLUSIONS
We numerically simulated the shock-induced collapse (SIC) of a single air bubble in shockwave lithotripsy (SWL) using a high-order accurate quasiconservative shock- and interface-capturing scheme. The maximum wall pressure due to bubble collapse is considered as an indication of potential damage.
Flow visualizations allow a detailed examination of the bubble dynamics. A re-entrant jet forms during collapse and impacts the distal side, thereby generating a water-hammer shock. This wave propagates spherically outward and hits the neighboring wall; in the range of stand-off distances considered in the present work, this phenomenon (and not the impact of the jet onto the wall) leads to a high wall pressure. After collapse, the bubble takes the form of a vortex ring and convects toward the wall as it rebounds.
The findings show that wall pressures on the order of 1 GPa may be achieved in SIC for bubbles located close to the wall initially. This maximum pressure decreases with initial stand-off distance and pulse width (i.e., when the bubble is large compared to the pulse width) and increases with pulse amplitude. For the stand-off distances considered in the present work, the wall pressure due to bubble collapse is larger than that due to the incoming shockwave; this applies to bubbles within approximately eight initial radii from the wall. The region along the wall over which this holds may extend to ten initial radii, thus showing that, even though the size of a bubble is small, the collapse of just a few such bubbles would lead to a significant area of high pressure on the stone surface. Though shock-induced bubble collapse had not yet been systematically investigated in the context of SWL, the present results indicate that this phenomenon has a high potential for damage.
Because the development of numerical methods capable of simulating shockwaves and interfaces is still in their infancy, only a limited range of the physics is included. An implementation of surface tension, dissipative effects, and mass transfer especially would allow a better representation of the phenomenon. Then, the Rayleigh (and shock-induced) collapse of cavitation (i.e., vapor) bubbles could be simulated. An extension of the method to three dimensions would further allow the computation of more complex geometries. Finally, by coupling the present method to a solid mechanics simulation, the wave propagation within the solid and the actual damage caused by bubble collapse could be predicted. This application is not only relevant to SWL but to the cavitation community as a whole.
Acknowledgments
The authors gratefully acknowledge helpful discussions with members of the PPG group (PI Andrew Evan), in particular, Dr. Michael Bailey, Dr. Robin Cleveland, Dr. Wayne Kreider, Dr. Yura Pishchalnikov, and Dr. Oleg Sapozhnikov. This work was supported by NIH Grant No. PO1 DK043881 and by ONR Grant No. N00014-06-1-0730.
References
- 1.IH, “Kidney stones in adults,” on the WWW, URL: http://kidney.niddk.nih.gov (Last viewed April 21, 2008).
- 2.Paterson RF, Lifshitz DA, Lingeman JE, Evan AP, Connors BA, Fineberg NS, Williams JC, McAteer JA. Stone fragmentation during shock wave lithotripsy is improved by slowing the shock wave rate: Studies with a new animal model. J Urol (Baltimore) 2002;168:2211–2215. doi: 10.1016/S0022-5347(05)64357-1. [DOI] [PubMed] [Google Scholar]
- 3.Eisenmenger W. The mechanisms of stone fragmentation in ESWL. Ultrasound Med Biol. 2001;27:683–693. doi: 10.1016/s0301-5629(01)00345-3. [DOI] [PubMed] [Google Scholar]
- 4.Cleveland RO, Sapozhnikov OA. Modeling elastic wave propagation in kidney stones with application to shock wave lithotripsy. J Acoust Soc Am. 2005;118:2667–2676. doi: 10.1121/1.2032187. [DOI] [PubMed] [Google Scholar]
- 5.Lockandwalla M, Sturtevant B. Fracture mechanics model of stone comminution in ESWL and implications for tissue damage. Phys Med Biol. 2000;45:1923–1940. doi: 10.1088/0031-9155/45/7/316. [DOI] [PubMed] [Google Scholar]
- 6.Zhu S, Preminger FG, Zhong P. The role of stress waves and cavitation in stone comminution in shock wave lithotripsy. Ultrasound Med Biol. 2002;28:661–671. doi: 10.1016/s0301-5629(02)00506-9. [DOI] [PubMed] [Google Scholar]
- 7.Coleman AJ, Saunders JE, Crum LA, Dyson M. Acoustic cavitation generated by an extracorporeal shockwave lithotripter. Ultrasound Med Biol. 1987;13:69–76. doi: 10.1016/0301-5629(87)90076-7. [DOI] [PubMed] [Google Scholar]
- 8.Crum LA. Cavitation microjets as a contributory mechanism for renal calculi disintegration in ESWL. J Urol (Baltimore) 1988;140:1587–1590. doi: 10.1016/s0022-5347(17)42132-x. [DOI] [PubMed] [Google Scholar]
- 9.Philipp A, Lauterborn W. Cavitation erosion by single laser-produced bubbles. J Fluid Mech. 1998;361:75–116. [Google Scholar]
- 10.Tomita Y, Shima A. Mechanisms of impulsive pressure generation and damage pit formation by bubble collapse. J Fluid Mech. 1986;169:535–564. [Google Scholar]
- 11.Plesset MS, Chapman RB. Collapse of an initially spherical vapour cavity in the neighbourhood of a solid boundary. J Fluid Mech. 1971;47:283–290. [Google Scholar]
- 12.Pishchalnikov YA, Sapozhnikov OA, Bailey MR, Williams JC, Cleveland RO, Colonius T, Crum LA, Evan AP, McAteer JA. Cavitation bubble cluster activity in the breakage of kidney stones by lithotripter shockwaves. J Endourol. 2003;17:435–446. doi: 10.1089/089277903769013568. [DOI] [PMC free article] [PubMed] [Google Scholar]
- 13.Tanguay M. Ph D thesis. California Institute of Technology; Pasadena CA: 2004. Computation of bubbly cavitating flow in shock wave lithotripsy. [Google Scholar]
- 14.Rayleigh L. On the pressure developed in a liquid during the collapse of a spherical cavity. Philos Mag. 1917;34:94–98. [Google Scholar]
- 15.Matula TJ, Hilmo PR, Bailey MR, Crum LA. In vitro sonoluminescence and sonochemistry studies with an electrohydraulic shockwave lithotripter. Ultrasound Med Biol. 2002;28:1199–1207. doi: 10.1016/s0301-5629(02)00568-9. [DOI] [PubMed] [Google Scholar]
- 16.Johnsen E. Ph D thesis. California Institute of Technology; Pasadena, CA: 2007. Numerical simulation of non-spherical bubble collapse. [Google Scholar]
- 17.Vogel A, Lauterborn W, Timm R. Optical and acoustic investigations of the dynamics of laser-produced cavitation bubbles near a solid boundary. J Fluid Mech. 1989;206:299–338. [Google Scholar]
- 18.Ohl CD, Ikink R. Shock-wave-induced jetting of micron-size bubbles. Phys Rev Lett. 2003;90:214502. doi: 10.1103/PhysRevLett.90.214502. [DOI] [PubMed] [Google Scholar]
- 19.Philipp A, Delius M, Scheffczyk C, Vogel A, Lauterborn W. Interaction of lithotripter-generated shock waves with air bubbles. J Acoust Soc Am. 1993;93:2496–2509. [Google Scholar]
- 20.Sankin GN, Simmons WN, Zhu SL, Zhong P. Shock wave interaction with laser-generated single bubbles. Phys Rev Lett. 2005;95:034501. doi: 10.1103/PhysRevLett.95.034501. [DOI] [PMC free article] [PubMed] [Google Scholar]
- 21.Chang CH, Liou MS. A robust and accurate approach to computing compressible multiphase flow: Stratified flow model and AUSM+-up scheme. J Comput Phys. 2007;225:840–873. [Google Scholar]
- 22.Hu XY, Khoo BC, Adams NA, Huang FL. A conservative interface method for compressible flows. J Comput Phys. 2006;219:553–578. [Google Scholar]
- 23.Nourgaliev RR, Dinh TN, Theofanous TG. Adaptive characteristics-based matching for compressible multifluid dynamics. J Comput Phys. 2006;213:500–529. [Google Scholar]
- 24.Hu XY, Adams NA. Shock-induced collapse of bubbles in liquid. Proceeding of the 26th International Symposium on Shock Waves; Goettingen, Germany. 2007. [Google Scholar]
- 25.Jamaluddin AR. PhD thesis. University of Southampton; Southampton, UK: 2005. Free-Lagrange simulations of shock-bubble interaction in extracorporeal shock wave lithotripsy. [Google Scholar]
- 26.Nagrath S, Jansen K, Lahey RT, Jr, Akhatov I. Hydrodynamics simulation of air bubble implosion using a level set approach. J Comput Phys. 2006;215:98–132. [Google Scholar]
- 27.Johnsen E, Colonius T. Implementation of WENO schemes for compressible multicomponent flow problems. J Comput Phys. 2006;219:715–732. [Google Scholar]
- 28.Church CC. A theoretical study of cavitation generated by an extracorporeal shock wave lithotripter. J Acoust Soc Am. 1989;86:215–227. doi: 10.1121/1.398328. [DOI] [PubMed] [Google Scholar]
- 29.Coleman AJ, Saunders JE. A survey of the acoustic output of commercial extracorporeal shock wave lithotripters. Ultrasound Med Biol. 1989;15:213–227. doi: 10.1016/0301-5629(89)90066-5. [DOI] [PubMed] [Google Scholar]
- 30.Thompson PA. Compressible-Fluid Dynamics. McGraw-Hill; New York: 1972. [Google Scholar]
- 31.Cleveland RO, Bailey MR, Fineberg N, Hartenbaum B, Lokhandwalla M, McAteer JA, Sturtevant B. Design and characterization of a research electrohydraulic lithotripter patterned after the Dornier HM3. Rev Sci Instrum. 2000;71:2514–2525. [Google Scholar]
- 32.Zhong P, Chuong CJ, Preminger GM. Propagation of shock waves in elastic solids caused by cavitation microjet impact. II: Application in extracorporeal shock wave lithotripsy. J Acoust Soc Am. 1993;94:29–36. doi: 10.1121/1.407088. [DOI] [PubMed] [Google Scholar]
- 33.Shyue KM. An efficient shock-capturing algorithm for compressible multicomponent problems. J Comput Phys. 1998;142:208–242. [Google Scholar]
- 34.Harlow F, Amsden A. LANL Monograph Technical Report No. LA-4700. Los Alamos National Laboratory; Fluid dynamics. [Google Scholar]
- 35.Cocchi JP, Saurel R, Loraud JC. Treatment of interface problems with Godunov-type schemes. Shock Waves. 1996;5:347–357. [Google Scholar]
- 36.Abgrall R. How to prevent pressure oscillations in multicomponent flow calculations: A quasi conservative approach. J Comput Phys. 1996;125:150–160. [Google Scholar]
- 37.Jiang JS, Shu CW. Efficient implementation of WENO schemes. J Comput Phys. 1996;126:202–228. [Google Scholar]
- 38.Toro EF, Spruce M, Spears M. Restoration of the contact surface in the HLL-Riemann solver. Shock Waves. 1996;4:25–34. [Google Scholar]
- 39.Coleman AJ, Choi MJ, Saunders JE, Leighton TG. Acoustic emission and sonoluminescence due to cavitation at the beam focus of an electrohydraulic shock wave lithotripter. Ultrasound Med Biol. 1992;18:267–281. doi: 10.1016/0301-5629(92)90096-s. [DOI] [PubMed] [Google Scholar]
- 40.Quirk JJ, Karni S. On the dynamics of a shock-bubble interaction. J Fluid Mech. 1996;318:129–163. [Google Scholar]
- 41.Fujikawa S, Akamatsu T. Effects of the non-equilibrium condensation of vapour on the pressure wave produced by the collapse of a bubble in a liquid. J Fluid Mech. 1980;97:481–512. [Google Scholar]
- 42.Hickling R, Plesset MS. Collapse and rebound of a spherical bubble in water. Phys Fluids. 1964;7:7–14. [Google Scholar]
- 43.Shima A, Tomita Y, Takahashi K. The collapse of a gas bubble near a solid wall by a shock wave and the induced impulsive pressure. Proc Inst Mech Eng. 1984;198C:81–86. [Google Scholar]
- 44.Kameda M, Matsumoto Y. Shock waves in a liquid containing small gas bubbles. Phys Fluids. 1996;8:322–335. [Google Scholar]
- 45.Kameda M, Shimaura N, Higashino F, Matsumoto Y. Shock waves in a uniform bubbly flow. Phys Fluids. 1998;10:2661–2668. [Google Scholar]


