

Abstract
Objectives
Most tobacco policy studies neither examine the impact of smoking bans and taxes on individual behavior over time nor consider their interactive effects, and often overlook city-level contexts. We examine the mutual effects of these policies on smoking among a longitudinal cohort of young adults.
Methods
Combining a repository of U.S. tobacco policies with the nationally-representative geocoded National Longitudinal Survey of Youth 1997 from ages 19–31 and Census data, we use multilevel logistic regression to examine the impact of tobacco policies on any current and daily pack smoking.
Results
For current smoking, we find significant effects for comprehensive smoking bans, but not excise taxes. We also find an interaction effect, with bans being most effective in locales with no/low taxes. For daily pack smoking, we find significant effects for taxes, but limited support for bans.
Conclusions
Social smoking among young adults is primarily inhibited by smoking bans, but excise taxes only deter such smoking in the absence of a ban. Heavy smokers are primarily deterred by taxes. While both policies impact young adult smoking behaviors, their dual presence does not intensify each policy’s efficacy.
Keywords: young adult smoking, smoking bans, excise taxes
The denormalization of tobacco use in Western nations has led to declines in both smoking and its public acceptability.1 Even with overall reductions in smoking, tobacco use remains the leading cause of preventable illness and death in the United States,2 making assessment of the efficacy of particular policies on actual smoking behavior an imperative. Tobacco control policies have been described as intensifying the process of denormalization of smoking among young people.3 The focus on young people is much deserved, as those who begin smoking at younger ages are at higher risk for smoking, particularly heavy smoking, as adults.4–5 The identification of policies that affect smoking behavior among young people can have long-term implications for public health as those individuals age into later life.
Estimates suggest that tobacco control policies have likely impacted tobacco consumption in the aggregate.6 A wide array of research has suggested that excise taxes and clean air policies are efficacious tobacco control policy tools, but these studies have come with several limitations that prohibit linking policy with actual individual-level behavior. For clean air policies, studies have inferred the effects of such prohibitions through cohort effects,7 relied on cross-sectional data,8–10 have not considered city-level policy,9–13 or used data within a single locality.14–15 Studies have also found robust effects of excise taxes on tobacco use.10,12–13,16–29 We note, however, that most studies of excise taxes utilized either aggregate time-series or repeated cross-sectional data, and often at the state or national level. Thus, for both bans and taxes, the literature has yet to link policy contexts at the local level to a longitudinal dataset of the same individuals over time as well as account for potential interactive effects of these policies. Even studies using the same datasets utilized herein have not considered the interaction between smoking bans and excise taxes.12
The local level is critically important, yet often overlooked in studies of both clean air policies and excise taxes. Cities led the way in enacting smoking bans in the U.S, such that the diffusion of clean air regulations began at the local level and spread vertically up to the state in an unusual example of “bottom-up federalism.”30 Chahine and colleagues suggested that, “contextual covariates play a larger role more locally, for example at the level of towns or neighborhoods. This may especially be the case for indoor smoking restrictions, which are highly variable within states.”9:757 They later suggest that future research should consider contextual variables at the local level in order to “fully characterize social determinants of smoking variability across populations and places.”9:758 Furthermore, although prohibited in some states, cities in several states may levy taxes on tobacco products in addition to those imposed by the state, creating similar variability on the issue of taxation. Thus, without accounting for the city-level, the policies to which an individual is subjected may be mischaracterized.
Our study overcomes the limitations of past studies by, first, combining a repository of all tobacco ordinances in the U.S. with a nationally representative annual survey of a single cohort of youth, allowing us to directly link a multilevel policy context to individual-level behavior over time in a manner not possible through aggregate or repeated cross-sectional data. Second, we consider the critical but underexplored policy context of the city-level. Third, no studies consider the independent and interactive effects of taxes and bans simultaneously. This is important as interaction analyses may lead to the identification of potential synergistic effects of tobacco policies. Thus, we utilize multilevel statistical modeling to identify the impact of these two important tobacco control policies on smoking behaviors over time in a nationally-representative sample of U.S. youth.
Methods
Individual-level data source
The individual-level data come from the National Longitudinal Survey of Youth 1997 (NLSY97). The NLSY97 has a large nationally representative, geocoded sample (N=8,984) designed to track the transition of youth into adulthood, with an oversample of Black and Latino youth. Adolescents from ages 12 to 16 were randomly sampled in 1997 and have been surveyed annually. The retention rate was nearly 83% in 2011. The restricted-access, geocoded NLSY97 identifies the respondents’ core-based statistical area (CBSA; i.e. metropolitan or micropolitan area), county, and state. We analyzed a subset of respondents whose city of residence could be identified by combining CBSA and county information with a variable assessing whether the respondent lived in a principal city within the metro area. Thus, our analyses focus on those living in the largest principal city of a CBSA, given the importance of the local level within a broader multilevel policy context. We also restrict analyses to waves 2004 and later (ages 19–31), as this was the first year in which CBSA data is available. This subset amounts to 19,668 observations among 4,341 individuals within 487 cities. We note that respondents only contribute in years in which they live in these cities; that is, respondents move in and out of the defined subset. Among the subset of individuals that contribute at least once, 33.6% live in such a city within a CBSA in all years with valid data, while 59.6% live in such a city in at least half of all years with valid data.
Dependent Variables
Each year, respondents who indicated they ever smoked an entire cigarette were asked the number of days they had smoked during the 30 days prior to the interview, and the number of cigarettes they had smoked each day on those 30 days. We created two outcome variables based upon these self-reports: one indicating any cigarette use during the past 30 days (pooled mean=34.5%) and a second variable for heavy use for those who reported smoking at least a pack per day (pooled mean=4.9%).
Individual-Level Covariates
In all models, we included a considerable battery of control variables at both the individual-level and the city-level. Given that age is central to patterns of substance use among young adults, we chose age as our time metric,31 including a quadratic term as this fit the data better than any other polynomial for age. Age in 1997 is also included in the models to control for cohort effects. We included several other individual-level risk factors for tobacco use in the models. Regarding family, we included time-varying indicator variables for whether the respondent lived with a parent, was married, and had children.32–34 We also accounted for recent moves via a dummy variable for a past year move across at least one county. For work-related risk factors, we included time-varying categorical variables for job status and job schedule.35 To assess peer-related influences, we included the percentage of peers who smoked in 1997, the only year it was measured.36 For academic performance, we included a dummy variable for receiving “mostly A’s” in high school.37 To control for the respondent’s mental health,38 the dataset included a five-item scale for depression asking whether the respondent in the last month has been a very nervous person, felt calm and peaceful, felt downhearted and blue, has been a happy person, and felt so down in the dumps that nothing could cheer you up, of which we use the 2004 baseline measure (alpha=0.77). To account for intergenerational health influences,39–44 we included parents’ self-reported health from 1997. We included several measures for socioeconomic status. We measured SES of household of origin by respondent-reported parents’ education level.45–47 The respondent’s SES was assessed by a time-varying measure that combined school enrollment status and degree attainment.32,37,47–48 Finally, we included controls for race/ethnicity,49–50 U.S. nativity, and gender.51 Appendix A, available as a supplement to the online version of this article, shows the descriptive statistics for all predictors and outcomes.
City-Level Data and Measures
City-level policy data come from the Americans for Nonsmokers’ Rights Foundation (ANRF) tobacco policy database. ANRF collected a complete national repository of tobacco-related ordinances and regulations within the country by date. The main predictor variables are (1) whether or not the respondent lived in a city with a comprehensive smoking ban, defined as policies mandating that workplaces, bars, and restaurants are 100% smoke-free with no indoor exceptions (pooled mean=35.8%); and, (2) the total excise taxes in that locale (pooled mean=$1.26; s.d.=1.05). From the ANRF repository, we created a location-year dataset at the state- and city-level for each data year using the effective date for the policies. Since the state policies are not independent of city policy (i.e., a state ban automatically implies a city ban, and therefore, the dummy variables must match), we recoded cities in states with bans to reflect this status. Similarly, total excise taxes reflect the per pack sum of state taxes, from the Center for Disease Control and Prevention, and city taxes, from ANRF. Thus, all policy information is statistically at the city-level, but accounts for both state and local policies. We used FIPS codes to link the geocoded NLSY97 to ANRF data at the city-level, allowing us to determine the tobacco policy context within which respondents were located. Figure 1 displays both smoking bans and tax amounts by year for our respondents. There is a rapid increase over the observation period in both measures. The percentage living in a city with a comprehensive ban increased from 14.9% to 58.7% from 2004 to 2011, while average taxes increased from $0.81 to $1.65.
Figure 1.
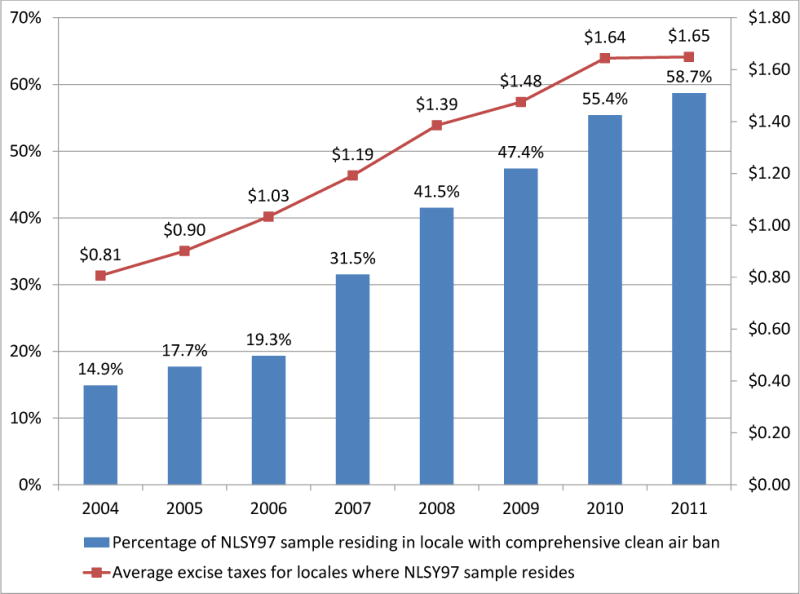
Average Excise Tax and Percentage Subject to Comprehensive Clean Air Ban for NLSY97 Respondents by Year
Several city-level measures from Census data are included as controls.52 Census data come from the 2000 and 2010 decennial censuses, with linear interpolation for in-between years and official estimates used for 2011. To include both population size and density, we created a categorical measure of population, while density is considered continuous (logged due to skewness). We included the percentage of female-headed households, as a useful proxy for other economic measures such as poverty and income.53 To measure ties to the community, we used the percentage of owner-occupied housing. Finally, we included the percentage of non-Hispanic whites and percentage of minors to account for community racial and age composition, respectively.
Methods
Given the various levels of analysis and a binary outcome, we used multilevel logistic regression models, also known as mixed effects models, to estimate the effects of clean air policies and excise taxes on young adult smoking. Although respondents can move across cities and thus the structure is more akin to a cross-classified model, the loss in precision of the estimation of the variance components from using the typical multilevel structure is slight relative to the great computational advantage.54:117 Among years spent within the subset located in the largest city within a CBSA, 15.3% were located among two cities, 2.3% among three, and 0.4% among four, such that the cross-classification of individual and city is of little consequence. Still, for robustness, we checked models for those who do and do not move and found similar results, and also included a fixed-effect in all models to adjust for the average effect of moving across geographic units since the last survey.
In our analysis using a typical hierarchical structure then, observations are nested within individuals, whom are nested within cities. Our three level model thus includes random intercepts for both the individual-level (Level 2) and the city-level (Level 3). These models adjust for the person- and city-level averages through a variance parameter that defines a normal distribution for each of those averages. At the lowest level of observation (Level 1), the predictors represent time-varying measures for both the city and the individual. At the individual-level, we have the time-invariant characteristics of the respondent. Because we do not include static city characteristics, the random intercept is the only term at Level 3. All models used the “xtmelogit” procedure in Stata 14.0, with the “margins” post-estimation command used to estimate predicted values. The study was approved by the university Institutional Review Board.
Results
Table 1 shows the coefficients from our models for our policy variables of interest (see Appendix B, available as a supplement to the online version of this article, for the full table with all control variables). According to Model 1 for the outcome of current smoking, even controlling for a robust set of covariates and excise taxes, there is a significant effect of comprehensive smoking bans. Those residing in cities with bans are 21.1% less likely to currently smoke. By comparison, there is no significant effect from taxes. Turning to Model 2, however, we find a significant interaction effect of the two tobacco policies, with the odds ratios for the interaction displayed in Figure 2. The main effect for excise taxes represents the slope for cities with no smoking ban. In such cities, an increase of $1 in taxes results in a 19.7% lower odds of individual-level current smoking ([1 – 0.803]*100% = −19.7%). The coefficient for bans now represents the effect when taxes are zero. In the absence of a tax then, the odds of currently smoking are 39.7% lower when a smoking ban is in effect. By the definition of an interaction effect, the sum of the excise tax main effect (−.220) and the interaction effect (.222) represents the slope for taxes in cities with a comprehensive smoking ban, which is virtually zero (−.220 + .222 = .002). In other words, taxes are of little consequence in cities with smoking bans, as reflected in the equal odds ratios for locations with comprehensive smoking bans in Figure 2. Figure 2, however, only displays the differences for a $1 increase in taxes. To understand the effect across the distribution of excise taxes, we display the predicted probability of current smoking by taxes and the presence of a ban in Figure 3. As reflected in the zero slope noted above, the tax effect in cities with bans is negligible. Relative to the line for cities without bans, the largest effect of bans occurs in cities with no to low excise taxes. The effect of the ban becomes smaller as taxes increase, such that the effect of a ban becomes negligible relative to a city without a ban when taxes are just over $2 per pack. We note that the shorter length of the line for locales with no bans reflects the fact that the maximum excise taxes in such places is $3.40, compared to $5.85 for locales with a ban.
Table 1.
Multilevel Logistic Regression of Smoking Outcomes
| Any Tobacco Use
|
Pack Daily
|
|||||||
|---|---|---|---|---|---|---|---|---|
| Model 1
|
Model 2
|
Model 3
|
Model 4
|
|||||
| Coefficient. (SE) | Odds Ratio | Coefficient (SE) | Odds Ratio | Coefficient (SE) | Odds Ratio | Coefficient (SE) | Odds Ratio | |
| Comprehensive smoking ban | −0.224* (0.104) | 0.799 | −0.506** (0.170) | 0.603 | −0.281 (0.173) | 0.755 | −0.573* (0.279) | 0.564 |
| Excise taxes ($) | −0.039 (0.059) | 0.962 | −0.220* (0.104) | 0.803 | −0.197* (0.100) | 0.821 | −0.357* (0.157) | 0.700 |
| Ban*Taxes | 0.222* (0.105) | 1.249 | 0.231 (0.173) | 1.260 | ||||
| Level 2 Variance | 3.833 (0.094) | 3.837 (0.094) | 3.299 (0.146) | 3.299 (0.146) | ||||
| Level 3 Variance | 0.669 (0.130) | 0.670 (0.131) | 0.275 (0.264) | 0.225 (0.324) | ||||
| Log Likelihood | −8095.674 | −8093.448 | −2599.158 | −2598.271 | ||||
p<.05;
p<.01;
p<.001 (two tailed).
Note: The displayed variance components account for the differences in averages on the outcomes across individuals (Level 2) and cities (Level 3).
Note: All models contain time-invariant controls for gender, race/ethnicity, US nativity, age cohort, parents’ education, parent self-reported health, baseline depression, high school grades, and peer smoking in 1997; time-varying respondent controls for age, living with a parent, education, recent move between counties, employment status, job schedule, marital status, and parent status; and time-varying city control for population, population density, owner-occupied housing, percentage minors, female-headed households, and percentage Non-Hispanic Whites. See Appendix B, available as a supplement to the online version of this article, for the full model with all controls displayed.
Figure 2. Odds Ratios for Interaction between City Comprehensive Smoking Ban and Tobacco Excise Tax.
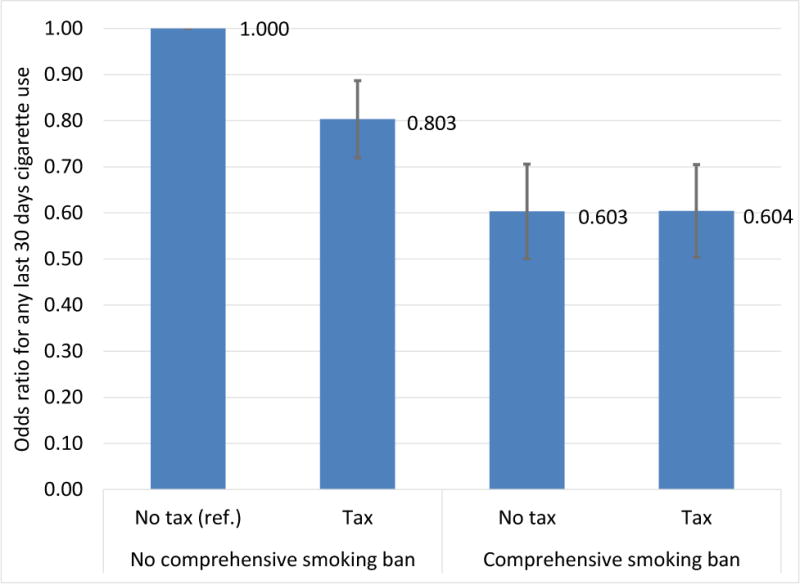
Note: Tax effect represents the difference for a $1 increase. The reference group is no tax, no comprehensive smoking ban. The error bars represent the 95% confidence interval for the odds ratio.
Figure 3. Interaction between City Comprehensive Smoking Ban and Tobacco Excise Tax.
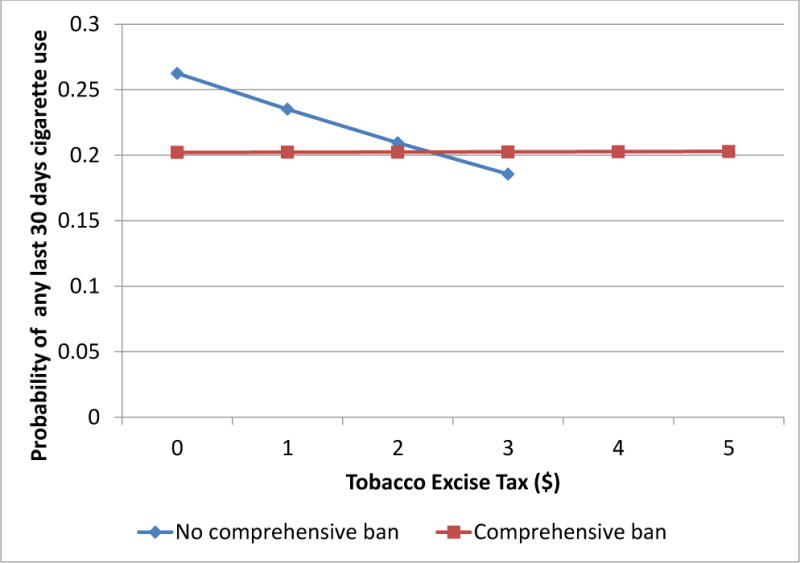
Note: The length of the line for locales with no comprehensive smoking bans is shorter to avoid extrapolation due to the lower maximum for taxes in such places ($3.40), compared to locales with bans ($5.85).
The results for smoking a pack daily are shown in Model 3. Without the interaction, we find the opposite effect in comparison with any current smoking: excise taxes significantly reduce the odds of daily pack smoking, while smoking bans do not. A $1 increase in taxes is associated with 17.9% lower odds of daily pack smoking. Model 4 shows that the interactive effect is non-significant, although the significant main effects are still informative, yet should be interpreted with caution. When taxes are zero, we again find a significant effect of smoking bans, such that those in cities with bans are 43.6% less likely to smoke a pack daily. Similarly, there is a significant reduction in daily pack smoking as taxes increase in cities with no bans (by 30.0% per $1), though the interaction term tells us that this slope is not significantly different in cities with smoking bans. We note that we also interacted the policy terms by time to determine if these effects vary across the period of observation; these terms were non-significant.
Discussion
These findings provide further evidence for the efficacy of comprehensive clean air policies and excise taxes as tobacco control tools. Yet, we find that their influence is dependent upon the form of smoking under consideration. Our results indicate that any smoking in the past 30 days among young adults is inhibited by comprehensive smoking bans. The outcome of any current smoking includes a large pool of young adults who smoke, but do not smoke at a daily pack level. This indicates that smoking bans may be most effective in deterring social smoking young adults, which may be an important point of early intervention. Given the interaction, comprehensive clean air policies are most pertinent as a tobacco control strategy in locations with low excise taxes. Excise taxes only deter such social smoking in the absence of a ban, and the impact eventually converges with that of smoking bans at high enough tax rates. This finding does not imply that bans are ineffective in high tax environments, but simply that the addition of higher excise taxes does not further deter young adult social smoking. By contrast, heavy smokers are primarily deterred by economic costs incurred through higher excise taxes. We also found limited support for the influence of bans on heavy smoking in places with no taxes, though given the non-significant interaction term, we interpret this finding with caution. Importantly, these policy effects were robust to the inclusion of a considerable battery of control variables at both the individual and city levels.
While both policies impact young adult smoking behaviors, their dual presence does not intensify each policy’s efficacy. In other words, smoking bans and high excise taxes together do not appear to have an additional effect beyond that of each policy in the absence of the other. This finding reiterates that either tobacco control policy can have some impact, as exemplified by the highest levels of smoking occurring in cities with low taxes and no smoking bans. Importantly, there are multiple policy pathways to reducing young people’s smoking, with variation depending on the outcome measure, giving policymakers several effective options for tobacco control. Further, even though the effect of bans and taxes on young adult smoking may converge at high enough tax levels, studies have found other health benefits to passing comprehensive clean air policies, often related to reductions in secondhand smoke intake,55–57 and excise taxes, such as reductions in prenatal exposure.58 Yet, the uneven geographic distribution of these laws may reinforce health disparities given that these policies are more likely to be passed in locations with higher per capita incomes, higher education, and lower percentage of non-Hispanic Blacks after accounting for urbanity.59–60 Considering that clean air policies both directly inhibit smoking and foster the denormalization of tobacco use, policymakers should work to ensure a fair distribution of such tobacco controls in order to promote the health of all.
We are careful to note limitations within our study. First, we only included young adults whose city we could identify. The subset of analyzed respondents is similar on almost all individual-level variables as the sample as a whole, with two exceptions. Given our focus on cities, unsurprisingly Blacks are somewhat overrepresented (34% in subset vs. 27% in whole sample), while Whites are underrepresented (40% vs. 50%) relative to the entire sample. The subset is also more likely to work. We are careful to limit our generalizability to young people living in such locales. Further, CBSAs were first measured in 2004, such that we examine ages 19–31. While restricting the data to age 19 and older, we do not view this restriction as negative given that this constitutes an age when young adults begin to frequent establishments, such as bars and nightclubs, with the most between-city variation in clean air policy and can legally purchase tobacco products. Additionally, members of the longitudinal cohort self-reported smoking behaviors, which may be subject to recall and social desirability biases, as is common in behavioral research.
This article has taken an important next step in the analysis of excise taxes and comprehensive clean air policies as a means of tobacco control among young adults. The strengths include directly linking policy and individual behavior over time, examining the important city-level policy context, and modeling the potential interactive impact of both policies. In sum, we find comprehensive smoking bans and excise taxes to be important forms of tobacco control for young people, but there appear to be no synergistic effects in locations with both policies. Further, each policy impacts a different form of tobacco use.
Acknowledgments
This work was supported by the National Institute on Drug Abuse (Grant #R03DA034933; PI: Vuolo). This research was conducted with restricted access to Bureau of Labor Statistics (BLS) data. The authors would like to thank the staff at the American Nonsmokers’ Rights Foundation (ANRF), particularly Maggie Hopkins and Laura Walpert. The views expressed here do not necessarily reflect the views of the BLS, NIDA, or ANRF. We also thank Emily Harris, Alexandra Marin, Jake Brosius, and Emily Ekl for research assistance.
Appendix A: Descriptive Statistics at Age 26
| Variable | Percentage or Mean (SD) |
|---|---|
| City-Level | |
| Comprehensive ban | 45.34% |
| Excise Tax | $1.43 (1.15) |
| Population | |
| Less than 100,000 | 21.98% |
| 100,000–250,000 | 17.70% |
| 250,000–500,000 | 13.16% |
| 500,000–1,000,000 | 19.48% |
| 1,000,000 or greater | 27.68% |
| Population density (persons/mi2) | 5,730.48 (6,860.56) |
| Owner-occupied housing (%) | 50.09 (9.76) |
| Minors (%) | 23.46 (3.48) |
| Female-headed households (%) | 11.57 (3.48) |
| Non-Hispanic Whites (%) | 47.81 (20.57) |
| Individual-Level | |
| Past 30 days any tobacco use | 34.62% |
| Past 30 days smoked pack daily | 5.34% |
| Gender: Female | 50.52% |
| Race/Ethnicity | |
| White | 39.87% |
| Black | 34.28% |
| American Indian | 0.72% |
| Asian or Pacific Islander | 1.76% |
| Hispanic | 21.94% |
| Other | 1.43% |
| US native | 95.84% |
| Age in 1997 | |
| 12 | 20.76% |
| 13 | 20.51% |
| 14 | 20.26% |
| 15 | 20.05% |
| 16 | 18.41% |
| Parents’ education | |
| Less than HS | 16.84% |
| High school | 29.62% |
| Some college | 24.52% |
| Bachelor’s | 29.02% |
| Parent health | |
| Good-Excellent | 76.63% |
| Fair-poor | 12.99% |
| No parent health info | 10.38% |
| Baseline depression (0–15) | 4.37 (2.45) |
| HS grades: mostly A’s | 12.45% |
| Peers smoking – 1997 | |
| Almost none – less than 10% | 28.47% |
| About 25% | 21.80% |
| About half – 50% | 24.41% |
| About 75% | 17.31% |
| Almost all – more than 90% | 8.00% |
| Living with parent | 21.83% |
| Education | |
| HS dropout | 10.57% |
| HS or GED | 25.08% |
| Some college, not enrolled | 23.29% |
| Two-year degree | 4.91% |
| Four-year degree | 25.69% |
| Enrolled in HS | 0.39% |
| Enrolled in college | 10.07% |
| Moved between counties | 12.55% |
| Employment status | |
| None | 24.74% |
| Part-time | 20.39% |
| Full-time | 54.87% |
| Job schedule | |
| None | 17.29% |
| Day | 54.18% |
| Night | 4.93% |
| Irregular | 23.61% |
| Married | 24.05% |
| Parent | 45.00% |
Note: We report descriptive statistics at age 26 to best represent all respondents in the sample given the rapid change in many of these variables from ages 19 to 31.
Appendix B: Multilevel Logistic Regression of Smoking Outcomes in NLSY97
| Any Tobacco Use
|
Pack Daily
|
|||||||
|---|---|---|---|---|---|---|---|---|
| Model 1
|
Model 2
|
Model 3
|
Model 4
|
|||||
| Coefficient (SE) | OR | Coefficient (SE) | OR | Coefficient (SE) | OR | Coefficient (SE) | OR | |
| City-Level | ||||||||
| Comprehensive ban | −0.224* (0.104) | 0.799 | −0.506** (0.170) | 0.603 | −0.281 (0.173) | 0.755 | −0.573* (0.279) | 0.564 |
| Excise Tax | −0.039 (0.059) | 0.961 | −0.220* (0.104) | 0.803 | −0.197* (0.100) | 0.821 | −0.357* (0.157) | 0.700 |
| Comprehensive ban * Excise Tax | 0.222* (0.105) | 1.249 | 0.231 (0.173) | 1.260 | ||||
| Population (vs. 100,000 or less) | ||||||||
| 100,000–250,000 | −0.216 (0.223) | 0.806 | −0.226 (0.224) | 0.798 | −0.142 (0.272) | 0.868 | −0.151 (0.271) | 0.860 |
| 250,000–500,000 | −0.499 (0.279) | 0.607 | −0.507 (0.279) | 0.602 | 0.411 (0.326) | 1.508 | 0.402 (0.324) | 1.495 |
| 500,000–1,000,000 | −0.308 (0.288) | 0.735 | −0.290 (0.288) | 0.748 | −0.299 (0.343) | 0.742 | −0.278 (0.339) | 0.757 |
| 1,000,000 or greater | −0.210 (0.391) | 0.811 | −0.224 (0.392) | 0.799 | 0.203 (0.451) | 1.225 | 0.179 (0.446) | 1.196 |
| Population density (logged) | −0.021 (0.149) | 0.979 | 0.025 (0.150) | 1.025 | 0.060 (0.170) | 1.062 | 0.092 (0.171) | 1.096 |
| Owner-occupied housing | 0.020 (0.013) | 1.020 | 0.019 (0.013) | 1.019 | 0.007 (0.016) | 1.007 | 0.007 (0.015) | 1.007 |
| Minors | −0.060 (0.034) | 0.942 | −0.054 (0.034) | 0.947 | −0.082 (0.043) | 0.921 | −0.076 (0.043) | 0.927 |
| Female-headed households | 0.010 (0.033) | 1.010 | 0.015 (0.033) | 1.015 | 0.144*** (0.043) | 1.155 | 0.145*** (0.043) | 1.156 |
| Non-Hispanic Whites | −0.003 (0.007) | 0.995 | −0.002 (0.007) | 0.998 | 0.020* (0.009) | 1.020 | 0.021* (0.009) | 1.021 |
| Individual-Level | ||||||||
| Gender: Female | −0.657*** (0.141) | 0.518 | −0.658*** (0.142) | 0.518 | −0.928*** (0.199) | 0.395 | −0.928*** (0.199) | 0.395 |
| Race/Ethnicity (vs. White) | ||||||||
| Black | −1.873*** (0.196) | 0.154 | −1.893*** (0.196) | 0.151 | −2.470*** (0.264) | 0.085 | −2.485*** (0.263) | 0.083 |
| American Indian | −0.235 (0.705) | 0.791 | −0.204 (0.706) | 0.815 | −1.936* (0.969) | 0.144 | −1.893* (0.965) | 0.151 |
| Asian or Pacific Islander | −0.283 (0.583) | 0.753 | −0.267 (0.584) | 0.766 | −2.783 (1.645) | 0.062 | −2.749 (1.637) | 0.064 |
| Hispanic | −1.398*** (0.224) | 0.247 | −1.388*** (0.224) | 0.250 | −2.668*** (0.344) | 0.069 | −2.662*** (0.343) | 0.070 |
| Other | 1.289* (0.543) | 3.628 | 1.293* (0.543) | 3.644 | −0.200 (0.718) | 0.819 | −0.208 (0.719) | 0.812 |
| US native | 1.042* (0.411) | 2.835 | 1.046* (0.411) | 2.846 | 1.225 (0.905) | 3.404 | 1.221 (0.902) | 3.391 |
| Age in 1997 | ||||||||
| 13 | −0.580** (0.215) | 0.560 | −0.592** (0.215) | 0.553 | −0.369 (0.291) | 0.691 | −0.379 (0.291) | 0.685 |
| 14 | −0.402 (0.227) | 0.669 | −0.423 (0.227) | 0.655 | −0.778* (0.315) | 0.459 | −0.789* (0.315) | 0.454 |
| 15 | −0.423 (0.239) | 0.655 | −0.452 (0.240) | 0.636 | −0.663* (0.330) | 0.515 | −0.679* (0.330) | 0.507 |
| 16 | −0.038 (0.254) | 0.962 | −0.074 (0.255) | 0.929 | −0.796* (0.349) | 0.451 | −0.815* (0.350) | 0.443 |
| Parents’ education (vs. < HS) | ||||||||
| High school | 0.122 (0.235) | 1.130 | 0.123 (0.235) | 1.131 | 0.307 (0.317) | 1.359 | 0.306 (0.316) | 1.358 |
| Some college | 0.584* (0.247) | 1.793 | 0.588* (0.248) | 1.800 | 0.728* (0.335) | 2.071 | 0.724* (0.335) | 2.063 |
| Bachelor’s | 0.523* (0.261) | 1.687 | 0.533* (0.261) | 1.704 | 0.183 (0.364) | 1.201 | 0.183 (0.364) | 1.201 |
| Parent health (vs. Good-Excellent) | ||||||||
| Fair-poor | 0.422* (0.213) | 1.525 | 0.425* (0.213) | 1.530 | 0.635* (0.272) | 1.887 | 0.640* (0.271) | 1.896 |
| No parent health info | 0.439 (0.248) | 1.550 | 0.430 (0.248) | 1.537 | 0.122 (0.348) | 1.130 | 0.115 (0.347) | 1.122 |
| Baseline depression | 0.288*** (0.028) | 1.334 | 0.288*** (0.028) | 1.334 | 0.137*** (0.036) | 1.147 | 0.137*** (0.036) | 1.147 |
| HS grades: mostly A’s | −1.148*** (0.225) | 0.317 | −1.147*** (0.225) | 0.318 | −1.710*** (0.451) | 0.181 | −1.698*** (0.450) | 0.183 |
| Peer smoking (vs. Almost none) | ||||||||
| About 25% | 0.509* (0.202) | 1.663 | 0.511* (0.202) | 1.667 | 0.528 (0.292) | 1.696 | 0.526 (0.292) | 1.692 |
| About half – 50% | 0.872*** (0.209) | 2.391 | 0.872*** (0.209) | 2.392 | 0.833** (0.292) | 2.300 | 0.832** (0.292) | 2.298 |
| About 75% | 1.060*** (0.228) | 2.887 | 1.058*** (0.228) | 2.881 | 0.819** (0.313) | 2.268 | 0.815** (0.313) | 2.259 |
| Almost all – >90% | 1.391*** (0.297) | 4.019 | 1.389*** (0.297) | 4.011 | 1.435*** (0.375) | 4.200 | 1.433*** (0.375) | 4.191 |
| Age | 0.586*** (0.181) | 1.797 | 0.637*** (0.183) | 1.891 | 0.435 (0.312) | 1.545 | 0.473 (0.314) | 1.605 |
| Age2 | −0.012*** (0.004) | 0.988 | −0.013*** (0.004) | 0.987 | −0.007 (0.006) | 0.993 | −0.007 (0.006) | 0.993 |
| Living with parent | 0.058 (0.099) | 1.060 | 0.060 (0.099) | 1.062 | 0.073 (0.159) | 1.076 | 0.072 (0.159) | 1.075 |
| Education (vs. 4-yr degree) | ||||||||
| HS dropout | 3.434*** (0.256) | 31.181 | 3.459*** (0.257) | 31.785 | 4.402*** (0.468) | 81.614 | 4.410*** (0.468) | 82.269 |
| HS or GED | 2.458*** (0.200) | 11.678 | 2.475*** (0.200) | 11.882 | 3.720*** (0.418) | 41.264 | 3.731*** (0.418) | 41.721 |
| Some college, not enrolled | 1.805*** (0.177) | 6.078 | 1.817*** (0.177) | 6.153 | 2.907*** (0.405) | 18.302 | 2.919*** (0.405) | 18.523 |
| Two-year degree | 0.850** (0.270) | 2.341 | 0.864** (0.270) | 2.373 | 1.697** (0.582) | 5.458 | 1.697** (0.583) | 5.458 |
| Enrolled in HS | 3.740*** (0.466) | 42.096 | 3.7774*** (0.466) | 43.685 | 3.438*** (0.984) | 31.125 | 3.469*** (0.984) | 32.105 |
| Enrolled in college | 1.070*** (0.161) | 2.915 | 1.086*** (0.161) | 2.962 | 1.935*** (0.412) | 6.924 | 1.943*** (0.412) | 6.980 |
| Moved between counties | 0.155 (0.093) | 1.168 | 0.155 (0.093) | 1.168 | −0.058 (0.159) | 0.944 | −0.063 (0.159) | 0.939 |
| Employment status (vs. None) | ||||||||
| Part-time | 0.165 (0.121) | 1.179 | 0.160 (0.121) | 1.174 | 0.254 (0.207) | 1.289 | 0.250 (0.207) | 1.284 |
| Full-time | 0.082 (0.114) | 1.085 | 0.080 (0.114) | 1.083 | 0.223 (0.195) | 1.250 | 0.223 (0.195) | 1.250 |
| Job schedule (vs. None) | ||||||||
| Day | −0.179 (0.125) | 0.836 | −0.174 (0.125) | 0.840 | −0.313 (0.212) | 0.731 | −0.305 (0.212) | 0.737 |
| Night | 0.394* (0.178) | 1.482 | 0.398* (0.178) | 1.489 | −0.083 (0.289) | 0.920 | −0.076 (0.289) | 0.927 |
| Irregular | −0.208 (0.137) | 0.812 | −0.206 (0.137) | 0.814 | −0.229 (0.229) | 0.795 | −0.223 (0.229) | 0.800 |
| Married | −0.624*** (0.112) | 0.536 | −0.629*** (0.113) | 0.533 | −0.433* (0.194) | 0.649 | −0.439* (0.194) | 0.645 |
| Parent | 0.169 (0.116) | 1.185 | 0.164 (0.116) | 1.178 | 0.266 (0.181) | 1.305 | 0.260 (0.181) | 1.297 |
| (Intercept) | −11.036*** (2.978) | −12.201*** (3.031) | −17.754*** (4.593) | −18.553*** (4.636) | ||||
| Level 2 Variance | 3.833 (0.094) | 3.837 (0.094) | 3.299 (0.146) | 3.299 (0.146) | ||||
| Level 3 Variance | 0.669 (0.130) | 0.670 (0.131) | 0.275 (0.264) | 0.225 (0.324) | ||||
| Log Likelihood | −8095.673 | −8093.448 | −2599.158 | −2598.271 | ||||
p<.05;
p<.01;
p<.001 (two tailed).
Contributor Information
Mike Vuolo, The Ohio State University.
Brian C. Kelly, Purdue University
Joy Kadowaki, Purdue University.
References
- 1.Bayer R, Stuber J. Tobacco control, stigma, and public health: rethinking the relations. Am J Public Health. 2006;96:47–50. doi: 10.2105/AJPH.2005.071886. [DOI] [PMC free article] [PubMed] [Google Scholar]
- 2.U.S. Department of Health and Human Services. How tobacco smoke causes disease: the biology and behavioral basis for smoking-attributable disease: a report of the surgeon general. Rockville, MD: U.S. Department of Health and Human Services Office of the Surgeon General; 2010. [Google Scholar]
- 3.Kelly BC. Smoke-free air policy: subcultural shifts and secondary health effects among NYC club-going youth. Sociol Health Ill. 2009;31:569–82. doi: 10.1111/j.1467-9566.2008.01150.x. [DOI] [PubMed] [Google Scholar]
- 4.Chassin L, Presson CC, Pitts SC, et al. The natural history of cigarette smoking from adolescence to adulthood in a Midwestern community sample: multiple trajectories and their psychosocial correlates. Health Psychol. 2000;19:233–31. [PubMed] [Google Scholar]
- 5.Wills TA, Resko JA, Ainette MG, et al. Smoking onset in adolescence: a person-centered analysis with time-varying predictors. Health Psychol. 2004;23:158–67. doi: 10.1037/0278-6133.23.2.158. [DOI] [PubMed] [Google Scholar]
- 6.Warner KE, Sexton DW, Gillespie BW, et al. Impact of tobacco control on adult per capita cigarette consumption in the United States. Am J Public Health. 2014;104:83–89. doi: 10.2105/AJPH.2013.301591. [DOI] [PMC free article] [PubMed] [Google Scholar]
- 7.Boardman JD, Blalock CL, Pampel FC. Trends in the genetic influences on smoking. J Health Soc Behav. 2010;51:108–23. doi: 10.1177/0022146509361195. [DOI] [PMC free article] [PubMed] [Google Scholar]
- 8.Levy DT, Romano E, Mumford E. The relationship of smoking cessation to sociodemographic characteristics, smoking intensity, and tobacco control policies. Nicotine Tob Res. 2005;7:387–96. doi: 10.1080/14622200500125443. [DOI] [PubMed] [Google Scholar]
- 9.Chahine T, Subramanian SV, Levy JI. Sociodemographic and geographic variability in smoking in the U.S.: a multilevel analysis of the 2006–2007 current population survey, tobacco use supplement. Soc Sci Med. 2011;73:752–58. doi: 10.1016/j.socscimed.2011.06.032. [DOI] [PubMed] [Google Scholar]
- 10.Vuolo M. Placing deviance in a legal and local context: a multilevel analysis of cigarette use in the European Union. Soc Forces. 2012;90:1377–1402. [Google Scholar]
- 11.Nagelhout GE, Mons U, Allwright S, et al. Prevalence and predictors of smoking in ‘smoke-free’ bars: findings from the International Tobacco Control (ITC) Europe Surveys. Soc Sci Med. 2011;72:1643–51. doi: 10.1016/j.socscimed.2011.03.018. [DOI] [PMC free article] [PubMed] [Google Scholar]
- 12.Shang C. The effect of smoke-free air law in bars on smoking initiation and relapse among teenagers and young adults. Int J Environ Res Public Health. 2015;12:504–20. doi: 10.3390/ijerph120100504. [DOI] [PMC free article] [PubMed] [Google Scholar]
- 13.Farrelly MC, Loomis BR, Han B, et al. A comprehensive examination of the influence of state tobacco control programs and policies on youth smoking. Am J Public Health. 2013;103:549–55. doi: 10.2105/AJPH.2012.300948. [DOI] [PMC free article] [PubMed] [Google Scholar]
- 14.Siegel M, Albers AB, Cheng DM, et al. Effect of Local Restaurant Smoking Regulations on Environmental Tobacco Smoke Exposure among Youths. Am J Public Health. 2004;94:321–25. doi: 10.2105/ajph.94.2.321. [DOI] [PMC free article] [PubMed] [Google Scholar]
- 15.Kilgore EA, Mandel-Ricci J, Johns M, et al. Making it harder to smoke and easier to quit: the effect of 10 years of tobacco control in New York City. Am J Public Health. 2014;104:e5–e8. doi: 10.2105/AJPH.2014.301940. [DOI] [PMC free article] [PubMed] [Google Scholar]
- 16.Sanders A, Slade G. State cigarette excise tax, secondhand smoke exposure, and periodontitis in US nonsmokers. Am J Public Health. 2013;103:740–46. doi: 10.2105/AJPH.2011.300579. [DOI] [PMC free article] [PubMed] [Google Scholar]
- 17.Song AV, Dutra LM, Neilands TB, et al. Association of Smoke-Free Laws with Lower Percentages of New and Current Smokers Among Adolescents and Young Adults: An 11-Year Longitudinal Study. JAMA Pediatrics. 2015;169:e152285. doi: 10.1001/jamapediatrics.2015.2285. [DOI] [PMC free article] [PubMed] [Google Scholar]
- 18.Jha P, Peto R. Global effects of smoking, of quitting, and of taxing tobacco. N Engl J Med. 2014;370:60–8. doi: 10.1056/NEJMra1308383. [DOI] [PubMed] [Google Scholar]
- 19.Chaloupka FJ, Yurekli A, Fong JT. Tobacco taxes as a tobacco control strategy. Tob Control. 2012;21:172–80. doi: 10.1136/tobaccocontrol-2011-050417. [DOI] [PubMed] [Google Scholar]
- 20.Becker GS, Grossman M, Murphy KM. An empirical analysis of cigarette addiction. Am Econ Rev. 1994;84:396–418. [Google Scholar]
- 21.Farrelly MC, Bray JW, Pechacek T, et al. Response by adults to increases in cigarette prices by sociodemographic characteristics. South Econ J. 2001;68:156–65. [Google Scholar]
- 22.Tauras JA. Public policy and smoking cessation among young adults in the United States. Health Policy. 2004;68:321–32. doi: 10.1016/j.healthpol.2003.10.007. [DOI] [PubMed] [Google Scholar]
- 23.Jimenez-Ruiz JA, Saenz de Miera B, Reynales-Shigematsu LM, et al. The impact of taxation on tobacco consumption in Mexico. Tob Control. 2008;17:105–10. doi: 10.1136/tc.2007.021030. [DOI] [PubMed] [Google Scholar]
- 24.Townsend J, Roderick P, Cooper J. Cigarette smoking by socioeconomic group, sex, and age: effects of price, income and health publicity. BMJ. 1994;309:923–6. doi: 10.1136/bmj.309.6959.923. [DOI] [PMC free article] [PubMed] [Google Scholar]
- 25.Chaloupka FJ. Macro-social influences: the effects of prices and tobacco-control policies on the demand for tobacco products. Nicotine Tab Res. 1999;1(Suppl. 1):105–9. doi: 10.1080/14622299050011681. [DOI] [PubMed] [Google Scholar]
- 26.Gallet CA, List JA. Cigarette demand: a meta-analysis of elasticities. Health Econ. 2003;12:821–35. doi: 10.1002/hec.765. [DOI] [PubMed] [Google Scholar]
- 27.Blecher EH, van Walbeek CP. An international analysis of cigarette affordability. Tob Control. 2004;9:401–17. doi: 10.1136/tc.2003.006726. [DOI] [PMC free article] [PubMed] [Google Scholar]
- 28.Sung H, Hu T, Ong M, et al. A major state tobacco tax increase, the master settlement agreement, and cigarette consumption: the California experience. Am J Public Health. 2005;95:1030–5. doi: 10.2105/AJPH.2004.042697. [DOI] [PMC free article] [PubMed] [Google Scholar]
- 29.Powell LM, Tauras JA, Ross H. The importance of peer effects, cigarette prices, and tobacco control policies for youth smoking behavior. J Health Econ. 2005;24:950–68. doi: 10.1016/j.jhealeco.2005.02.002. [DOI] [PubMed] [Google Scholar]
- 30.Shipan CR, Volden C. Bottom-Up federalism: the diffusion of antismoking policies from U.S. cities to states. Am J Polit Sci. 2006;50:825–43. [Google Scholar]
- 31.Yang Y. Aging, Cohorts, and Methods. In: Binstock RH, George LK, editors. Handbook of aging and the social sciences. seventh. New York: Academic Press; 2010. pp. 17–30. [Google Scholar]
- 32.Bachman JG, Wadsworth KN, O’Malley PM, et al. Smoking, drinking, and drug use in young adulthood: the impacts of new freedoms and responsibilities. Mahweh, NJ: Lawrence Erlbaum; 1997. [Google Scholar]
- 33.Fleming CB, White HR, Catalano RF. Romantic relationships and substance use in early adulthood: an examination of the influences of relationship type, partner substance use, and relationship quality. J Health Soc Behav. 2010;51:153–67. doi: 10.1177/0022146510368930. [DOI] [PMC free article] [PubMed] [Google Scholar]
- 34.Brown SL, Rinelli LN. Family structure, family processes, and adolescent smoking and drinking. J Res Adolescence. 2010;20:259–73. doi: 10.1111/j.1532-7795.2010.00636.x. [DOI] [PMC free article] [PubMed] [Google Scholar]
- 35.Johnson MK. Further evidence on adolescent employment and substance use: differences by race and ethnicity. J Health Soc Behav. 2004;45:187–97. doi: 10.1177/002214650404500205. [DOI] [PubMed] [Google Scholar]
- 36.Alexander C, Piazza M, Mekos D, et al. Peers, schools, and adolescent cigarette smoking. J Adolescent Health. 2001;29:22–30. doi: 10.1016/s1054-139x(01)00210-5. [DOI] [PubMed] [Google Scholar]
- 37.Schulenberg JE, Bachman JG, O’Malley PM, et al. High school educational success and subsequent substance use: a panel analysis following adolescents into young adulthood. J Health Soc Behav. 1994;35:45–62. [PubMed] [Google Scholar]
- 38.Swan GE, Javitz HS, Jack LM, et al. Heterogeneity in 12-Month Outcome among Female and Male Smokers. Addiction. 2004;99:237–50. doi: 10.1111/j.1360-0443.2003.00629.x. [DOI] [PubMed] [Google Scholar]
- 39.Serbin LA, Karp J. The intergenerational transfer of psychosocial risk: mediators of vulnerability and risk. Annu Rev Psychol. 2004;55:333–63. doi: 10.1146/annurev.psych.54.101601.145228. [DOI] [PubMed] [Google Scholar]
- 40.Braveman P, Egerter S, Williams DR. The social determinants of health: coming of age. Annu Rev Publ Health. 2011;32:381–98. doi: 10.1146/annurev-publhealth-031210-101218. [DOI] [PubMed] [Google Scholar]
- 41.Bygren LO. Intergenerational health responses to adverse and enriched environments. Annu Rev Publ Health. 2013;34:49–60. doi: 10.1146/annurev-publhealth-031912-114419. [DOI] [PubMed] [Google Scholar]
- 42.Wakschlag LS, Pickett KE, Cook E, et al. Maternal smoking during pregnancy and severe antisocial behavior in offspring: a review. Annu Rev Publ Health. 2001;92:966–74. doi: 10.2105/ajph.92.6.966. [DOI] [PMC free article] [PubMed] [Google Scholar]
- 43.Kandel DB, Giesler PC, Mei-Chen H. Intergenerational patterns of smoking and nicotine dependence among US adolescents. Am J Public Health. 2015 doi: 10.2105/AJPH.2015.302775. Online Early. [DOI] [PMC free article] [PubMed] [Google Scholar]
- 44.Kennedy-Hendricks A, Schwartz H, Thornton RJ, et al. Intergenerational social networks and health behaviors among children living in public housing. Am J Public Health. 2015 doi: 10.2105/AJPH.2015.302663. Online early. [DOI] [PMC free article] [PubMed] [Google Scholar]
- 45.Friestad C, Pirkis J, Biehl M, et al. Socioeconomic patterning of smoking, sedentary lifestyle, and overweight status among adolescents in Norway and the United States. J Adolescent Health. 2003;33:275–78. doi: 10.1016/s1054-139x(03)00214-3. [DOI] [PubMed] [Google Scholar]
- 46.Soteriades ES, DiFranza JR. Parents’ socioeconomic status, adolescents’ disposable income, and adolescents’ smoking status in Massachusetts. Am J Public Health. 2003;93:1155–60. doi: 10.2105/ajph.93.7.1155. [DOI] [PMC free article] [PubMed] [Google Scholar]
- 47.Pampel FC, Mollborn S, Lawrence EM. 2014. Life course transitions in early adulthood and SES disparities in tobacco use. Soc Sci Res. 2014;43:45–59. doi: 10.1016/j.ssresearch.2013.08.005. [DOI] [PMC free article] [PubMed] [Google Scholar]
- 48.Margolis R. Educational differences in healthy behavior changes and adherence among middle-aged Americans. J Health Soc Behav. 2013;54:353–68. doi: 10.1177/0022146513489312. [DOI] [PMC free article] [PubMed] [Google Scholar]
- 49.Johnson RA, Hoffmann JP. Adolescent cigarette smoking in U.S. racial/ethnic subgroups: findings from the national education longitudinal study. J Health Soc Behav. 2000;41:392–407. [PubMed] [Google Scholar]
- 50.Pampel FC. Racial convergence in cigarette use from adolescence to the mid-thirties. J Health Soc Behav. 2008;49:484–98. [PMC free article] [PubMed] [Google Scholar]
- 51.Pampel FC. Cigarette diffusion and sex differences in smoking. J Health Soc Behav. 2001;42:388–404. [PubMed] [Google Scholar]
- 52.Mathur C, Erickson DJ, Stigler MH, et al. Individual and neighborhood socioeconomic status effects on adolescent smoking: a multilevel cohort-sequential latent growth analysis. Am J Public Health. 2013;103:543–48. doi: 10.2105/AJPH.2012.300830. [DOI] [PMC free article] [PubMed] [Google Scholar]
- 53.Leclere FB, Rogers RG, Peters K. Neighborhood social context and racial differences in women’s heart disease mortality. J Health Soc Behav. 1998;39:91–107. [PubMed] [Google Scholar]
- 54.Goldstein H. Multilevel statistical models, first internet edition. London: Institute of Education; 1999. [Google Scholar]
- 55.Pell JP, Haw S, Cobbe S, et al. Smoke-free legislation and hospitalizations for acute coronary syndrome. New Engl J Med. 2008;359:482–91. doi: 10.1056/NEJMsa0706740. [DOI] [PubMed] [Google Scholar]
- 56.Menzies D, Nair A, Williamson PA, et al. Respiratory symptoms, pulmonary function, and markers of inflammation among bar workers before and after a legislative ban on smoking in public places. JAMA. 2006;296:1742–48. doi: 10.1001/jama.296.14.1742. [DOI] [PubMed] [Google Scholar]
- 57.Lin H, Park J, Seo D. Comprehensive US statewide smoke-free indoor air legislation and secondhand smoke exposure, asthma prevelance, and related doctor visits: 2007–2011. Am J Public Health. 2015;105:1617–22. doi: 10.2105/AJPH.2015.302596. [DOI] [PMC free article] [PubMed] [Google Scholar]
- 58.Hawkins SS, Baum CF. Impact of state cigarette taxes on disparities in maternal smoking during pregnancy. Am J Public Health. 2014;104:1464–70. doi: 10.2105/AJPH.2014.301955. [DOI] [PMC free article] [PubMed] [Google Scholar]
- 59.Huang J, King BA, Babb SD, et al. Sociodemographic disparities in local smoke-free law coverage in 10 states. Am J Public Health. 2015;105:1806–13. doi: 10.2105/AJPH.2015.302655. [DOI] [PMC free article] [PubMed] [Google Scholar]
- 60.Gonzalez M, Sanders-Jackson A, Song AV, et al. Strong Smoke-Free Law Coverage in the United States by Race/Ethnicity: 2000–2009. Am J Public Health. 2013;103:e62–e66. doi: 10.2105/AJPH.2012.301045. [DOI] [PMC free article] [PubMed] [Google Scholar]