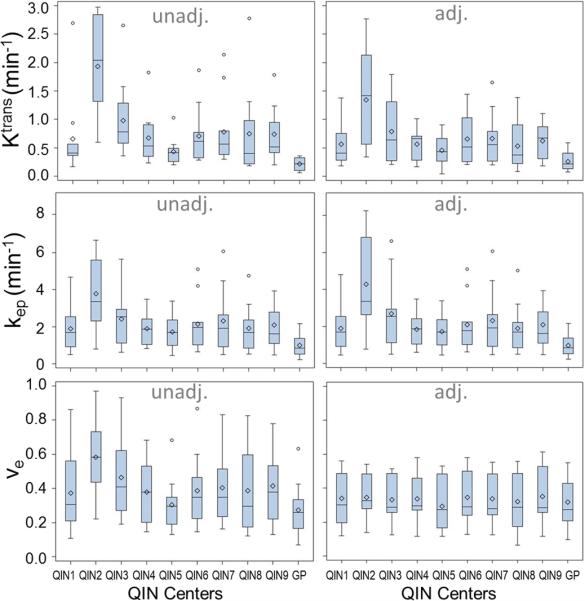
Figure 3.

Boxplots of the tumor mean Ktrans, ve, and kep parameters for the 11 subjects obtained with unadjusted (unadj.) and adjusted (adj.) AIFs from the 9 centers and the population averaged GP AIF from the literature (28). The diamond and bar symbols represent the mean and median values, respectively. The body of the box is bounded by the upper 25% and lower 25% quartiles, representing the interquartile range of the middle 50% of the measurements. The upper and lower whiskers define the range of non-outliers. The outliers are plotted as dots beyond the whiskers.
