

Abstract
Background and Purpose
Malignant EEG patterns are considered predictive of poor outcome in comatose survivors of cardiac arrest. We hypothesize that malignant patterns by EEG are associated with evidence of more severe brain injury on MRI.
Materials and Methods
Retrospective review of clinical, imaging and EEG data of 33 adult comatose survivors of cardiac arrest following therapeutic hypothermia was performed. Outcomes measured included discharge destination and survival. Imaging studies were visually scored for severity of brain injury. Mean whole brain apparent diffusion coefficient (wbADC) and percentage of severely injured brain (ADC < 700 ×10−6mm2/sec) were calculated. Continuous EEG interpretation was characterized as malignant or non-malignant. Nonparametric tests were performed to assess the relationship of patient outcome, MRI and EEG patterns.
Results
Subjects with anatomic evidence of diffuse brain injury were less likely to have malignant EEG patterns. Subjects with malignant EEG patterns, invariably associated with bad outcomes, were observed to have wbADC measures similar to subjects with non-malignant EEG patterns and good outcome and different than subjects with non-malignant EEG patterns and bad outcomes. Regional hippocampal or basal ganglia injury was associated with bad outcome regardless of EEG findings.
Conclusions
We found discordant evidence of brain injury by MRI and EEG, refuting our initial hypothesis. Malignant EEG patterns were generally more frequent in subjects with less severe brain injury by MRI. These findings suggest a complementary role of MRI and EEG and support the aggressive treatment of malignant EEG patterns in this population.
INTRODUCTION
Prognostication of survival and functional outcome in comatose survivors of cardiac arrest is challenging. A multimodal approach to prognostication including continuous electroencephalography (EEG) patterns, clinical assessment of initial illness severity, magnetic resonance imaging (MRI) spontaneous evoked potentials and serum biomarkers has been recommended.1–5 The role of MRI is not standardized despite relatively good sensitivity and specificity documented in studies performed prior to routine therapeutic hypothermia.6,7 However, brain imaging and malignant EEG patterns following therapeutic hypothermia have not been comprehensively described. We hypothesize that malignant EEG patterns are associated with greater extent of brain injury evident on MRI, which would explain the typically poor outcomes within this subset of patients. Understanding the relationship between these modalities may establish an evidenced based role for MRI in prognostication following cardiac arrest.
MATERIALS AND METHODS
This study was approved by the University of Pittsburgh Institutional Review Board. Informed consent was not required by the IRB for this retrospective study as these data are included as part of an ongoing quality assurance initiative.
Study Population
All subjects were comatose adults aged 24 to 80 admitted at a single tertiary care enter following resuscitation from an in- or out- of hospital cardiac arrest between 4/14/2010 and 10/29/2011. All subjects underwent a standardized care plan including therapeutic hypothermia for 24 hours with a target temperature of 33ºC.8 This plan includes aggressive coronary revascularization for patients with coronary ischemia given its association with improved outcomes.9 MRIs and EEG were ordered at the discretion of the attending physician and only individuals with both continuous EEG and MRI were included. Continuous EEG monitoring was performed for at least 48 hours and was initiated within a median time of 9 hours10. EEG recordings were continued beyond 48 hours in those with malignant EEG patterns.
Demographics, details of cardiac arrest and outcome
A review of the clinical record was performed to obtain the following: Age, sex, initial cardiac rhythm, survival, disposition at time of hospital discharge, EEG pattern, time from arrest to MRI, GCS at time of MRI and length of stay in hospital. Demographics were compared between groupings based on clinical outcome and EEG patterns using non-parametric Kruskal- Wallis and Fisher’s Exact tests. Outcome was based on survival and disposition at time of hospital discharge11. A good outcome was defined as survival, with discharge to home or acute inpatient rehabilitation. Other dispositions, including death, persistent vegetative state and nursing home admission, were considered a bad outcome (Supplemental Table 1).
EEG Interpretation
EEG interpretations were characterized as previously defined.2,10 EEG data and reports were analyzed and classified using three EEG categories depending on the presence of malignant EEG patterns (MEP), pure suppression-burst or non-malignant EEG patterns. We characterized the following EEG patterns as MEPs: Seizures, generalized periodic discharges (GPD), status epilepticus, and myoclonic status epilepticus (MSE). The EEG classification definitions are based on the American Clinical Neurophysiological Society standardized critical care EEG terminology to define equivocal patterns seen in encephalopathic patients and for management of status epilepticus.12–15 All EEGs were independently reviewed by a board certified neurophysiologist with specialization in EEG and with expertise in post-arrest EEG interpretation (MB).16 The electrophysiologist reviewing these studies may have provided the initial clinical interpretation, however, determination of malignant patterns was performed at a time remote from the initial clinical presentation and blinded to the patient’s outcome and initial presentation.
MR Imaging and analysis
All included subjects underwent clinical MRI of the brain during their hospitalization, utilizing typical imaging parameters (GE 1.5T; DWI acquisition parameters: B value=1000, 3 directions, TR 8000, TE=minimum, 26 FOV, 5/1 slice/gap with a 128×128 matrix size, asset enabled for artifact reduction; T2-FLAIR acquisition parameters: TE 120–160, TR 8,000–10,000, TI ~2250, 22 FOV, 5/1/slice/gap with a 256×192 matrix size, Nex=1). The extent of suptratentorial gyral restricted diffusion was visually scored17–19 as sub-total or diffuse (examples in Figure 1). The subtotal manifestations included a normal appearance, or restricted diffusion evident in focal areas, more posterior involvement or basal ganglia only. Involvement of the hippocampus and basal ganglia(unilateral or bilateral) was recorded independently. The presence of diffuse gyral edema as evidenced by expansile gyral T2 signal abnormality and sulcal effacement, independent of DWI findings, was recorded as present or absent. All images were visually inspected by three CAQ certified neuroradiologists (JM, VA, HK) who were blinded to clinical data and whole brain ADC measures; disagreement was mediated by 2/3 consensus.
Fig 1.

Selected examples of patterns of DWI, ADC and T2-FLAIR abnormalities in subjects without (A) and with (B-D) malignant EEG patterns (longitundinal bipolar montage (LFF 1H, HFF 70Hz) 60Hz notch on, sensitivity 7uV/mm). All of these subjects had bad outcome (death, coma or persistent vegetative state at discharge). A, diffuse gyral edema and restricted diffusion, wbADC=666 ×10−6 mm2/sec. EEG (non malignant) pattern of diffuse background slowing. B, Focal diffusion abnormality involving the sensorimotor cortices, wbADC=835 ×10−6 mm2/sec. EEG demonstrating (malignant) suppression burst pattern. Bursts associated with clinical jerks. C, Essentially normal MR appearance of the brain, wbADC=782 ×10−6 mm2/sec. EEG demonstrating (malignant) pattern of generalized periodic discharges (GPDs). D, Posterior (parietal) diffusion abnormality with little gyral edema, wbADC=824 ×10−6 mm2/sec. EEG (malignant) pattern of GPDs.
Whole brain ADC measurements
ADC maps were retrospectively segmented using a mask derived from the brain extraction tool (FSL, Oxford) using the b0 image of the DWI, and thresholded to include only voxels with ADC < 1000 ×10−6 mm2/sec, in order to exclude CSF containing spaces. All extracted and thresholded ADC maps were visually inspected for artifacts or errors of processing. Whole brain mean ADC (wbADC) values were generated using fslstats (FSL, Oxford). In addition, the percentage of whole brain voxels with ADC value <700 ×10−6 mm2/sec was determined by dividing the number of voxels in the brain below 700 ×10−6mm2/sec by the total number of voxels contained in the extracted and thresholded ADC maps.6
Statistical analysis
Subjects were divided according to patterns of brain injury observed by MRI: Diffuse cortical restricted diffusion as compared to those with no, focal or posterior patterns of restricted diffusion; presence or absence of hippocampal injury as evidenced on DWI/ADC; presence or absence of gyral edema. Fisher’s Exact test analyses of the association of EEG pattern with imaging findings were performed.
Values of wbADC were compared between subjects 1) with a malignant EEG pattern, 2) subjects without a malignant EEG pattern who had a good outcome and 3) subjects without a malignant EEG pattern who had a bad outcome. There were no subjects with a malignant EEG pattern and a good outcome. Median values and interquartile ratings of wbADC were determined; non-parametric Kruskal-Wallis testing was performed to evaluate the distribution of observed values across groups, including age, time from arrest to MRI and whole brain ADC measures. Pearson’s correlation coefficient was calculated to determine the relationship of mean whole brain ADC and time from arrest to MRI.
RESULTS
No subjects were excluded after visual inspection of masked and threshold ADC maps for artifact or obvious errors. Basic demographics comparing the groupings based on a malignant pattern of EEG and outcome are presented in Table 1. Length of stay did not differ between the three groups. GCS on the day of MRI did not differe between those with malignant or non-maliganant EEG who experienced a poor neurologic outcome.
Table 1.
Demographics of groups based on EEG pattern and outcome. IQR, interquartile range; PEA, pulseless electrical activity; VF/VT, ventricular fibrillation/ventricular tachycardia. Note there were no individuals with malignant EEG and good outcome in this cohort. There were no significant differences by groupings using Kruskal-Wallis and Fisher’s Exact tests for nonparametric analysis of continuous and categorical variables, respectively; sex and days from arrest to MRI were nearly significant with p=0.051 and 0.065, respectively.
| Malignant EEG (n=0) | Malignant EEG (n=9) | Nonmalignant EEG (n=12) | Nonmalignant EEG (n=12) | p-value | |
|---|---|---|---|---|---|
| Outcome: | Good | Bad | Good | Bad | |
| Age (median age, IQR) | n/a | 50 (42.5–59.5) | 53.5 (43.5–63.0) | 58.5 (43–66.0) | 0.252 |
| Female (% female) | n/a | 8 (89%) | 4 (33%) | 6 (50%) | 0.051 |
| Arrest to MRI (median days, IQR) | n/a | 3, 2.5–5.0 | 5.0, 4.3–10.3 | 4, 3–4 | 0.065 |
| Length of Stay (median days, IQR) | n/a | 9, 5–18 | 23, 13–27 | 13.5, 6–24.5 | 0.077 |
| GCS at time of MRI (median score, IQR) | 4 (3–6) | 10* (8.5–14) | 6 (3.5–8) | 0.0014 | |
| Rhythm of Arrest (#) | |||||
| Asystole | n/a | 2 | 3 | 3 | 0.71 |
| PEA | n/a | 2 | 1 | 4 | |
| VF/VT | n/a | 4 | 6 | 5 | |
| Unknown | n/a | 1 | 2 | 0 | |
| Location of Arrest (#) | |||||
| In hospital | n/a | 2 | 1 | 3 | 0.53 |
| Out of hospital | n/a | 7 | 11 | 9 |
p<0.01 for comparison to the “bad outcome” groups; non-significant difference between the “bad outcome” groups.
EEG pattern and outcome
Among the 9 patients with malignant EEG patterns, all 9 (100%) had a bad outcome. Among the 24 patients with non-malignant EEG patterns, 12 had a bad outcome.(p=0.012, Fisher’s Exact test). Of note, all but one of the patients with a malignant pattern demonstrated GPDs alone (see examples, Figure 1C and 1D). The remaining patient’s continuous EEG demonstrated epileptiform discharges and myoclonic status epilepticus in addition to GPDs (Figure 1B).
Patterns of brain injury associated with groupings based on EEG pattern and outcome
Table 2 demonstrates associations of patterns of brain injury evident on MRI with groupings based on EEG patterns and outcome. There was no significant difference in the presence or absense of diffuse gyral edema between the groups; however, there were significant differences based on pattern of restricted diffusion, and evidence of either basal ganglia or hippocampal involvement.
Table 2.
Patterns of brain injury evident on MRI with groupings based on EEG and outcome. Fisher’s Exact test.
| Malignant EEG (n=0) | Malignant EEG (n=9) | Non-malignant EEG (n=12) | Non-malignant EEG (n=12) | p= | |
|---|---|---|---|---|---|
| Outcome: | Good | Bad | Good | Bad | |
| # with Diffuse pattern of restricted diffusion (%) | n/a | 0 (0%) | 1 (8.3%) | 5 (41.7%) | 0.05 |
| # with Diffuse pattern of gyral edema (%) | n/a | 3 (33%) | 1 (17%) | 6 (50%) | 0.25 |
| # with Restricted diffusion in basal ganglia (any) (%) | n/a | 4 (44%) | 1 (17%) | 10 (83%) | 0.005 |
| # with Restricted diffusion in the hippocampi (%) | n/a | 1 (11%) | 0 (0%) | 5 (50%) | 0.009 |
Whole brain ADC measures
There were no subjects with a good outcome and malignant EEG pattern. The distribution of the number of days from arrest to MRI was not significantly different between groups based on outcome and EEG findings. There was no significant correlation of mean wbADC values with the time from arrest to MRI (Pearson’s r=0.22).
Non-parametric testing of the distribution of mean wbADC and percentage of brain voxels with ADC values < 700 × 10-6 mm2/sec between groups based on outcome and EEG patterns resulted in p values of 0.151 and 0.082, respectively (Figure 2). There is a large variance evident in the population with non-malignant EEG and bad outcome.
Fig 2.
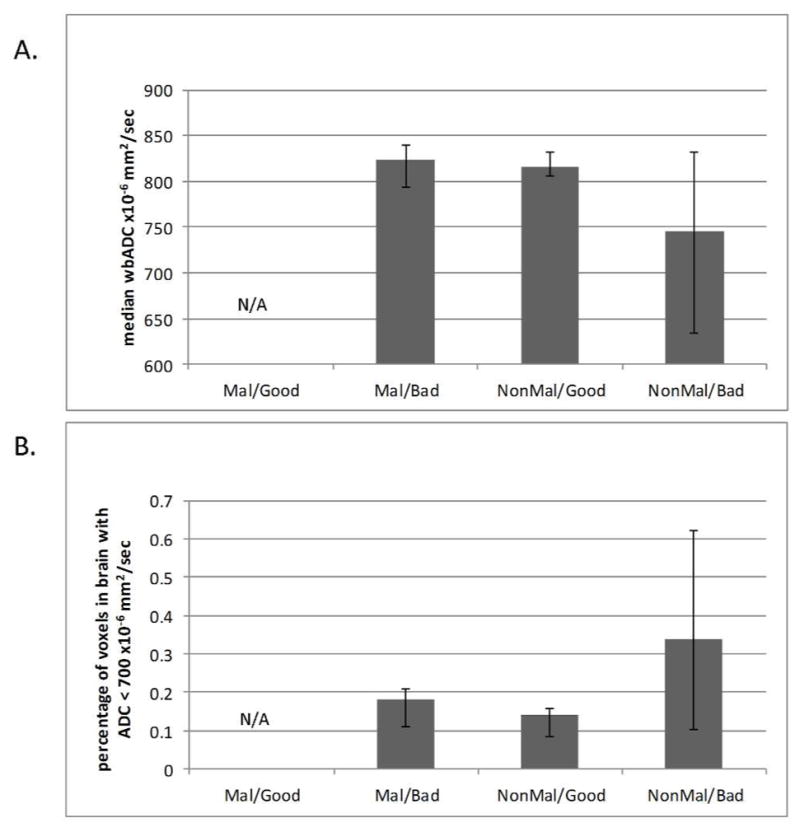
Whole brain median ADC values compared between groups based on pattern of EEG and outcome (median+/- interquartile ratio). A, whole brain ADC ×10−6 mm2/sec and B, percentage of brain voxels with ADC < 700 ×10−6 mm2/sec. There were no subjects with a malignant pattern and good outcome. ADC, apparent diffusion coefficient; Mal, malignant EEG; NonMal, nonmalignant EEG.
DISCUSSION
This study demonstrates a discordant pattern of brain injury demonstrated on MRI, continuous EEG patterns and outcome in comatose survivors of cardiac arrest. While this and other studies have demonstrated that a malignant EEG pattern is associated with poor outcome, it was assumed that the underlying brain injury evident by MRI was also severe and extensive.10,20,21 Our study suggests otherwise. Although associated with poor outcomes, patients with malignant EEG patterns were observed to have less extensive evidence of structural brain injury by MRI, despite similar GCS at time of MRI.
Under the current clinical protocol, continuous EEG is obtained during the first 48 hours including a period of therapeutic hypothermia. Our findings suggest that a malignant EEG pattern may not reflect diffuse cortical injury. Patients with malignant EEG patterns do not reliably demonstrate MRI evidence of anatomic injury. Therefore, mechanisms other than cortical injury may influence the development of malignant EEG patterns. Aggressive pre-emptive treatment to prevent the development or persistence of malignant EEG patterns may also prevent additional brain injury and improve patient outcomes.22
Dysregulation of electrophysiology networks, leading to period-type malignant patterns, may contribute to a comatose state in the absence of anatomic injury evident by MRI. The underlying mechanism to generate these patterns is not well understood, but is supported by the observation that most epileptics are non-lesional. Furthermore, injured subcortical and brainstem generators of electrophysiologic activity may contribute to malignant patterns when disproportionately affected, as compared to cortical structures. Cobb and Hill first proposed a theory of “cortical isolation”, suggesting that severing connectivity between the cortex and subcortical structures resulted in periodic patterns.23 These cortical-subcortical networks have been characterized in preclinical models of seizures24–26, and others have reported the generation of period EEG patterns generated by injury to cortical-subcortical white matter in the absence of cortical injury27,28. Gloor reviewed autopsies of patients with periodic lateralized epileptiform discharges and saw grey matter lesions only,29 and metabolic or electrophysiologic etiologies were also implicated in GPDs.30,31 These findings suggest a role for the coordination of cortical and subcortical/brainstem structures in maintaining healthy network electrophysiology.
This discordant finding of malignant pattern/poor outcome and relatively benign MRI appearance may explain in part why the prognostic value of MRI and ADC mapping has been limited by poor predictive performance given a large number of false negatives, i.e., individuals with relatively normal appearing MRIs and yet with poor outcome.6,7,32 Although, some of these patients die from causes unrelated to ongoing CNS pathology, diffuse cortical brain injury may be incompatible with generation of malignant EEG patterns, whereas focal insults and/or relative preservation of regions of uninjured brain may predispose to the development of malignant EEG patterns, in particular GPDs. Unfortunately, it is unclear to what extent therapeutic hypothermia may alter brain MRI findings after cardiac arrest. Given the results of the targeted temperature management (TTM) trial33, future work may address this question.
Although non-parametric testing of whole brain measures of ADC did not reach significance of p<0.5 (Figure 2), there was a clear disproportionate trend evident in the population with malignant EEG patterns and bad outcome that was discordant from the population with bad outcome and no evidence of malignant EEG pattern, best demonstrated by evaluation of the extent of ADC values < 700×10−6mm2/sec. Future neuroprognostication tools will need to characterize patients based on clinical, electrophysiologic and neuroanatomic testing to determine optimal therapy and predict outcomes.
Once thought to be a rare pattern, GPD has increasingly been observed in ICU patients due to more aggressive continuous EEG monitoring. However, there is still no consensus on the pathophysiological generators of GPD, seen in diverse settings: Infectious processes (Creutzfeldt-Jakob disease, sub-acute sclerosing pan-encephalitis), drug overdoses (Lithium, Ketamine, PCP, baclofen), anoxia (cardiac arrest), status epilepticus and metabolic states (hepatic and uremic encephalopathy).30,31 GPD is associated with poor outcome following cardiac arrest, except when observed in isolation.34 In our study, GPD was common and associated with less extensive evidence of brain injury by MRI. A prior study reported 21.4% of patients with GPD patterns had normal imaging studies.30 Hippocampal DWI signal abnormality was more commonly associated with bad outcome,35 but was also significantly more frequent in those without malignant EEG patterns.
Injury to the basal ganglia and hippocampus as evidenced by restricted diffusion had a greater likelihood of a bad outcome, although these findings were not uniformly associated with the presence of a malignant EEG pattern. Regional variations in brain injury have been shown in cardiac arrest preceded by respiratory arrest36 and hippocampal injury is associated with poor outcome35. Initial arrest may result in watershed type injury to both hippocampi37. Impaired bilateral limbic network function may preclude meaningful recovery despite intact cortical networks and motor function. Such findings may reflect a different mechanism of injury or be related to extra-cranial multi-organ dysfunction. Within this retrospective cohort there was aggressive treatment of epileptiform activity with anti-epileptic drugs, which may alter the nature of ictal discharges. However, 8 of the 9 subjects with a malignant pattern demonstrated this pattern on day 1, prior to initiation of anti-epileptiform drugs. No EEG was obtained after day 3 indicating that all malignant patterns were successfully suppressed by this time. However, some individuals may have delayed development of malignant EEG patterns not captured in this retrospective study but perhaps contributing to subsequent imaging findings. Importantly, these findings suggest that anatomic lesions may not be good predictors of pathologic electrophysiology. One hypothesis is that abnormal interactions between the “deranged cortex” and deeper “triggering” structures in the setting of increased local cortical irritability likely contribute to periodic patterns.29,38 These abnormal interactions may or may not be associated with lesions evident on MRI. Herpes encephalitis and posterior reversible encephalopathy syndrome are processes in which malignant EEG patterns can be seen with a normal MRI and are potentially reversible. Quantitative analysis of continuous EEG may help clarify underlying neuropathophysiology in cardiac arrest and subsequent resuscitation. Complex patterns involving subcortical networks have been described by Moretti et al in the setting of memory impairment and dementias.39 This type of quantitative analysis may provide a fundamentally different observation than the current qualitative assessment as presented here.
The primary limitations of this study include a small sample size and the retrospective nature of the study. There is a selection bias against the most severely ill patients, who were perhaps never imaged. Furthermore, the MRI and EEG interpretations were available to the treating physicians and likely influenced decisions to withdraw support, potentially resulting in a self-fulfilling prophecy. However, length of stay did not differ between the groups, suggesting that there was no systematic bias based on early withdrawal of care, and the mean length of stay for all groups substantially exceeded published clinical guidelines.40,41 Prospective studies including MRI and EEG are indicated to mitigate this potential bias. Whole brain measures of ADC do not evaluate regional brain injury. Future studies should evaluate long term outcomes at least 3 months post-discharge; the recovery phase is dynamic and may require up to one year.42
Early malignant EEG patterns identified within a subset of comatose post-cardiac arrest patients treated with therapeutic hypothermia are not associated with more extensive evidence of brain injury on MRI. The prevalent recording of global periodic discharges in this cohort suggests that there may be a metabolic or reversible etiology for the periodic pattern, or intact cortex that may be salvageable if further injury is prevented. Regional injury to hippocampal or basal ganglia structures may predict poor outcome irrespective of EEG findings, potentially reflecting different mechanisms of arrest. These findings demonstrate the importance of considering both EEG and MRI data for comatose survivors of cardiac arrest and supports aggressive treatment of malignant patterns.
CONCLUSIONS
Patients with malignant EEG patterns were observed to have less MRI evidence of brain injury, yet remained associated with poor outcome in this retrospective study. GPD, a pattern that was previously considered rare, was the most common malignant pattern observed. This electrophyssiologic pattern may be more common in the post-therapeutic hypothermia era, and may represent a reversible injury. These findings demonstrate the importance of integrating both EEG and MRI data when evaluating comatose survivors of cardiac arrest. Aggressive pre-emptive treatment to prevent the development, persistence or progression of malignant EEG patterns may prevent additional brain injury and improve patient outcomes.
Supplementary Material
Acknowledgments
Funding
The project described was supported by the National Institutes of Health through Grant Number UL1-TR-000005.
We are appreciative of the excellent clinical care and data collection by the Post Cardiac Arrest Service at the University of Pittsburgh Medical Center. Special thanks to Dr. Hrishikesh Kale for his contribution to the imaging analysis.
Abbreviations
- EEG
electroencephalography
- FSL
FMRIB software library 5.0
- GPD
generalized periodic discharges
- MEP
malignant EEG pattern
- MSE
myoclonic status epilepticus
- TTM
targeted therapeutic management
- wbADC
whole brain apparent diffusion coefficient
Footnotes
DISCLOSURES: Jon Rittenberger—UNRELATED: Grants/Grants Pending: NIH funding, American Heart Association grant-in-aid, Laerdal Foundation for Acute Medicine, Comments: Grant support for other projects germane to anoxic brain injury.
References
- 1.Bouwes A, et al. Predictive value of neurological examination for early cortical responses to somatosensory evoked potentials in patients with postanoxic coma. Journal of neurology. 2012;259:537–541. doi: 10.1007/s00415-011-6224-5. [DOI] [PMC free article] [PubMed] [Google Scholar]
- 2.Coppler PJ, et al. Validation of the Pittsburgh Cardiac Arrest Category illness severity score. Resuscitation. 2015;89:86–92. doi: 10.1016/j.resuscitation.2015.01.020. [DOI] [PMC free article] [PubMed] [Google Scholar]
- 3.Levy DE, et al. Predicting outcome from hypoxic-ischemic coma. Jama. 1985;253:1420–1426. [PubMed] [Google Scholar]
- 4.Taccone F, et al. How to assess prognosis after cardiac arrest and therapeutic hypothermia. Critical care. 2014;18:202. doi: 10.1186/cc13696. [DOI] [PMC free article] [PubMed] [Google Scholar]
- 5.Young GB. Clinical practice. Neurologic prognosis after cardiac arrest. The New England journal of medicine. 2009;361:605–611. doi: 10.1056/NEJMcp0903466. [DOI] [PubMed] [Google Scholar]
- 6.Wijman CA, et al. Prognostic value of brain diffusion-weighted imaging after cardiac arrest. Annals of neurology. 2009;65:394–402. doi: 10.1002/ana.21632. [DOI] [PMC free article] [PubMed] [Google Scholar]
- 7.Choi SP, et al. Diffusion-weighted magnetic resonance imaging for predicting the clinical outcome of comatose survivors after cardiac arrest: a cohort study. Critical care. 2010;14:R17. doi: 10.1186/cc8874. [DOI] [PMC free article] [PubMed] [Google Scholar]
- 8.Rittenberger JC, et al. Outcomes of a hospital-wide plan to improve care of comatose survivors of cardiac arrest. Resuscitation. 2008;79:198–204. doi: 10.1016/j.resuscitation.2008.08.014. [DOI] [PMC free article] [PubMed] [Google Scholar]
- 9.Reynolds JC, et al. Coronary angiography predicts improved outcome following cardiac arrest: propensity-adjusted analysis. Journal of intensive care medicine. 2009;24:179–186. doi: 10.1177/0885066609332725. [DOI] [PMC free article] [PubMed] [Google Scholar]
- 10.Rittenberger JC, Popescu A, Brenner RP, Guyette FX, Callaway CW. Frequency and timing of nonconvulsive status epilepticus in comatose post-cardiac arrest subjects treated with hypothermia. Neurocritical care. 2012;16:114–122. doi: 10.1007/s12028-011-9565-0. [DOI] [PMC free article] [PubMed] [Google Scholar]
- 11.Rittenberger JC, Tisherman SA, Holm MB, Guyette FX, Callaway CW. An early, novel illness severity score to predict outcome after cardiac arrest. Resuscitation. 2011;82:1399–1404. doi: 10.1016/j.resuscitation.2011.06.024. [DOI] [PMC free article] [PubMed] [Google Scholar]
- 12.Chong DJ, Hirsch LJ. Which EEG patterns warrant treatment in the critically ill? Reviewing the evidence for treatment of periodic epileptiform discharges and related patterns. Journal of clinical neurophysiology : official publication of the American Electroencephalographic Society. 2005;22:79–91. doi: 10.1097/01.wnp.0000158699.78529.af. [DOI] [PubMed] [Google Scholar]
- 13.Hirsch LJ, et al. American Clinical Neurophysiology Society’s Standardized Critical Care EEG Terminology: 2012 version. Journal of clinical neurophysiology : official publication of the American Electroencephalographic Society. 2013;30:1–27. doi: 10.1097/WNP.0b013e3182784729. [DOI] [PubMed] [Google Scholar]
- 14.Westhall E, et al. Interrater variability of EEG interpretation in comatose cardiac arrest patients. Clinical neurophysiology : official journal of the International Federation of Clinical Neurophysiology. 2015 doi: 10.1016/j.clinph.2015.03.017. [DOI] [PubMed] [Google Scholar]
- 15.Brophy GM, et al. Guidelines for the evaluation and management of status epilepticus. Neurocritical care. 2012;17:3–23. doi: 10.1007/s12028-012-9695-z. [DOI] [PubMed] [Google Scholar]
- 16.Amorim E, et al. Malignant EEG patterns in cardiac arrest patients treated with targeted temperature management who survive to hospital discharge. Resuscitation. 2015;90:127–132. doi: 10.1016/j.resuscitation.2015.03.005. [DOI] [PMC free article] [PubMed] [Google Scholar]
- 17.Arbelaez A, Castillo M, Mukherji SK. Diffusion-weighted MR imaging of global cerebral anoxia. AJNR. American journal of neuroradiology. 1999;20:999–1007. [PMC free article] [PubMed] [Google Scholar]
- 18.Wijdicks EF, Campeau NG, Miller GM. MR imaging in comatose survivors of cardiac resuscitation. AJNR. American journal of neuroradiology. 2001;22:1561–1565. [PMC free article] [PubMed] [Google Scholar]
- 19.Singhal AB, Topcuoglu MA, Koroshetz WJ. Diffusion MRI in three types of anoxic encephalopathy. Journal of the neurological sciences. 2002;196:37–40. doi: 10.1016/s0022-510x(02)00019-9. [DOI] [PubMed] [Google Scholar]
- 20.Knight WA, et al. The incidence of seizures in patients undergoing therapeutic hypothermia after resuscitation from cardiac arrest. Epilepsy research. 2013;106:396–402. doi: 10.1016/j.eplepsyres.2013.06.018. [DOI] [PMC free article] [PubMed] [Google Scholar]
- 21.Sadaka F, Doerr D, Hindia J, Lee KP, Logan W. Continuous Electroencephalogram in Comatose Postcardiac Arrest Syndrome Patients Treated With Therapeutic Hypothermia: Outcome Prediction Study. Journal of intensive care medicine. 2014 doi: 10.1177/0885066613517214. [DOI] [PubMed] [Google Scholar]
- 22.Randomized clinical study of thiopental loading in comatose survivors of cardiac arrest. Brain Resuscitation Clinical Trial I Study Group. The New England journal of medicine. 1986;314:397–403. doi: 10.1056/NEJM198602133140701. [DOI] [PubMed] [Google Scholar]
- 23.Cobb W, Hill D. Electroencephalogram in subacute progressive encephalitis. Brain : a journal of neurology. 1950;73:392–404. doi: 10.1093/brain/73.3.392. [DOI] [PubMed] [Google Scholar]
- 24.Avoli M, Kostopoulos G. Participation of corticothalamic cells in penicillin-induced generalized spike and wave discharges. Brain research. 1982;247:159–163. doi: 10.1016/0006-8993(82)91042-3. [DOI] [PubMed] [Google Scholar]
- 25.Gioanni Y, Gioanni H, Mitrovic N. Seizures can be triggered by stimulating non-cortical structures in the quaking mutant mouse. Epilepsy research. 1991;9:19–31. doi: 10.1016/0920-1211(91)90043-f. [DOI] [PubMed] [Google Scholar]
- 26.Gloor P. Generalized epilepsy with bilateral synchronous spike and wave discharge. New findings concerning its physiological mechanisms. Electroencephalography and clinical neurophysiology. Supplement. 1978:245–249. [PubMed] [Google Scholar]
- 27.Vercueil L, Hirsch E. Seizures and the basal ganglia: a review of the clinical data. Epileptic disorders : international epilepsy journal with videotape. 2002;4(Suppl 3):S47–54. [PubMed] [Google Scholar]
- 28.Badawy RA, Lai A, Vogrin SJ, Cook MJ. Subcortical epilepsy? Neurology. 2013;80:1901–1907. doi: 10.1212/WNL.0b013e3182929f4f. [DOI] [PubMed] [Google Scholar]
- 29.Gloor PKO, Giard N. THE ELECTROENCEPHALOGRAM IN DIFFUSE ENCEPHALOPATHIES: ELECTROENCEPHALOGRAPHIC CORRELATES OF GREY AND WHITE MATTER LESIONS. Brain : a journal of neurology. 1968;91:24. [Google Scholar]
- 30.Yemisci M, Gurer G, Saygi S, Ciger A. Generalised periodic epileptiform discharges: clinical features, neuroradiological evaluation and prognosis in 37 adult patients. Seizure. 2003;12:465–472. doi: 10.1016/s1059-1311(02)00351-5. [DOI] [PubMed] [Google Scholar]
- 31.Janati A, Chesser MZ, Husain MM. Periodic lateralized epileptiform discharges (PLEDs): a possible role for metabolic factors in pathogenesis. Clinical EEG. 1986;17:36–43. [PubMed] [Google Scholar]
- 32.Greer D, et al. Clinical MRI interpretation for outcome prediction in cardiac arrest. Neurocritical care. 2012;17:240–244. doi: 10.1007/s12028-012-9716-y. [DOI] [PubMed] [Google Scholar]
- 33.Nielsen N, et al. Targeted temperature management at 33 degrees C versus 36 degrees C after cardiac arrest. The New England journal of medicine. 2013;369:2197–2206. doi: 10.1056/NEJMoa1310519. [DOI] [PubMed] [Google Scholar]
- 34.Foreman B, et al. Generalized periodic discharges in the critically ill: a case-control study of 200 patients. Neurology. 2012;79:1951–1960. doi: 10.1212/WNL.0b013e3182735cd7. [DOI] [PMC free article] [PubMed] [Google Scholar]
- 35.Greer DM, et al. Hippocampal magnetic resonance imaging abnormalities in cardiac arrest are associated with poor outcome. Journal of stroke and cerebrovascular diseases : the official journal of National Stroke Association. 2013;22:899–905. doi: 10.1016/j.jstrokecerebrovasdis.2012.08.006. [DOI] [PubMed] [Google Scholar]
- 36.Drabek T, et al. Global and regional differences in cerebral blood flow after asphyxial versus ventricular fibrillation cardiac arrest in rats using ASL-MRI. Resuscitation. 2014;85:964–971. doi: 10.1016/j.resuscitation.2014.03.314. [DOI] [PMC free article] [PubMed] [Google Scholar]
- 37.Walha K, Ricolfi F, Bejot Y, Nonent M, Ben Salem D. Hippocampus: a “forgotten” border zone of brain ischemia. Journal of neuroimaging : official journal of the American Society of Neuroimaging. 2013;23:98–101. doi: 10.1111/j.1552-6569.2011.00610.x. [DOI] [PubMed] [Google Scholar]
- 38.Brenner RP, Schaul N. Periodic EEG patterns: classification, clinical correlation, and pathophysiology. Journal of clinical neurophysiology : official publication of the American Electroencephalographic Society. 1990;7:249–267. [PubMed] [Google Scholar]
- 39.Moretti DV, Paternico D, Binetti G, Zanetti O, Frisoni GB. Analysis of grey matter in thalamus and basal ganglia based on EEG alpha3/alpha2 frequency ratio reveals specific changes in subjects with mild cognitive impairment. ASN neuro. 2012;4:e00103. doi: 10.1042/AN20120058. [DOI] [PMC free article] [PubMed] [Google Scholar]
- 40.Callaway CW, et al. Part 8: Post-Cardiac Arrest Care: 2015 American Heart Association Guidelines Update for Cardiopulmonary Resuscitation and Emergency Cardiovascular Care. Circulation. 2015;132:S465–482. doi: 10.1161/CIR.0000000000000262. [DOI] [PMC free article] [PubMed] [Google Scholar]
- 41.Peberdy MA, et al. Part 9: post-cardiac arrest care: 2010 American Heart Association Guidelines for Cardiopulmonary Resuscitation and Emergency Cardiovascular Care. Circulation. 2010;122:S768–786. doi: 10.1161/CIRCULATIONAHA.110.971002. [DOI] [PubMed] [Google Scholar]
- 42.Raina KD, Rittenberger JC, Holm MB, Callaway CW. Functional Outcomes: One year after a cardiac arrest. Biomed Research International. 2015 doi: 10.1155/2015/283608. [DOI] [PMC free article] [PubMed] [Google Scholar]
Associated Data
This section collects any data citations, data availability statements, or supplementary materials included in this article.