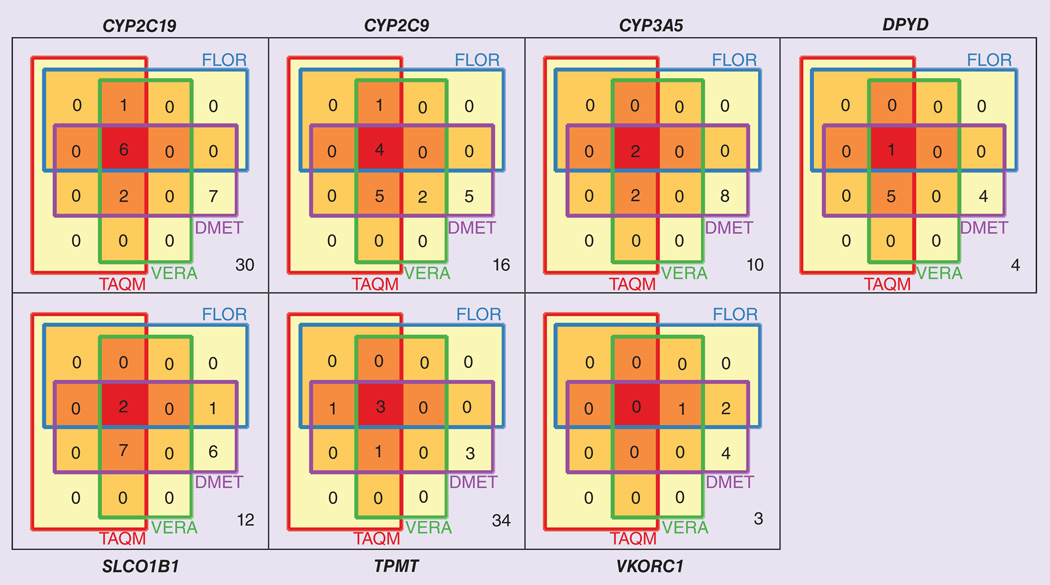
Figure 3. Venn diagram displaying the numbers and overlaps of polymorphisms covered by constrained views derived from four pharmacogenomic assays.
Numbers of polymorphisms not covered by any assay-derived constrained view but covered by haplotype definition tables are shown on the lower right of each panel. See text for details.

