

Abstract
PCP2, a member of the GoLoco domain-containing family, is present exclusively in cerebellar Purkinje cells and retinal ON bipolar cells. Its function in these tissues is unknown. Biochemical and expression system studies suggest that PCP2 is a guanine nucleotide dissociation inhibitor, although a guanine nucleotide exchange factor has also been suggested. Here, we studied the function of PCP2 in ON bipolar cells because their light response depends on Gαo1, which is known to interact with PCP2. We identified a new splice variant of PCP2 (Ret-PCP2) and localized it to rod bipolar and ON cone bipolar cells. Electroretinogram recordings from PCP2-null mice showed a normal a-wave but a slower falling phase of the b-wave (generated by the activity of ON bipolar cells) relative to the wild type. Whole-cell recordings from rod bipolar cells showed, both under Ames medium and after blocking GABAA/C and glycine receptors, that PCP2-null rod bipolar cells were more depolarized than wild-type cells with greater inward current when clamped to −60 mV. Also under both conditions, the rise time of the response to intense light was slower by 28% (Ames) and 44% (inhibitory blockers) in the null cells. Under Ames medium, we also observed >30% longer decay time in the PCP2-null rod bipolar cells. We conclude that PCP2 facilitates cation channels closure in the dark, shortens the rise time of the light response directly, and accelerates the decay time indirectly via the inhibitory network. These data can most easily be explained if PCP2 serves as a guanine nucleotide exchange factor.
Keywords: PCP2, retina, ON bipolar, GoLoco, GEF, GDI
Introduction
Heterotrimeric G-proteins are composed of a Gα subunit and a Gβγ dimer. Receptor activation of GαGDP βγ causes GDP to exchange with GTP, leading to the dissociation of Gβγ from GαGTP and the activation of these subunits. The active GαGTP and Gβγ then modulate a variety of effectors in a cell-specific manner (Pierce et al., 2002). The Gα subunit intrinsically hydrolyzes the GTP into GDP, and GαGDP then rebinds Gβγ, forming the inactive heterotrimer, which terminates the cycle (Neer, 1994).
Several protein families modulate the G-protein cycle. GTPase-accelerating proteins (GAPs) enhance the intrinsic rate of GTP hydrolysis on Gα, guanine nucleotide exchange factors (GEFs) facilitate GDP/GTP exchange, and guanine nucleotide dissociation inhibitors (GDIs) inhibit the release of GDP from Gα (for review, see Siderovski and Willard, 2005). The GDI modulators are characterized by GoLoco motifs that interact with GDP-bound Gαi/o and inhibit GDP dissociation (De Vries et al., 2000; Peterson et al., 2000; Bernard et al., 2001; Willard et al., 2004; Siderovski and Willard, 2005). However, it is not clear how this function contributes to cell signaling. An intriguing member of the GDI modulators is Purkinje cell protein-2 (PCP2) (also called L7 or GPSM4), which is expressed only by cerebellar Purkinje cells and retinal ON bipolar cells (Nordquist et al., 1988; Berrebi et al., 1991; Vandaele et al., 1991; Berrebi and Mugnaini, 1992). PCP2 has two splice variants that interact with Gα of the Gi/o family (Luo and Denker, 1999; Zhang et al., 2002). Biochemical assays show that PCP2 behaves as a GDI (Natochin et al., 2001, 2002) (but see Luo and Denker, 1999). This function could be supported by expression in heterologous systems (Kinoshita-Kawada et al., 2004) and cultured mammalian cells (PC12) (Willard et al., 2004; Guan et al., 2005). Yet PCP2-null mice apparently lack a discernible phenotype (Mohn et al., 1997; Vassileva et al., 1997), so its function in the native tissue is still unclear.
A useful and important cell type for studying PCP2 function is the retinal rod bipolar cell. Because this cell expresses PCP2 and Gαo, and its light response requires Gαo1 (Dhingra et al., 2000, 2002), it provides a specific function to investigate. In darkness, when glutamate is released from photoreceptors, Gαo1 couples the mGluR6 receptor to a cascade that closes a nonselective cation channel, and maintains the cell hyperpolarized (Nawy and Jahr, 1990; Shiells and Falk, 1990; de la Villa et al., 1995; Redd et al., 2002; Dhingra et al., 2004; Okawa and Sampath, 2007). When light reduces photoreceptor glutamate release, the mGluR6 receptor is deactivated and the cation channel opens, leading to cell depolarization. PCP2 interacts and coimmunoprecipitates with Gαo, thus likely modulating the light response (Luo and Denker, 1999; Redd et al., 2002; Dhingra et al., 2004). Here, we identify a new splice variant of PCP2 (Ret-PCP2) in several types of ON bipolar cells, and using the PCP2-null mouse, we find that Ret-PCP2 helps maintain the cell hyperpolarized and speeds up the light response.
Materials and Methods
C57BL/6J wild-type (WT) mice (Charles River Laboratories) and PCP2 knock-out (KO) mice (Mohn et al., 1997) (>15 generations backcrossed onto C57BL/6J) were deeply anesthetized by intraperitoneal injection of a mixture of 85 μg/g ketamine and 13 μg/g xylazine; the eyes were enucleated and the mouse was killed by anesthetic overdose. Animals were treated in compliance with federal regulations and University of Pennsylvania policy. For reverse transcription (RT)-PCR and Western blotting, retinas were detached quickly and frozen in liquid nitrogen; for immunocytochemistry, the eye was fixed by immersion in buffered 4% paraformaldehyde for 1 h. For visualizing ON bipolar cells, we used the Grm6-green fluorescent protein (GFP) transgenic mouse that was produced in our laboratory (Morgan et al., 2006; Dhingra et al., 2008). For visualizing type 7 cone bipolar cells, we used GUS8.4-GFP transgenic retinas (a kind gift from Dr. Robert F. Margolskee, Mount Sinai School of Medicine, New York, NY) (Wong et al., 1999; Ogura et al., 2002; Huang et al., 2003).
Cloning of retinal PCP2
An ON bipolar cDNA library was prepared using a SMART cDNA construction kit (Dhingra et al., 2008), and plasmids were isolated with a QiaPrep Spin Miniprep kit (QIAGEN). In some experiments, PCP2 was amplified by rapid amplification of cDNA ends (RACE)-PCR using pEXP forward primer: 5′-gct ctc tgg cta act aga gaa ccc-3′, and PCP2 reverse primer: 5′-gcc cag gat ggc tag aac tc-3′. In other experiments, PCP2 was amplified by RT-PCR from whole retinal RNA prepared using a Nucleospin RNA II kit (Clontech). Reverse transcription was performed on 1 μg of total RNA with oligo-dT primers using Moloney murine leukemia virus reverse transcriptase (BD Biosciences). For this PCR, the forward primer was as follows: 5′-cac aat gga cca gga aga aga-3′, and the reverse primer was as follows: 5′-gcc cag gat ggc tag aac tc-3′. PCRs used 35 cycles (94°C for 1 min, 58°C for 30 s, and 72°C for 2 min) and were performed on a programmable thermocycler (PerkinElmer Life and Analytical Sciences). The PCR product was then subcloned into pcDNA3.1 using pcDNA3.1/V5-His TOPO TA expression vector (Invitrogen) to yield Ret-PCP2 pcDNA3.1.
Cell culture and transfection
Human embryonic kidney (HEK) 293 cells were cultured at 37°C in a 5% CO2 incubator in Dulbecco's minimal essential medium supplemented with Penstrep (Invitrogen) and 10% heat-inactivated fetal bovine serum. Approximately 50% confluent cells were transiently transfected with Ret-PCP2 pcDNA 3.1 using Fugene transfection reagent (Invitrogen). Cells were harvested 48 h later. Control PCP2-1B protein (cerebellar long form) was produced by lysis of Sf9 insect cells infected with baculovirus (BAC) carrying the 1B cDNA.
Antibodies
Rabbit polyclonal antibody against PCP2 was raised against a peptide representing the extreme N terminus of the 1B cerebellar form (long protein coding form) whose sequence is MAGSPDQEGFFNLLTHVQGDR (see Results). With the exception of the methionine, this peptide sequence corresponds exactly to Ret-PCP2 amino acids 18-37. This PCP2 peptide was conjugated to bovine thyroglobulin in glutaraldehyde and used in the rabbit-based RIBI Adjuvant System (R-730; RIBI ImmunoChem Research). The initial injection was followed by a second injection at 4 weeks and sera sampling at 5 weeks. A ∼16 kDa band was detected via Western blotting using the sera from one of two N2Z rabbits, and this rabbit was reinjected with conjugated peptide at 12 and 15 weeks. One week after the final injection, killing was performed and blood was collected from the positive rabbit. Cleared sera were run over a bovine thyroglobulin column (Sepharose CL-4B; Sigma-Aldrich) to remove thyroglobulin reactive antibodies and the flow-through was concentrated by ammonium sulfate precipitation. A rabbit anti-exon 3 of PCP2 (common to all forms) was a gift from John Oberdick (Ohio State University, Columbus, OH). The monoclonal antibody against protein kinase C (PKC)α (clone MC5) was raised in mouse against PKC purified from bovine brain and purchased from GE Healthcare.
Western blotting
Retina, cerebellum, and HEK cells were homogenized using Polytron homogenizer in a lysis buffer containing 5 mM Tris-HCl, pH 7.5, 2 mM EDTA, and 350 mM sucrose. Homogenate was centrifuged at 6000 × g for 10 min, and the supernatant was collected. Protein assay was performed using BCA protein reagent (Bio-Rad). The proteins were run on 15% SDS-PAGE gel and transferred to a nitrocellulose membrane using semiwet transfer apparatus (Bio-Rad). In some experiments, proteins were separated on high resolution 10% Bis-Tris NuPAGE/MES gels from Novex with Multimark standards. Blots were then incubated sequentially in the following: PBS containing 5% nonfat dry milk and 0.1% Triton X-100 (PBST) at room temperature for 1 h; PCP2 antibody diluted in PBST (1:10,000) at 4°C overnight; PBST; antirabbit linked to HRP for 3 h at room temperature (Jackson ImmunoResearch; 1:3000); and PBST. Positive bands were detected with SuperSignal West Femto Maximum Sensitivity Substrate (Pierce Biotechnology).
Immunoprecipitation and mass spectrometry
Mouse retinas were collected in lysis buffer (10 mM Tris-HCl, pH 7.4, 150 mM NaCl, 1% Triton X-100, 1 mM EDTA, 1 mM EGTA, 0.5% Igepal). The cells were homogenized at low speed and centrifuged at 8000 × g in an Eppendorf centrifuge for 5 min. The supernatant was precleared by adding 20 μl of protein G-agarose beads (Invitrogen), centrifuging, and collecting the supernatant. This precleared supernatant was incubated with rabbit anti-PCP2 and protein G-agarose beads on a rotator at 4°C for 16 h. The beads with protein complexes were then pulled down by centrifuging (10,000 × g), washed thoroughly in lysis buffer, resuspended in Lammelli buffer, boiled, spin filtered, and run on a 15% SDS polyacryamide gel. The band corresponding to the Ret-PCP2 protein was cut out and subjected to mass spectrometry (MS)/MS microsequencing. For microsequencing, peptide samples were dissolved in 5 μl of 0.1% formic acid, injected into a C18 capillary column, and eluted by linearly increasing the mobile phase composition to 98% Buffer B (0.1% formic acid in 100% acetonitrile) at a flow rate of 200 nl/min. The eluted peptides were sequenced on-line with a nanospray/Qstar-XL mass spectrometer (Applied Biosystems). The data were acquired and analyzed with Analyst QS. The protein identification and database search were performed with Sequest search against the Ret-PCP2 database.
Immunocytochemistry
Fixed eyes were rinsed in buffer, soaked overnight in 30% buffered sucrose, and embedded in a mixture of two parts 20% sucrose in phosphate buffer and one part tissue freezing medium. The eye was cryosectioned radially at a 10-15 μm thickness. Sections were soaked in diluent containing 10% normal goat serum, 5% sucrose, and 0.5% Triton X-100 in phosphate buffer. They were then incubated in primary antibodies (anti-PCP2, 1:1000; or anti-PKCα, 1:20) at 4°C overnight, washed, incubated (3 h) in secondary antibodies conjugated to a fluorescent marker, and rinsed and mounted in Vectashield (Vector Laboratories). For double staining, incubations were done as they were for single labeling, but with both primary antibodies and both secondary antibodies being applied simultaneously.
Electroretinogram recording
The experimental apparatus, methods of light stimulation and quantification, electroretinographic recording, and cone signal isolation have been described in detail previously (Lyubarsky et al., 1999, 2000). Briefly, a mouse was dark-adapted overnight. Then, under dim red light, it was deeply anesthetized by intraperitoneal injection of ketamine (20 μg/g), xylazine (8 μg/g), and urethane (800 μg/g) and placed onto a warmed (37°C) platform. The eyes were dilated with 1% Mydriacyl (Alcon). A platinum recording electrode contacted both corneas, and the reference electrode was in the animal's mouth. The animal was then placed inside a light-proof Faraday cage that also served as a Ganzfeld, with appropriate ports and baffles to ensure uniform illumination. The light stimuli were brief (∼10 ms) flashes generated by xenon flash lamps, and delivered in a multiport, customized Ganzfeld through calibrated filters. Stimulus intensity and spectral composition were controlled with neutral density and bandpass interference filters. Light intensities were calibrated and converted to estimated number of photoisomerizations per photoreceptor (R*) as described previously (Lyubarsky et al., 1999, 2000). Electroretinograms (ERGs) were recorded from both eyes using differential amplifiers with a bandwidth of 0.1 Hz to 1 kHz. The filtered traces were digitized at 5 kHz. Data were analyzed with Clampfit software and the responses between WT and KO mice were compared with a Mann-Whitney test.
The ERG a-wave component was fitted with the transduction cascade activation model (Breton et al., 1994; Lyubarsky and Pugh, 1996) (see Fig. 4E, dotted line) as follows:
| (1) |
where F(t) is the a-wave amplitude (in microvolts) at time t after a brief flash normalized to the saturated amplitude; Φ, photoisomerizations per rod; teff, a brief delay (a few milliseconds); A, amplification constant, whose value was then estimated by the best fit.
Figure 4.

The falling phase of the b-wave of the ERG is slower in the PCP2-null mouse than in the wild type. A, ERG responses of dark-adapted WT and PCP2-null (KO) mice to a strong 10 ms light flash (31 R*/rod/flash). The arrows in all panels denote the onset of light stimuli. B, Averages of normalized b-waves of the wild-type (black trace) and PCP2-null (gray trace) mice. The rising phase and the initial fast falling phase of the null mouse resembled those of the wild type. However, the second falling phase in the null mouse was slower than in the wild type. C, To measure decay of the ERG response, the amplitude of the b-wave was measured at 150 ms after its peak (B, vertical dashed line). In wild type, this amplitude decayed by 90% of the peak (where 100% is peak to baseline), whereas in null mice, it decayed by only 81% of peak (n = 6 animals each; Mann-Whitney test, p<0.001). Error bars indicate SEM. D, Expanded, averaged a-waves of wild-type and null mice to saturating light (10,000 R*/rod) looks similar. E, An example of normalized ERG a-wave component (solid lines) from a wild-type (black) and a null mouse (gray) fitted with the transduction cascade activation model (dotted lines). The three responses to flashes of 870, 1800, and 3600 R*/rod were fitted simultaneously with Equation 1 with the least-squares method.
Whole-cell recording
Retinas of dark-adapted mice (0.5-1 h) were dissected under dim red light (780 nm; illuminance equivalent to 6.4 Rh* · rod−1 · s−1), placed on a 0.65 μm cellulose filter membrane (Millipore), and cut into 200-μm-thick slices with a tissue slicer (Narishige). The retinal slices were transferred to a recording chamber, secured with vacuum grease, and then moved to the microscope stage of an Olympus microscope equipped with a 60× water-immersion objective (background illumination, 0.01 Rh* · rod−1 · s−1). The chamber was perfused at a rate of 1-2 ml/min with oxygenated (95% O2,5% CO2) Ames medium (Sigma-Aldrich) containing sodium bicarbonate (1.9 g/L) at 32-34°C. In certain experiments, inhibitory input attributable to Cl- current was blocked with 100 μM picrotoxin and 2 μM strychnine that were added to the bath solution.
Patch pipettes with 5-7 MΩ resistance were fabricated from borosilicate glass using an electrode puller (Sutter Instrument). Pipettes were filled with the following solutions (in mM): 110 K-gluconate, 10 EGTA, 10 HEPES, 10 KCl, 5 NaCl, 4 MgATP, and 1 LiGTP, pH adjusted to 7.4 with KOH; or, when potassium was replaced with cesium to block potassium current: 108 Cs-gluconate, 20 EGTA, 10 HEPES, 10 NaCl, 4 MgATP, and 1 LiGTP, pH adjusted to 7.4 with NaOH; osmolality was 290 mOsmol. The solutions were aliquoted, stored at −20°C, and defrosted before each experiment. Lucifer yellow (∼2%) was then dissolved in the pipette solution for visualizing the cells after recording. All chemicals were obtained from Sigma-Aldrich.
Whole-cell recordings were obtained with EPC 10 amplifier (HEKA) and the input and series resistances were ∼1 GΩ and 10-25 MΩ, respectively. Cells were discarded if the baseline current exceeded −100 pA at −60 mV. Membrane potentials were corrected for the liquid junction potential, which was calculated to be ∼15 mV for both pipette solutions. Somas of bipolar cells located in the inner nuclear layer close to the outer plexiform layer were targeted. A rod bipolar cell was identified by its inward current to light stimulus (at negative holding potential) and by its axon ending in varicosities near the ganglion cell layer (Fig. 5, inset). Voltage command generation and data acquisition were accomplished with Pulse software (HEKA).
Figure 5.

The PCP2-null rod bipolar cell has a larger light response and a more depolarized resting membrane potential than the wild-type cell. Whole-cell recordings from rod bipolar cells in WT and null(KO) mice were performed in current-clamp (CC) (A, C, D) and voltage-clamp (VC) modes (B, E, F). Holding potential was −60mV. The image located between A and B shows a typical retinal slice with a Lucifer yellow-stained rod bipolar cell (b) and an attached recording electrode (e). A, B, Voltage and current responses of a single rod bipolar cell to 10 ms flashes (dotted lines) of increasing intensities. Intensities given in log photons μm−2 are shown by the numbers below the traces. C, E, Average voltage and current responses to a saturating flash intensity of 2.9 log photons μm−2. The average resting membrane potential of the null cells was ∼9 mV more depolarized than that of the wild type, and the holding current of the null cells was ∼20 pA larger than that of wild type (p < 0.001). In C-F, data are from eight PCP2-null mice (40 cells for CC; 43 for VC) and seven wild-type mice (40 cells for CC; 41 for VC). D, F, Intensity-response profiles. At most intensities, the peak voltage amplitude, measured as the difference between baseline and the peak of the response, appeared similar for null and wild-type cells. At the lowest intensity, the null cells did have slightly larger peaks. Under voltage clamp, at all intensities, the peak current amplitude tended to be larger in null than in wild-type cells. Error bars indicate SEM.
Light stimulus and data analysis
The retina was stimulated with a green full-field light generated by a light-emitting diode (LED) with peak wavelength at 565 nm. The light illuminance, controlled linearly by adjusting the LED current, was measured at the location of the slice as photons per square micrometer per second. Whenever necessary, these intensities were attenuated by inserting a neutral density filter (−1 to −2 log units) in the light path. Because the light was projected through the condenser (numerical aperture, 0.8), it had to pass through the thickness of the slice before it reached the rods that contacted the recorded bipolar cell. Consequently, the light flux in the rods was lower than measured. In Results, we present the intensity units as measured in photon per square micrometer per flash. However, to obtain the intensity calibrated in terms of R*/rod, we measured the attenuation of the light using a cooled CCD camera focused at the surface of the slice with or without the slice in the path. This fraction ranged from 0.17 to 0.19 for an average of 0.18. Multiplying this fraction by 33.6 μm2 (rod area, 24 μm long and 1.4 μm wide), 0.024 [photon absorbed per rod thickness; based on 0.019/μm2 specific density (Lyubarsky et al., 2004) × 0.5 correction for orientation (Ed Pugh, personal communication)], 0.67 (quantum efficiency), and 0.16 (sensitivity at 565 nm relative to peak) (Baylor et al., 1984; Lamb, 1995) yields 1 photon · μm−2 · flash−1 equivalent to 0.016 R* · rod−1 · flash−1.
For each cell, a sequence of five different intensities was repeated three times, and the recordings were averaged. These averages are displayed in Results as recording traces. To facilitate analysis, we removed highfrequency noise (>6 Hz) by digitally filtering the averaged trace with a Gaussian filter using Igor Pro (Wavemetrics). Baseline potential was determined by averaging values over a 1 s interval before each stimulus onset, and peak response was measured as the peak value minus the baseline. Time to peak, half-maximum width (half-width), and decay time from 90% of the peak to 10% was measured with the aid of Clampfit (Molecular Devices).
Noise analysis was performed from the baseline activity of the cell during darkness before presentation of the first light stimulus using Pulse software. Noise was defined as the SD of the spontaneous activity recorded over 2 s in three trials for each cell. The SD was then averaged across trials and cells. The noise level between wild-type and null mice was compared with Student's t test.
The intensity-response family of wild-type mice was compared with that of PCP2-null mice using a factorial ANOVA test with repeated measurements. Responses of wild-type and null mice to a specific light intensity were compared with a Student's t test. Differences were considered significant when p ≤ 0.05. All data are reported as mean ± SEM. Unless otherwise stated, statistical results were reported as a p value obtained by the ANOVA tests.
Results
Retina expresses a new splice variant of PCP2
RACE-PCR of the bipolar cell cDNA library followed by sequencing revealed the presence of a unique 5′ upstream sequence in the PCP2 mRNA (Fig. 1). When amplified with a primer located upstream to the previously identified exon 1, a reaction product of ∼450 bp was obtained (Fig. 1A). PCR product sequencing and comparison with the mouse Pcp2 gene revealed the presence of a putative exon different from either cerebellar splice variant (Fig. 1B). This sequence appears to represent a new exon because it has a splice donor site (GU) after it, and an initiation codon with Kozak consensus sequence (AcaATGG) to facilitate translation. Isolation and sequence analysis of multiple individual RACEPCR clones (R. Feddersen, unpublished data) indicates that the start of transcription occurs within a block of purine nucleotides ∼25 bp upstream of the start methionine codon (Fig. 1C, junction of the RED and blue sequence). We refer to this new exon as “exon 1ret.” Exon 1ret followed by exons 2-4 yields a new protein variant of PCP2, which we call “Ret-PCP2” (GenBank accession number EU164759). Ret-PCP2 is predicted to encode a 15 kDa protein that is longer than the cerebellar long form by an additional 16 aa at the N terminus. Whereas the short cerebellar form possesses one GoLoco motif, both the long cerebellar form and Ret-PCP2 possess two GoLoco motifs (Fig. 1C).
Figure 1.

Retina expresses a new splice variant of PCP2 transcript, Ret-PCP2. A, A prominent PCR product of ∼450 bp (arrow) resulted from PCR amplification of retinal (ret) cDNA and ON bipolar (bp) cDNA library. The sequence of this reaction product (Ret-PCP2) is shown in C. Control included water instead of cDNA sample. B, Schematic representation of the three splice variants of PCP2. The filled boxes indicate the coding region. C, Sequence organization of the mouse Pcp2 locus. Ret-PCP2 includes a region upstream to exon 1A (named exon 1ret). Exon 1ret has a start codon that predicts a protein of 15 kDa. The boxed areas indicate Go-Loco motifs. The primers used are highlighted in yellow, and the amino acid sequence used to generate the antibody is highlighted in gray. The 5′ upstream/exon 1ret junction (indicated with red/blue nucleotides) was determined by isolating individual RACE clones and sequencing with a vector primer. Different protein products are represented with different colored single-letter amino acid codes.
To see whether this predicted protein is expressed in retina, we performed Western blots of retinal homogenates with an antibody raised against the N terminus of form B PCP2. These blots revealed a retinal protein that was larger than the cerebellar PCP2, but had similar mobility to Ret-PCP2 expressed by transfected HEK cells (Fig. 2A). This protein band was absent in the PCP2-null retina (Fig. 2B). An antibody raised against exon 3 also gave a single, larger band in retina (Fig. 2C). Mass spectrometry analysis (MS/MS) from the immunoprecipitated PCP2 revealed a peptide unique to Ret-PCP2 with a score xC of 2.54 (Fig. 2D).
Figure 2.

The predicted new isoform of PCP2 is expressed in retinal ON bipolar cells. A, Western blots of proteins of retinal, cerebellar (cereb), and HEK cells. HEK cells were either untransfected (Un-HEK) or transfected with pcDNA3.1 Ret-PCP2 construct (Tr-HEK). The blot was probed with the antibody we generated against the N terminus region of exon2. PCP2 in extracts from retina and transfected HEK cells migrated with similar mobility, whereas a single band from cerebellum migrated faster. B, Western blots of WTandPCP-null (KO) retinas showed that the 15 kDa PCP2 band was eliminated in the null retina. C, Western blot containing protein lysates from retina and cerebellum as in A probed with an antibody against exon3, a regioncommonto all PCP2 isoforms. Lysate from cells expressing the large cerebellar form (1B) was included as a control (BAC). Note, only a single band appears in cerebellum and retina. D, Ret-PCP2 was immunoprecipitated with the antibody against the N terminus region of exon 2, isolated by SDS-PAGE and subjected to mass spectrometry (MS/MS) microsequencing analysis. This revealed a Ret-PCP2 unique peptide (shown below the blot) with a score xC=2.54 (cutoff is 2.5). E, In the wild-type retina, staining for PCP2 localizes to somas high in the INL, whose axons terminate throughout sublamina b of the IPL. Staining in ON bipolar dendrites and axon terminals seemed equally strong. ONL,Outer nuclear layer; OPL, outer plexiform layer; INL, inner nuclear layer; IPL, inner plexiform layer; GCL, ganglion cell layer. F, In null retina, staining for PCP2 was totally eliminated.
Ret-PCP2 localizes to the rod bipolar cell and a subset of ON cone bipolar cells
Staining for Ret-PCP2 was restricted to bipolar cell somas located high in the inner nuclear layer (Fig. 2E). These cells sent axons that crossed sublamina a of the inner plexiform layer, and terminated in sublamina b. Different dilutions of the antibody revealed that staining intensities in both dendrites and axons were similar. Because the stained axon terminals arborized throughout sublamina b and were not restricted to stratum 5 in which rod bipolar cells arborize, we suspected that ON cone bipolar cells were also stained. A total lack of staining in the PCP2-null retina confirmed specificity of staining and accuracy of the genetic perturbation targeting the Pcp2 locus (Fig. 2F).
To test PCP2 expression in cone bipolar cells, we used a transgenic retina, in which all ON bipolar cells expressed enhanced green fluorescent protein (EGFP) (Morgan et al., 2006; Dhingra et al., 2008). We then marked rod bipolar cells by staining for PKCα (Haverkamp and Wässle, 2000) and stained for PCP2. As expected, PCP2 staining was found in all PKC-positive cells. It was also found in PKC-negative EGFP-positive somas, confirming PCP2 staining of ON cone bipolar cells. However, there were some EGFP-positive cells that lacked PCP2 staining (Fig. 3A-D, outlined). These PCP2-negative ON cone bipolar axon terminals stratified mainly at 60-80% (corresponding to stratum 4) of the inner plexiform layer, although scattered PCP2-negative axons were also seen in stratum 3 (Fig. 3E-H). To further test PCP2 expression in specific types of ON cone bipolar cells, we stained the retinas of GUS8.4-GFP transgenic mice, in which type 7 cone bipolar cells and certain rod bipolar cells express GFP (Huang et al., 2003; Ghosh et al., 2004). In the inner nuclear layer, many GFP-positive somas stained for PCP2 and are presumably rod bipolar cells, whereas others stained weakly or not at all (Fig. 3I-K). In the inner plexiform layer, GFP was present in two strata. In stratum 5, a subset of bipolar cell axon terminals that faintly expressed GFP, probably representing rod bipolar terminals, were positive for PCP2. In stratum 4, GFP-positive terminals, probably type 7 cone bipolar terminals, were mostly PCP2-negative, suggesting that these cells hardly express PCP2.
Figure 3.
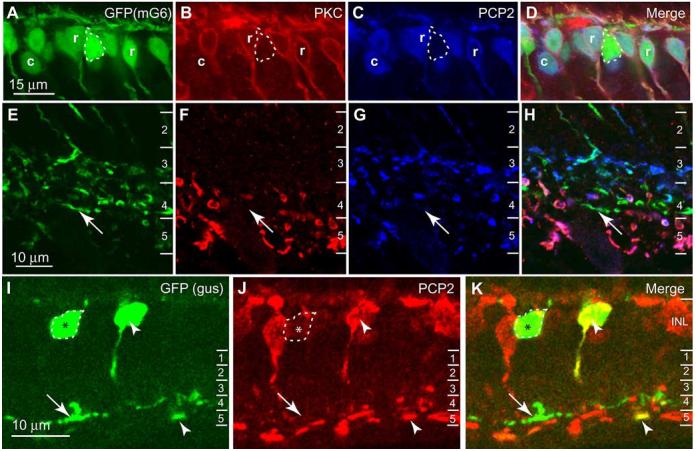
PCP2 is localized to most, but not all, types of ON bipolar cells. A-H, Staining for PKC and PCP2 in transgenic mouse retina that expresses EGFP in all ON bipolar cells. A-D, Inner nuclear layer (INL). PCP2 is expressed by rod bipolar cells (PKC-positive) (r) and certain types of ON cone bipolar cells (EGFP-positive and PKC-negative) (c). Other cone bipolar cells (strongly expressing EGFP) were negative for PCP2 (outlined). E-H, Inner plexiform layer (IPL). ON bipolar cells stratifying at 60-80% (stratum 4) of the inner plexiform layer were unlabeled for PCP2 (arrows). The numbers to the right designate strata in this layer. I-K, Staining for PCP2 in GUS8.4-GFP transgenic retina that expresses GFP in type 7 ON cone bipolar cells and also some, but not all, rod bipolar cells. In the INL, certain GFP-positive cells were PCP2-positive (arrowhead). In the IPL, some GFP-positive processes, mainly in stratum 5 and thus probably rod bipolar processes, were PCP2-positive (arrowhead). Other somas in the INL stained weakly or negatively for PCP2 (outlined and marked with an asterisk), and these gave rise to GFP-positive PCP2-negative processes in stratum 4 of the IPL (arrows). These are type 7 cone bipolar cells.
PCP2 speeds up the termination of the light response (ERG)
To study the function of PCP2, we first compared the ERGs of six wild-type mice and six mice lacking PCP2 under dark-adapted conditions. Low-intensity light flashes (10 ms) in the scotopic range produced ERGs that showed no significant difference between the wild-type and the null mice. Stronger flashes produced ERGs with a clear negative a-wave followed by a positive b-wave (Fig. 4). For two light intensities, 31 R*/rod and 10,000 R*/rod, the average amplitude of the a- and b-waves, and the time from stimulus onset to the peaks of the a- and b-waves were similar between the null and wild-type mice (Table 1).
Table 1.
ERG parameters of wild-type and PCP2-null mice
| 31 R*/rod |
10,000 R*/rod |
|||
|---|---|---|---|---|
| Wild type | PCP2-null | Wild type | PCP2-null | |
| Average and SEM of ERG wave amplitudes and times to peak in response to light flashes of two intensities under dark-adapted conditions. Amplitude of a-wave peak is measured from the baseline to the peak, and b-wave amplitude is measured from a-wave peak to b-wave peak. | ||||
| p > 0.15 for b-wave peakamplitude comparison; p > 0.5 for the rest of the parameters. | ||||
| a-wave peak (μV) | 32.1 ± 4.5 | 36.6 ± 4.4 | 417.6 ± 51.5 | 445.2 ± 24.8 |
| b-wave peak (μV) | 325.4 ± 28.7 | 354.2 ± 13.3 | 667.0 ± 83.5 | 26.5 ± 0.2 |
| Time to a-wave peak (ms) | 23.4 ± 0.7 | 23.0 ± 0.4 | 6.4 ± 0.2 | 65.2 ± 1.7 |
| Time to b-wave peak (ms) | 56.2 ± 3.2 | 54.6 ± 2.7 | 62.4 ±1.9 | 65.2 ± 1.7 |
However, the decaying phase of the b-wave at photopic range (∼31 R*/rod) showed a difference between the two groups of mice. This decay appeared to have two phases [Green et al., (2004), their Fig. 3B,D; Saszik et al., (2002), their Fig. 1]. The initial fast decay phase was similar in the two groups, but the following slower phase decayed faster in the wild-type mice. The difference between the two traces lasted between 150 and 330 ms after light onset. Incidentally, this is when the light response in whole-cell recording starts to fall (see Fig. 6). To quantify this decay, we measured the b-wave amplitude at 150 ms after the peak (∼210 ms after light onset). In wild type, this amplitude decayed by 90 ± 1% of the peak (where 100% is peak to baseline), whereas in null mice, it only decayed by 81 ± 2% (Mann-Whitney test, p < 0.001) (Fig. 4B,C). Because the b-wave of the ERG originates from ON bipolar cells (Robson and Frishman, 1995; Wurziger et al., 2001), our data suggest that PCP2 hastens the light response in these cells, although it may also reflect activity in the postsynaptic cells (Saszik et al., 2002). The primary effect is most likely in the rod bipolar cell and not presynaptic to it because PCP2 is localized solely to ON bipolar cells.
Figure 6.

PCP2 accelerates the light response of rod bipolar cells at different light intensities. A, Averages of normalized responses of bipolar cells (number given by n) to two light intensities (indicated above the traces in log photons μm−2) under current clamp (CC)(left) and voltage clamp (VC) (right). The responses of the wild-type bipolar cells (blacktraces) decay faster than those of the null cells (gray traces), with a more pronounced effect at the saturating intensity. B-D, Data were quantified from current-clamp (left) and voltage-clamp (right) experiments; data were significantly different between WT and KO (ANOVA). The asterisks indicated a significant difference between wild-type and PCP2-null cells at a particular intensity (Student's t test; *p < 0.05, **p < 0.005). B, The time between stimulus onset and response peak (time to peak) tended to be shorter for wild-type than for null cells. The difference was significant when measured with voltage clamp (right; p < 0.005). C, The decay time from 90 to 10% of the peak was shorter for wild-type than for null cells under both current clamp and voltage clamp (p < 0.01). D, The half-width of the peak was significantly shorter for wild-type than PCP2-null cells at most light intensities (p<0.001 for both current clamp and voltage clamp). Error bars indicate SEM.
To ensure that photoreceptor activity is normal in null mice, we examined the a-wave of both mouse groups quantitatively by computing the amplification constant A. This constant provides a measure of the gain of the photoreceptor transduction cascade that is independent of light intensity for low-to-moderate intensities (Lyubarsky and Pugh, 1996). The amplification constant A was computed by fitting the a-wave component of three flash intensities (870, 1800, and 3600 R*/rod) to Equation 1 (Fig. 4E, dotted line). The amplification constant A of the wild type (6.0 ± 0.1 s−2; n = 3 animals) was similar to that of the null mice (6.3 ± 0.8 s−2; n = 3; p > 0.5), confirming that PCP2 deletion did not affect the photoreceptor transduction cascade.
PCP2 modulates the resting membrane potential of the rod bipolar cell
To further investigate PCP2 function, we performed whole-cell patch recordings on rod bipolar cells in slices of dark-adapted mouse retina. Under current-clamp mode with K+ gluconate in the pipette solution, the dark resting membrane potential (Vrest) of these cells in wild type (40 cells; seven mice) averaged at Vrest = −46 ± 3 mV, whereas that in PCP2-null rod bipolar cells (40 cells; eight mice) was more depolarized at −37 ± 3 mV (Fig. 5A,C)(p < 0.02). This predicts that a cell clamped at −60 mV will require more holding current in the null mouse than in the wild type, and indeed, this is what we found (−26 ± 6 pA for wild type, n = 41, vs − 45 ± 6 pA for null, n = 43) (Fig. 5E) (p < 0.02).
In darkness, at a clamping potential that is near ECl, the inward holding current represents contributions from cations flowing inward through the transduction channel and K+ ions flowing outward through the potassium channels. Thus, the increase in inward current seen in the knock-out mouse could result either from opening of cation channels or from closing of potassium channels. To distinguish between these possibilities, we measured the SD of the holding current when the cells were voltage clamped at −60 mV in darkness. We expect that opening of cation channels should show higher noise (Ashmore and Falk, 1982), whereas closing of potassium channels should show lower noise. The current noise was significantly larger in the null mouse than in the wild type (9.2 ± 0.6 vs 7.0 ± 0.6 pA; t test, p < 0.01). This suggests that PCP2 deletion rendered more cation channels open and that the greater hyperpolarization seen in wild-type mice is attributable to Ret-PCP2 augmenting the glutamate effect to close the channel.
Next, we wanted to examine the effect of PCP2 on the light response of rod bipolar cells. To chose appropriate light stimuli, in preliminary experiments we stimulated with different light durations. We found that prolonged stimulation greatly slowed down the decay phase (data not shown). To avoid this effect, we chose a short flash of 10 ms, the same stimulus length used for the ERG recordings. We stimulated the photoreceptors with light intensities that ranged from 47 photons · μm−2 · flash−1 (bright enough to elicit a response in most cells; equivalent to 0.75 R*/rod) to 710 photons/μm2 (bright enough to evoke robust saturated responses in all cells). As others have observed, stronger stimuli gave longer responses (Euler and Masland, 2000; Field and Rieke, 2002; Berntson et al., 2004). At high light intensities, the peak voltage amplitudes in wild-type and null mice were similar, but at low intensities, the amplitudes in the null mice tended to be larger (Fig. 5D). The difference was more obvious in voltage-clamp mode in which the peak current amplitude at the lowest intensity was 52% larger in the null mouse (p < 0.05, t test); differences at other intensities were insignificant (p > 0.1) (Fig. 5F).
PCP2 accelerates the light response of the rod bipolar cell
At all light intensities, bipolar cell responses exhibited longer rise and decay times in null mice than in wild type, a difference that was more pronounced at the saturated intensities (Figs. 5A, B, 6). The time to peak tended to be longer in null mice with a difference that was significant under voltage clamp at the highest intensity (28% longer under current clamp, p = 0.06; 33% under voltage clamp, p < 0.005) (Fig. 6B). The decay time (measured as the time the response falls from 90 to 10% of the peak amplitude) was also significantly longer in null mice (28-45% longer under current clamp and 25-46% longer under voltage clamp) (Fig. 6C)(p < 0.01), and so was the half-width time of the light response. In current clamp, different light intensities produced responses whose half-width was 40-48% longer in null mice (p < 0.001); in voltage clamp, the half-widths were 34-53% longer (p < 0.001) (Fig. 6D). Similar results were obtained in initial experiments when we used Cs+ rather than K+ in the recording pipette to reduce K+ channel current. Compared with the rod bipolar cells in wild type (15 cells; six mice), the null cells (14 cells; five mice) exhibited 20% longer time to peak and 20% longer decay time for both current and voltage clamp. Thus, PCP2 deletion slowed down the light response of rod bipolar cells.
PCP2 accelerates the rising phase of light-evoked excitatory current
Inhibitory feedback on bipolar cells is known to accelerate the falling phase of the light response (Zhang et al., 1997; Dong and Werblin, 1998; Dong and Hare, 2002). To see whether the effects of Ret-PCP2 are attributable to direct effect on the excitatory current or to interference with the inhibitory current, we blocked all chloride currents by adding 100 μM picrotoxin and 2 μM strychnine to the bath and measured the light-evoked excitatory current under voltage-clamp mode. A total of 31 cells from five wild-type and 24 cells from four PCP2-null mice were recorded. Similar to experiments in Ames solution, the holding current in the dark at −60 mV was significantly greater in PCP2-null (−13.2 ± 3.2 pA; n = 24) than in wild-type mice (−3.0 ± 3.6 pA; n = 31; p < 0.05). Also similar to Ames, the rise time of the response was slower in PCP2-null mouse with time to peak being 20-44% longer than in the wild type (p < 0.02) (Fig. 7). The half-maximum width was 10% shorter in the wild-type than in the PCP2-null mouse. Although the decay time of the wild-type was similar to that of the null mouse (p > 0.6), the shape of the peak consistently looked different. Both in Ames and under Cl− current blockers, the wild-type response had a sharp peak, whereas that of the null mouse was broader (Fig. 7B).
Figure 7.

PCP2 accelerates the rising phase of light response of rod bipolar cells under strychnine and picrotoxin. A, Average current responses to a saturating flash intensity of 2.9 log photons μm−2. The average holding current of the null cells was ∼10 pA larger than that of wild type (p<0.05). VC, Voltage clamp. B, An expanded peak response showing the wild-type peak to be sharper than that of knock-out mouse both under Ames and under strychnine (Stry) and picrotoxin (PTX). The arrows point to the difference in the peak response. C, The time between stimulus onset and response peak (time to peak) was significantly shorter for wild-type than for null cells (Student's t test, *p < 0.05). Error bars indicate SEM.
Discussion
We demonstrate here that retinal PCP2 (Ret-PCP2) is a new splice variant expressed not only in rod bipolar cells but also in several types of ON-cone bipolar cell. We show that Ret-PCP2 hyperpolarizes the dark membrane potential of the rod bipolar cell and speeds up its light response.
Retina expresses a new splice variant of PCP2
Two splice variants of PCP2 have been reported in cerebellum with two alternative first exons (Zhang et al., 2002). The short isoform of PCP2, form A, contains an untranslated exon 1A and a translation initiation site in exon 2; this encodes a protein that contains a single GoLoco motif. The long isoform, form B, contains exon 1B, which contributes a different initiation codon and permits exon 2 to be translated and code for an additional GoLoco motif in tandem with the first. Here, we show that sequence immediately upstream of exon 1A contains a new exon (1ret) that is followed by exons 2-4 to yield Ret-PCP2. Ret-PCP2 contains two GoLoco motifs, similar to the cerebellar form B, but it codes for an additional 16 aa at the N terminus. The functional differences between the splice variants are unknown, partly because the function of PCP2 itself is unknown. It has been hypothesized that form B functions in synaptogenesis and dendritic growth because during this phase of development (postnatal day 21) its mRNA in Purkinje cells is more abundant than that of form A (Zhang et al., 2002). However, because our data suggest that the adult cerebellum expresses only form B (Fig. 2), we question whether mRNA expression is a good indicator of the expression of this protein.
Function of Ret-PCP2 in rod bipolar cells
The first effect of Ret-PCP2 is to decrease inward current and hyperpolarize the dark membrane potential, suggesting that PCP2 facilitates closure of the light-modulated channels during darkness. This interpretation was further supported by noise analysis. By enhancing hyperpolarization, Ret-PCP2 increases the driving force of the conducting cations, and this can increase the dynamic range of the rod bipolar cell.
The second effect was to speed up the light response. This result was obtained both noninvasively by ERG and by whole-cell recordings. Using whole-cell recordings, a faster rising time in wild type was obtained under all testing conditions. The flash response of the rod bipolar cell is known to be faster than that of the rod (Robson and Frishman, 1995; Field et al., 2005; Okawa and Sampath, 2007). Several mechanisms, both presynaptic (Armstrong-Gold and Rieke, 2003) and postsynaptic, contribute to this quickening. Within the postsynaptic mechanisms, the rising phase of the light response could be accelerated by the GTPase activity of a regulator of G-protein signaling (RGS) such as Ret-RGS1 or RGS7 (Dhingra et al., 2004; Morgans et al., 2007; Rao et al., 2007). We showed here that the rising time is also accelerated by PCP2. Because in both retina and Purkinje cells PCP2 is colocalized with Gαo, one might find in Purkinje cells that PCP2 accelerates a response of a colocalized metabotropic receptor.
Function of Ret-PCP2 in ON cone bipolar cells
PCP2 has been often used as a marker for rod bipolar cells (Berrebi et al., 1991; Euler and Waässle, 1995; Zhang et al., 2005). Here, we showed that some types of ON cone bipolar cell also express PCP2. This explains why Martin and Grünert (1992), who localized GABA to rod bipolar cells using PCP2 as a marker, found many PCP2-positive bipolar cells that were negative for GABA. It also explains why PCP2-positive rabbit bipolar cells were found to be denser than rod bipolar cells (Berrebi et al., 1991).
The slow G-protein-coupled cascade can present a greater problem for ON cone bipolar cells than for rod bipolar cells because their peer class of bipolar cells, the OFF bipolar cells, express cation channels that are modulated directly, and thus rapidly, by glutamate (Saito and Kaneko, 1983; Attwell et al., 1987; Morigiwa and Vardi, 1999; Haverkamp et al., 2003). It is known that different types of cone bipolar cell code for different temporal frequencies (Awatramani and Slaughter, 2000; Euler and Masland, 2000; Freed, 2000). OFF bipolar cells acquire different temporal responses by expressing different glutamate receptors (AMPA vs kainate) with different kinetics (DeVries, 2000). Unlike OFF bipolar cells, however, all ON bipolar cells express the same receptor (mGluR6) and G-protein (Gαo) (Vardi and Morigiwa, 1997; Vardi et al., 2000; Dhingra et al., 2002). Because Ret-PCP2 was strongly expressed in certain types of ON cone bipolar cells, weakly expressed in other types (e.g., type 7), and absent from others, we hypothesize that differential levels of Ret-PCP2 expression shape the temporal bandwidth of the ON cone bipolar types. Our hypothesis predicts that the type 7 cone bipolar cell, which expresses very little PCP2, would have a relatively slow response and narrow bandwidth, and indeed rat type 7 cells do exhibit a sustained response (Euler and Masland, 2000).
Ret-PCP2 may act as a guanine nucleotide exchange factor
The interaction of Gαi/o with PCP2 and other members of the GoLoco-containing proteins have been studied primarily in vitro in which evidence overwhelmingly suggests that members of this family inhibit dissociation of GDP, and are therefore considered GDIs (Natochin et al., 2001; Kimple et al., 2002; Willard et al., 2004, 2006). Analyzing the mechanism of Ret-PCP2 action in rod bipolar cells is complicated because it is unknown whether the transduction channel is gated by Gα, a second messenger modulated by a Gα effector, or possibly by Gβγ.
Ret-PCP2 had two significant effects on the excitatory current: it hyperpolarized the dark membrane potential and sharpened the response peak. The membrane hyperpolarization results from more closure of cation channels in the presence of Ret-PCP2. The acceleration of time to peak and peak sharpening could also result from the role of Ret-PCP2 in facilitating the glutamate response as soon as synaptic glutamate starts to rise, slightly before the response reaches its peak (Fig. 8). Ret-PCP2 as a GEF would augment the effect of glutamate to activate both Gαo and Gβγ simultaneously, and either of these would close more channels during darkness, and during elevation of glutamate right after its trough.
Figure 8.

Schematic representation of the G-protein cycle and the possible function of PCP2 in modulating the light response in ON bipolar cells. The top trace represents glutamate release over time, and the bottom trace represents voltage response of a rod bipolar cell. The solid arrows denote transition between known steps (which are numbered within mGluR6 circles) in the cascade; the dotted lines denote possible interactions. The asterisk (*) denotes active state of a protein. Steps 1 and 5, In darkness, continuous release of glutamate from photoreceptors activates the mGluR6 receptors located at the dendritic tips of the ON bipolar cells. Activation of mGluR6 leads to an exchange of GDP with GTP on Gαo1 and dissociation of Gβγ from GαGTP. As a result, GαGTP and Gβγ are in their active forms, and either of them can, in principle, lead to closure of an unidentified cation channel and membrane hyperpolarization. Step 2, When light intensity increases, glutamate release decreases, and the intrinsic GAP activity of Gα hydrolyzes GαGTP. This hydrolysis in bipolar cells is likely facilitated by an RGS protein. Step 3, Consequently, [GαGDP] increases and rebinds Gβγ forming the inactive heterotrimer. Thus, channels are allowed to open and the membrane depolarizes. Step 4, When the light is turned off, glutamate release increases again, Gαo1 is reactivated by a GDP to GTP exchange on Gαo1, the channels close, and the light response is terminated. The hyperpolarization by PCP2 (in steps 1 and 5) (i.e., the increase in the fraction of channels closed by glutamate in presence of PCP2) suggests that a larger fraction of the G-protein heterotrimer is active. This may result either by GEF mechanism (activating both Gαo and Gβγ) or a GDI (activating Gβγ by binding GαoGDP). The acceleration of time to peak by PCP2 (transition from steps 2 and 3) may result either from an actual acceleration of the G-protein deactivation or from sharpening the peak. In the first case, acceleration of deactivation may result if PCP2 acts as GDI: by capturing GαoGDP, it may reduce Gαo available for reactivation by residual glutamate. In the second case, the peak may be sharpened by repolarizing as soon as glutamate concentration increases and the G-protein starts to reactivate (transition from steps 3 and 4). This is easiest to explain if PCP2 is a GEF. PCP2 seems to affect the main component of the response decay (transition from steps 4 and 5) not by directly acting on the excitatory current, but via the inhibitory network, which feeds back onto the rod bipolar cell and accelerates the termination of the response.
It is more difficult to explain the effects of Ret-PCP2 if it is a GDI. The hyperpolarization under saturating glutamate can be explained if Gβγ, but not GαGTP, closes the cation transduction channel. This is because Ret-PCP2 would bind GαGDP and thereby free Gβγ (Kimple et al., 2001; Oxford and Webb, 2004; Siderovski and Willard, 2005). Thus, Gα would stay inactive and unable to close the channels, whereas Gβγ would be free to do so and hyperpolarize the cell. The speeding up of the rising time and the peak sharpening might occur if Ret-PCP2 quickly captures the hydrolyzed GαGDP and prevents it from reactivating for as long as glutamate concentration decreases. Then, when glutamate concentration increases again, another GEF, such as RIC-8 (whose transcript is found in ON bipolar cells) (Dhingra et al., 2008), interacts with GαGDP-Ret-PCP2 complex, releases Ret-PCP2, and quickly activates the G-protein (Blumer et al., 2007).
Which explanation is more likely? Injecting Gαo into ON bipolar cells closed cation channels, whereas injecting anti-Gαo opened them (Nawy, 1999). This suggests that Gα GTP closes the channel, because if Gβγ closed the channel, injection of Gαo should have scavenged Gβγ and opened the channels. Hence we favor the simpler explanation that Ret-PCP2 is a GEF. This proposition is in agreement with Luo and Denker (1999) who found that PCP2 facilitated GDP/GTP exchange. Also, when PCP2 was studied in oocytes in which its effect on the k-opioid receptor (which is inhibited by free Gβγ) was tested, low levels of PCP2 enhanced the agonist effect (Kinoshita-Kawada et al., 2004). Although this result was interpreted in terms of GDI activity (releases free Gβγ by binding GαGDP), it can also be explained as GEF activity, because this too would increase free Gβγ.
The effect of Ret-PCP on excitatory current may affect feedback inhibition
Cl− currents in the retinal network have multiple and complex effects on the light response of the bipolar cell (Gottlob et al., 1988; Zhang et al., 1997; Kapousta-Bruneau, 2000; Dong and Hare, 2002; Vigh and von Gersdorff, 2005; Vigh et al., 2005; Eggers and Lukasiewicz, 2006a,b; Molnar and Werblin, 2007; Kupenova et al., 2008), one of which is to accelerate the termination phase of the light response. When tested under Ames alone, Ret-PCP2 facilitated the termination phase of the light response, but this effect was not observed after blocking Cl− currents. This suggests that Ret-PCP2 somehow interacts with Cl− currents to shape the light response. It is not likely that Ret-PCP2 interacts directly with GABAA/C or glycine receptors because it is known to modulate G-proteins and not ionotropic currents. More likely, the accelerated excitatory current in the wild type triggers a faster feedback inhibition, which facilitates the falling phase. This idea is in line with Roska et al. (1998), who demonstrated that the first 150 ms of bipolar cell response excites certain amacrine cells whose response is delayed before they feed back to bipolar cells.
Acknowledgments
This work was supported by National Institutes of Health Grants EY11105 (N.V.), EY016607 (R.G.S.), R29 NS32320 (R.M.F.), and NEI P30 EY01583 (Vision Research Core of the University of Pennsylvania). We thank Josefin Snellman and Scott Nawy for essential help in the initial phase of bipolar cell recording, Marie Fina for excellent technical help, Arkady Lyubarsky for help with ERG recording and analysis, Gui-shuang Ying for help with the statistical analysis, and Robert F. Margolskee for providing GUS8.4-GFP transgenic retinas.
References
- Armstrong-Gold CE, Rieke F. Bandpass filtering at the rod to second-order cell synapse in salamander (Ambystoma tigrinum) retina. J Neurosci. 2003;23:3796–3806. doi: 10.1523/JNEUROSCI.23-09-03796.2003. [DOI] [PMC free article] [PubMed] [Google Scholar]
- Ashmore JF, Falk G. An analysis of voltage noise in rod bipolar cells of the dogfish retina. J Physiol. 1982;332:273–297. doi: 10.1113/jphysiol.1982.sp014413. [DOI] [PMC free article] [PubMed] [Google Scholar]
- Attwell D, Mobbs P, Tessier-Lavigne M, Wilson M. Neurotransmitter-induced currents in retinal bipolar cells of the axolotl, Ambystoma mexicanum. J Physiol. 1987;387:125–161. doi: 10.1113/jphysiol.1987.sp016567. [DOI] [PMC free article] [PubMed] [Google Scholar]
- Awatramani GB, Slaughter MM. Origin of transient and sustained responses in ganglion cells of the retina. J Neurosci. 2000;20:7087–7095. doi: 10.1523/JNEUROSCI.20-18-07087.2000. [DOI] [PMC free article] [PubMed] [Google Scholar]
- Baylor DA, Nunn BJ, Schnapf JL. The photocurrent, noise and spectral sensitivity of rods of the monkey Macaca fascicularis. J Physiol. 1984;357:575–607. doi: 10.1113/jphysiol.1984.sp015518. [DOI] [PMC free article] [PubMed] [Google Scholar]
- Bernard ML, Peterson YK, Chung P, Jourdan J, Lanier SM. Selective interaction of AGS3 with G-proteins and the influence of AGS3 on the activation state of G-proteins. J Biol Chem. 2001;276:1585–1593. doi: 10.1074/jbc.M005291200. [DOI] [PubMed] [Google Scholar]
- Berntson A, Smith RG, Taylor WR. Postsynaptic calcium feedback between rods and rod bipolar cells in the mouse retina. Vis Neurosci. 2004;21:913–924. doi: 10.1017/S095252380421611X. [DOI] [PubMed] [Google Scholar]
- Berrebi AS, Mugnaini E. Characteristics of labeling of the cerebellar Purkinje neuron by L7 antiserum. J Chem Neuroanat. 1992;5:235–243. doi: 10.1016/0891-0618(92)90048-u. [DOI] [PubMed] [Google Scholar]
- Berrebi AS, Oberdick J, Sangameswaran L, Christakos S, Morgan JI, Mugnaini E. Cerebellar Purkinje cell markers are expressed in retinal bipolar neurons. J Comp Neurol. 1991;308:630–649. doi: 10.1002/cne.903080409. [DOI] [PubMed] [Google Scholar]
- Blumer JB, Smrcka AV, Lanier SM. Mechanistic pathways and biological roles for receptor-independent activators of G-protein signaling. Pharmacol Ther. 2007;113:488–506. doi: 10.1016/j.pharmthera.2006.11.001. [DOI] [PMC free article] [PubMed] [Google Scholar]
- Breton ME, Schueller AW, Lamb TD, Pugh EN., Jr Analysis of ERG a-wave amplification and kinetics in terms of the G-protein cascade of phototransduction. Invest Ophthalmol Vis Sci. 1994;35:295–309. [PubMed] [Google Scholar]
- de la Villa P, Kurahashi T, Kaneko A. L-Glutamate-induced responses and cGMP-activated channels in three subtypes of retinal bipolar cells dissociated from the cat. J Neurosci. 1995;15:3571–3582. doi: 10.1523/JNEUROSCI.15-05-03571.1995. [DOI] [PMC free article] [PubMed] [Google Scholar]
- De Vries L, Fischer T, Tronchère H, Brothers GM, Strockbine B, Siderovski DP, Farquhar MG. Activator of G protein signaling 3 is a guanine dissociation inhibitor for Galpha i subunits. Proc Natl Acad Sci U S A. 2000;97:14364–14369. doi: 10.1073/pnas.97.26.14364. [DOI] [PMC free article] [PubMed] [Google Scholar]
- DeVries SH. Bipolar cells use kainate and AMPA receptors to filter visual information into separate channels. Neuron. 2000;28:847–856. doi: 10.1016/s0896-6273(00)00158-6. [DOI] [PubMed] [Google Scholar]
- Dhingra A, Lyubarsky A, Jiang M, Pugh EN, Jr, Birnbaumer L, Sterling P, Vardi N. The light response of ON bipolar neurons requires G[alpha]o. J Neurosci. 2000;20:9053–9058. doi: 10.1523/JNEUROSCI.20-24-09053.2000. [DOI] [PMC free article] [PubMed] [Google Scholar]
- Dhingra A, Jiang M, Wang TL, Lyubarsky A, Savchenko A, Bar-Yehuda T, Sterling P, Birnbaumer L, Vardi N. Light response of retinal ON bipolar cells requires a specific splice variant of Galpha(o) J Neurosci. 2002;22:4878–4884. doi: 10.1523/JNEUROSCI.22-12-04878.2002. [DOI] [PMC free article] [PubMed] [Google Scholar]
- Dhingra A, Faurobert E, Dascal N, Sterling P, Vardi N. A retinal-specific regulator of G-protein signaling interacts with Galpha(o) and accelerates an expressed metabotropic glutamate receptor 6 cascade. J Neurosci. 2004;24:5684–5693. doi: 10.1523/JNEUROSCI.0492-04.2004. [DOI] [PMC free article] [PubMed] [Google Scholar]
- Dhingra A, Sulaiman P, Xu Y, Fina M, Veh R, Vardi N. Probing neurochemical structure and function of retinal ON bipolar cells with a transgenic mouse. J Comp Neurol. 2008;510:484–496. doi: 10.1002/cne.21807. [DOI] [PMC free article] [PubMed] [Google Scholar]
- Dong CJ, Hare WA. GABAc feedback pathway modulates the amplitude and kinetics of ERG b-wave in a mammalian retina in vivo. Vision Res. 2002;42:1081–1087. doi: 10.1016/s0042-6989(02)00032-9. [DOI] [PubMed] [Google Scholar]
- Dong CJ, Werblin FS. Temporal contrast enhancement via GABAC feedback at bipolar terminals in the tiger salamander retina. J Neurophysiol. 1998;79:2171–2180. doi: 10.1152/jn.1998.79.4.2171. [DOI] [PubMed] [Google Scholar]
- Eggers ED, Lukasiewicz PD. GABAA, GABAC and glycine receptor-mediated inhibition differentially affects light-evoked signalling from mouse retinal rod bipolar cells. J Physiol. 2006a;572:215–225. doi: 10.1113/jphysiol.2005.103648. [DOI] [PMC free article] [PubMed] [Google Scholar]
- Eggers ED, Lukasiewicz PD. Receptor and transmitter release properties set the time course of retinal inhibition. J Neurosci. 2006b;26:9413–9425. doi: 10.1523/JNEUROSCI.2591-06.2006. [DOI] [PMC free article] [PubMed] [Google Scholar]
- Euler T, Masland RH. Light-evoked responses of bipolar cells in a mammalian retina. J Neurophysiol. 2000;83:1817–1829. doi: 10.1152/jn.2000.83.4.1817. [DOI] [PubMed] [Google Scholar]
- Euler T, Waässle H. Immunocytochemical identification of cone bipolar cells in the rat retina. J Comp Neurol. 1995;361:461–478. doi: 10.1002/cne.903610310. [DOI] [PubMed] [Google Scholar]
- Field GD, Rieke F. Nonlinear signal transfer from mouse rods to bipolar cells and implications for visual sensitivity. Neuron. 2002;34:773–785. doi: 10.1016/s0896-6273(02)00700-6. [DOI] [PubMed] [Google Scholar]
- Field GD, Sampath AP, Rieke F. Retinal processing near absolute threshold: from behavior to mechanism. Annu Rev Physiol. 2005;67:491–514. doi: 10.1146/annurev.physiol.67.031103.151256. [DOI] [PubMed] [Google Scholar]
- Freed MA. Parallel cone bipolar pathways to a ganglion cell use different rates and amplitudes of quantal excitation. J Neurosci. 2000;20:3956–3963. doi: 10.1523/JNEUROSCI.20-11-03956.2000. [DOI] [PMC free article] [PubMed] [Google Scholar]
- Ghosh KK, Bujan S, Haverkamp S, Feigenspan A, Wässle H. Types of bipolar cells in the mouse retina. J Comp Neurol. 2004;469:70–82. doi: 10.1002/cne.10985. [DOI] [PubMed] [Google Scholar]
- Gottlob I, Wündsch L, Tuppy FK. The rabbit electroretinogram: effect of GABA and its antagonists. Vision Res. 1988;28:203–210. doi: 10.1016/0042-6989(88)90147-2. [DOI] [PubMed] [Google Scholar]
- Green DG, Guo H, Pillers DA. Normal photoresponses and altered b-wave responses to APB in the mdx(Cv3) mouse isolated retina ERG supports role for dystrophin in synaptic transmission. Vis Neurosci. 2004;21:739–747. doi: 10.1017/S0952523804215085. [DOI] [PMC free article] [PubMed] [Google Scholar]
- Guan J, Luo Y, Denker BM. Purkinje cell protein-2 (Pcp2) stimulates differentiation in PC12 cells by Gbetagamma-mediated activation of Ras and p38 MAPK. Biochem J. 2005;392:389–397. doi: 10.1042/BJ20042102. [DOI] [PMC free article] [PubMed] [Google Scholar]
- Haverkamp S, Wässle H. Immunocytochemical analysis of the mouse retina. J Comp Neurol. 2000;424:1–23. [PubMed] [Google Scholar]
- Haverkamp S, Ghosh KK, Hirano AA, Wässle H. Immunocytochemical description of five bipolar cell types of the mouse retina. J Comp Neurol. 2003;455:463–476. doi: 10.1002/cne.10491. [DOI] [PMC free article] [PubMed] [Google Scholar]
- Huang L, Max M, Margolskee RF, Su H, Masland RH, Euler T. G protein subunit G gamma 13 is coexpressed with G alpha o, G beta 3, and G beta 4 in retinal ON bipolar cells. J Comp Neurol. 2003;455:1–10. doi: 10.1002/cne.10396. [DOI] [PubMed] [Google Scholar]
- Kapousta-Bruneau NV. Opposite effects of GABAA and GABAC receptor antagonists on the b-wave of ERG recorded from the isolated rat retina. Vision Res. 2000;40:1653–1665. doi: 10.1016/s0042-6989(00)00028-6. [DOI] [PubMed] [Google Scholar]
- Kimple RJ, De Vries L, Tronchère H, Behe CI, Morris RA, Gist Farquhar M, Siderovski DP. RGS12 and RGS14 GoLoco motifs are G alpha(i) interaction sites with guanine nucleotide dissociation inhibitor activity. J Biol Chem. 2001;276:29275–29281. doi: 10.1074/jbc.M103208200. [DOI] [PubMed] [Google Scholar]
- Kimple RJ, Kimple ME, Betts L, Sondek J, Siderovski DP. Structural determinants for GoLoco-induced inhibition of nucleotide release by Galpha subunits. Nature. 2002;416:878–881. doi: 10.1038/416878a. [DOI] [PubMed] [Google Scholar]
- Kinoshita-Kawada M, Oberdick J, Xi Zhu M. A Purkinje cell specific GoLoco domain protein, L7/Pcp-2, modulates receptor-mediated inhibition of Cav2.1 Ca 2+ channels in a dose-dependent manner. Brain Res Mol Brain Res. 2004;132:73–86. doi: 10.1016/j.molbrainres.2004.09.007. [DOI] [PubMed] [Google Scholar]
- Kupenova P, Popova E, Vitanova L. GABAa and GABAc receptor mediated influences on the intensity-response functions of the b-and d-wave in the frog ERG. Vision Res. 2008;48:882–892. doi: 10.1016/j.visres.2008.01.003. [DOI] [PubMed] [Google Scholar]
- Lamb TD. Photoreceptor spectral sensitivities: common shape in the long-wavelength region. Vision Res. 1995;35:3083–3091. doi: 10.1016/0042-6989(95)00114-f. [DOI] [PubMed] [Google Scholar]
- Luo Y, Denker BM. Interaction of heterotrimeric G protein Galphao with Purkinje cell protein-2. Evidence for a novel nucleotide exchange factor. J Biol Chem. 1999;274:10685–10688. doi: 10.1074/jbc.274.16.10685. [DOI] [PubMed] [Google Scholar]
- Lyubarsky AL, Pugh EN., Jr Recovery phase of the murine rod photo-response reconstructed from electroretinographic recordings. J Neurosci. 1996;16:563–571. doi: 10.1523/JNEUROSCI.16-02-00563.1996. [DOI] [PMC free article] [PubMed] [Google Scholar]
- Lyubarsky AL, Falsini B, Pennesi ME, Valentini P, Pugh EN., Jr UV-and midwave-sensitive cone-driven retinal responses of the mouse: a possible phenotype for coexpression of cone photopigments. J Neurosci. 1999;19:442–455. doi: 10.1523/JNEUROSCI.19-01-00442.1999. [DOI] [PMC free article] [PubMed] [Google Scholar]
- Lyubarsky AL, Chen C, Simon MI, Pugh EN., Jr Mice lacking G-protein receptor kinase 1 have profoundly slowed recovery of cone-driven retinal responses. J Neurosci. 2000;20:2209–2217. doi: 10.1523/JNEUROSCI.20-06-02209.2000. [DOI] [PMC free article] [PubMed] [Google Scholar]
- Lyubarsky AL, Daniele LL, Pugh EN., Jr From candelas to photoisomerizations in the mouse eye by rhodopsin bleaching in situ and the light-rearing dependence of the major components of the mouse ERG. Vision Res. 2004;44:3235–3251. doi: 10.1016/j.visres.2004.09.019. [DOI] [PubMed] [Google Scholar]
- Martin PR, Grünert U. Spatial density and immunoreactivity of bipolar cells in the macaque monkey retina. J Comp Neurol. 1992;323:269–287. doi: 10.1002/cne.903230210. [DOI] [PubMed] [Google Scholar]
- Mohn AR, Feddersen RM, Nguyen MS, Koller BH. Phenotypic analysis of mice lacking the highly abundant Purkinje cell- and bipolar neuron-specific PCP2 protein. Mol Cell Neurosci. 1997;9:63–76. doi: 10.1006/mcne.1997.0606. [DOI] [PubMed] [Google Scholar]
- Molnar A, Werblin F. Inhibitory feedback shapes bipolar cell responses in the rabbit retina. J Neurophysiol. 2007;98:3423–3435. doi: 10.1152/jn.00838.2007. [DOI] [PubMed] [Google Scholar]
- Morgan JL, Dhingra A, Vardi N, Wong RO. Axons and dendrites originate from neuroepithelial-like processes of retinal bipolar cells. Nat Neurosci. 2006;9:85–92. doi: 10.1038/nn1615. [DOI] [PubMed] [Google Scholar]
- Morgans CW, Wensel TG, Brown RL, Perez-Leon JA, Bearnot B, Duvoisin RM. Gbeta5-RGS complexes co-localize with mGluR6 in retinal ON-bipolar cells. Eur J Neurosci. 2007;26:2899–2905. doi: 10.1111/j.1460-9568.2007.05867.x. [DOI] [PMC free article] [PubMed] [Google Scholar]
- Morigiwa K, Vardi N. Differential expression of ionotropic gluta-mate receptor subunits in the outer retina. J Comp Neurol. 1999;405:173–184. doi: 10.1002/(sici)1096-9861(19990308)405:2<173::aid-cne3>3.0.co;2-l. [DOI] [PubMed] [Google Scholar]
- Natochin M, Gasimov KG, Artemyev NO. Inhibition of GDP/GTP exchange on G alpha subunits by proteins containing G-protein regulatory motifs. Biochemistry. 2001;40:5322–5328. doi: 10.1021/bi015505w. [DOI] [PubMed] [Google Scholar]
- Natochin M, Gasimov KG, Artemyev NO. A GPR-protein interaction surface of Gi(alpha): implications for the mechanism of GDP-release inhibition. Biochemistry. 2002;41:258–265. doi: 10.1021/bi015708k. [DOI] [PubMed] [Google Scholar]
- Nawy S. The metabotropic receptor mGluR6 may signal through G(o), but not phosphodiesterase, in retinal bipolar cells. J Neurosci. 1999;19:2938–2944. doi: 10.1523/JNEUROSCI.19-08-02938.1999. [DOI] [PMC free article] [PubMed] [Google Scholar]
- Nawy S, Jahr CE. Suppression by glutamate of cGMP-activated conductance in retinal bipolar cells. Nature. 1990;346:269–271. doi: 10.1038/346269a0. [DOI] [PubMed] [Google Scholar]
- Neer EJ. G proteins: critical control points for transmembrane signals. Protein Sci. 1994;3:3–14. doi: 10.1002/pro.5560030102. [DOI] [PMC free article] [PubMed] [Google Scholar]
- Nordquist DT, Kozak CA, Orr HT. cDNA cloning and characterization of three genes uniquely expressed in cerebellum by Purkinje neurons. J Neurosci. 1988;8:4780–4789. doi: 10.1523/JNEUROSCI.08-12-04780.1988. [DOI] [PMC free article] [PubMed] [Google Scholar]
- Ogura T, Margolskee RF, Kinnamon SC. Taste receptor cell responses to the bitter stimulus denatonium involve Ca 2+ influx via store-operated channels. J Neurophysiol. 2002;87:3152–3155. doi: 10.1152/jn.2002.87.6.3152. [DOI] [PubMed] [Google Scholar]
- Okawa H, Sampath AP. Optimization of single-photon response transmission at the rod-to-rod bipolar synapse. Physiology (Bethesda) 2007;22:279–286. doi: 10.1152/physiol.00007.2007. [DOI] [PubMed] [Google Scholar]
- Oxford GS, Webb CK. GoLoco motif peptides as probes of Galpha subunit specificity in coupling of G-protein-coupled receptors to ion channels. Methods Enzymol. 2004;390:437–450. doi: 10.1016/S0076-6879(04)90027-4. [DOI] [PubMed] [Google Scholar]
- Peterson YK, Bernard ML, Ma H, Hazard S, 3rd, Graber SG, Lanier SM. Stabilization of the GDP-bound conformation of Gialpha by a peptide derived from the G-protein regulatory motif of AGS3. J Biol Chem. 2000;275:33193–33196. doi: 10.1074/jbc.C000509200. [DOI] [PubMed] [Google Scholar]
- Pierce KL, Premont RT, Lefkowitz RJ. Seven-transmembrane receptors. Nat Rev Mol Cell Biol. 2002;3:639–650. doi: 10.1038/nrm908. [DOI] [PubMed] [Google Scholar]
- Rao A, Dallman R, Henderson S, Chen CK. Gbeta5 is required for normal light responses and morphology of retinal ON-bipolar cells. J Neurosci. 2007;27:14199–14204. doi: 10.1523/JNEUROSCI.4934-07.2007. [DOI] [PMC free article] [PubMed] [Google Scholar]
- Redd KJ, Oberdick J, McCoy J, Denker BM, Luo Y. Association and colocalization of G protein alpha subunits and Purkinje cell protein 2 (Pcp2) in mammalian cerebellum. J Neurosci Res. 2002;70:631–637. doi: 10.1002/jnr.10460. [DOI] [PubMed] [Google Scholar]
- Robson JG, Frishman LJ. Response linearity and kinetics of the cat retina: the bipolar cell component of the dark-adapted electroretinogram. Vis Neurosci. 1995;12:837–850. doi: 10.1017/s0952523800009408. [DOI] [PubMed] [Google Scholar]
- Roska B, Nemeth E, Werblin FS. Response to change is facilitated by a three-neuron disinhibitory pathway in the tiger salamander retina. J Neurosci. 1998;18:3451–3459. doi: 10.1523/JNEUROSCI.18-09-03451.1998. [DOI] [PMC free article] [PubMed] [Google Scholar]
- Saito T, Kaneko A. Ionic mechanisms underlying the responses of off-center bipolar cells in the carp retina. I. Studies on responses evoked by light. J Gen Physiol. 1983;81:589–601. doi: 10.1085/jgp.81.4.589. [DOI] [PMC free article] [PubMed] [Google Scholar]
- Saszik SM, Robson JG, Frishman LJ. The scotopic threshold response of the dark-adapted electroretinogram of the mouse. J Physiol. 2002;543:899–916. doi: 10.1113/jphysiol.2002.019703. [DOI] [PMC free article] [PubMed] [Google Scholar]
- Shiells RA, Falk G. Glutamate receptors of rod bipolar cells are linked to a cyclic GMP cascade via a G-protein. Proc Biol Sci. 1990;242:91–94. doi: 10.1098/rspb.1990.0109. [DOI] [PubMed] [Google Scholar]
- Siderovski DP, Willard FS. The GAPs, GEFs, and GDIs of heterotrimeric G-protein alpha subunits. Int J Biol Sci. 2005;1:51–66. doi: 10.7150/ijbs.1.51. [DOI] [PMC free article] [PubMed] [Google Scholar]
- Vandaele S, Nordquist DT, Feddersen RM, Tretjakoff I, Peterson AC, Orr HT. Purkinje cell protein-2 regulatory regions and transgene expression in cerebellar compartments. Genes Dev. 1991;5:1136–1148. doi: 10.1101/gad.5.7.1136. [DOI] [PubMed] [Google Scholar]
- Vardi N, Morigiwa K. ON cone bipolar cells in rat express the metabotropic receptor mGluR6. Vis Neurosci. 1997;14:789–794. doi: 10.1017/s0952523800012736. [DOI] [PubMed] [Google Scholar]
- Vardi N, Duvoisin R, Wu G, Sterling P. Localization of mGluR6 to dendrites of ON bipolar cells in primate retina. J Comp Neurol. 2000;423:402–412. doi: 10.1002/1096-9861(20000731)423:3<402::aid-cne4>3.0.co;2-e. [DOI] [PubMed] [Google Scholar]
- Vassileva G, Smeyne RJ, Morgan JI. Absence of neuroanatomical and behavioral deficits in L7/pcp-2-null mice. Brain Res Mol Brain Res. 1997;46:333–337. doi: 10.1016/s0169-328x(97)00081-8. [DOI] [PubMed] [Google Scholar]
- Vigh J, von Gersdorff H. Prolonged reciprocal signaling via NMDA and GABA receptors at a retinal ribbon synapse. J Neurosci. 2005;25:11412–11423. doi: 10.1523/JNEUROSCI.2203-05.2005. [DOI] [PMC free article] [PubMed] [Google Scholar]
- Vigh J, Li GL, Hull C, von Gersdorff H. Long-term plasticity mediated by mGluR1 at a retinal reciprocal synapse. Neuron. 2005;46:469–482. doi: 10.1016/j.neuron.2005.03.027. [DOI] [PMC free article] [PubMed] [Google Scholar]
- Willard FS, Kimple RJ, Siderovski DP. Return of the GDI: the GoLoco motif in cell division. Annu Rev Biochem. 2004;73:925–951. doi: 10.1146/annurev.biochem.73.011303.073756. [DOI] [PubMed] [Google Scholar]
- Willard FS, McCudden CR, Siderovski DP. G-protein alpha subunit interaction and guanine nucleotide dissociation inhibitor activity of the dual GoLoco motif protein PCP-2 (Purkinje cell protein-2) Cell Signal. 2006;18:1226–1234. doi: 10.1016/j.cellsig.2005.10.003. [DOI] [PubMed] [Google Scholar]
- Wong GT, Ruiz-Avila L, Margolskee RF. Directing gene expression to gustducin-positive taste receptor cells. J Neurosci. 1999;19:5802–5809. doi: 10.1523/JNEUROSCI.19-14-05802.1999. [DOI] [PMC free article] [PubMed] [Google Scholar]
- Wurziger K, Lichtenberger T, Hanitzsch R. On-bipolar cells and depolarising third-order neurons as the origin of the ERG-b-wave in the RCS rat. Vision Res. 2001;41:1091–1101. doi: 10.1016/s0042-6989(01)00026-8. [DOI] [PubMed] [Google Scholar]
- Zhang J, Jung CS, Slaughter MM. Serial inhibitory synapses in retina. Vis Neurosci. 1997;14:553–563. doi: 10.1017/s0952523800012219. [DOI] [PubMed] [Google Scholar]
- Zhang X, Zhang H, Oberdick J. Conservation of the developmentally regulated dendritic localization of a Purkinje cell-specific mRNA that encodes a G-protein modulator: comparison of rodent and human Pcp2(L7) gene structure and expression. Brain Res Mol Brain Res. 2002;105:1–10. doi: 10.1016/s0169-328x(02)00379-0. [DOI] [PubMed] [Google Scholar]
- Zhang XM, Chen BY, Ng AH, Tanner JA, Tay D, So KF, Rachel RA, Copeland NG, Jenkins NA, Huang JD. Transgenic mice expressing Crerecombinase specifically in retinal rod bipolar neurons. Invest Ophthalmol Vis Sci. 2005;46:3515–3520. doi: 10.1167/iovs.04-1201. [DOI] [PubMed] [Google Scholar]