

Abstract
Alcohol dependence (AD) is suggested to have polygenic risk factors and also exhibits neurological complications, strongly encouraging a translational study to explore the associations between aggregates of genetic variants and brain function alterations related to alcohol use. In this study, we used a semiblind multivariate approach, parallel independent component analysis with multiple references (pICA-MR) to investigate relationships of genome-wide single nucleotide polymorphisms (SNPs) with alcohol cue elicited brain activations in 326 healthy drinkers. The genetic component derived from the CREB-BDNF pathway reference was significantly associated (r = −0.36, p = 2.98×10⁻¹¹) with an imaging component reflecting hyperactivation in precuneus, superior parietal lobule, and posterior cingulate for drinkers with more severe AD scores. The highlighted brain regions participate in many cognitive processes and have been robustly implicated in craving-related studies. The genetic factor highlighted the CREB and BDNF references, as well as other genes including GRM5, GRM7, GRID1, GRIN2A, PRKCA and PRKCB. Ingenuity Pathway Analysis indicated that the genetic component was enriched in synaptic plasticity, GABA and protein kinase A signaling. In summary, our findings suggest genetic variations in various neural plasticity and signaling pathways partially explain the variance of precuneus reactivity to alcohol cue which appears to be associated with AD severity.
Introduction
Alcohol dependence (AD) presents a substantial health and economic issue, with an estimated lifetime prevalence of 3.8% to 13.3% (Hasin et al., 2007). Genetic factors have been shown to affect liability to AD, with the heritability estimated to be 40–60 % while the remainder variances might be majorly attributable to environmental factors (Uhl, 2004). Great efforts have been made towards unraveling the genetic etiology of AD. Candidate gene and unbiased genome-wide association studies (GWAS) provided evidences for a number of susceptibility variants, highlighting genes involved in various neural signaling pathways, including dopaminergic (Conner et al., 2005), glutamatergic (Schumann et al., 2008) and GABAergic (Bierut et al., 2010) systems. Genes encoding alcohol dehydrogenase (ADH) enzymes playing a key role in alcohol metabolism are also implicated in the vulnerability (Luo et al., 2007).
Despite the growing knowledge on susceptibility loci contributing to the individual differences in drinking behavior, the genetic findings in general suffer modest effect sizes. For instance, in a large GWAS of AD where thousands of subjects were included for investigations, no single nucleotide polymorphism (SNP) could pass the genome-wide significance threshold of 5.00×10⁻⁸ (Stranger et al., 2011). Instead the highlighted 15 SNPs yielded suggestive associations with p < 10−5 (Bierut et al., 2010), yet none of them could be replicated in two independent studies with nominal threshold of 0.05, and nor did they replicate findings of a previous GWAS (Treutlein et al., 2010). This is essentially a common challenge in complex trait mapping. Indeed, like many other complex disorders, AD is suggested to have polygenic risk factors (Johnson et al., 2006), such that the underlying genetic architecture involves many loci with modest individual effect sizes, which may function together to confer the liability. Understanding the mechanism of genetic effects becomes even more complicated due to phenotypic heterogeneity where genetic variants can exert influences on various phenotypes through different biological mechanisms (Wong and Schumann, 2008).
In this work, we employed a semiblind multivariate approach, parallel independent component analysis with multiple references (pICA-MR) (Chen et al., 2014), to investigate genetic basis underlying brain function related to AD. Specifically, functional magnetic resonance imaging (fMRI) data were collected from subjects exposed to a well-established alcohol cue paradigm (Claus et al., 2011; Filbey et al., 2008). The method, pICA-MR is an extension of pICA (Liu et al., 2009; Meda et al., 2010) and pICA-R (single reference) (Chen et al., 2013), which have been implemented by many studies for various data modalities. pICA-MR extracts independent components from the imaging and genetic modalities separately to assess aggregate effects of multiple variables, posing a promising model for polygenicity and pleiotropy. It also enhances inter-modality associations, providing a translational framework for exploring genetic underpinnings of neuronal functions, which might ultimately lead to clinical manifestations of the disorder. In addition, genetic references (i.e. multiple sets of SNPs) are incorporated to help extract genetic components of particular attribute. This method has proven to be very helpful in pinpointing mechanisms of interest in high-dimensional complex data (Chen et al., 2014).
Materials and Methods
Participants
A total of 326 subjects participated in the study to investigate genetic and neurobiological traits related to heavy drinking (Claus et al., 2011). The University of New Mexico Human Research Review Committee approved the study. All the participants were recruited from the greater Albuquerque metropolitan region and provided written informed consent. The inclusion criterion was based on alcohol consumption, requiring participants to drink at least five times in the past month with at least 5 (for men) or 4 (for women) drinks per drinking occasion. The exclusion criteria included a history of severe alcohol withdrawal, brain-related medical problems, or symptoms of psychosis. In addition, participants were required to be sober during the data collection, with a breath alcohol concentration of 0.00. After preprocessing, 315 participants were admitted into the analysis, for which good quality fMRI and SNP data were collected. Table 1 provides the demographic information.
Table 1.
Demographic information of participants.
| Number of participants | Male (220) | Female (95) | |
|---|---|---|---|
| Race | Caucasian | 99 | 43 |
| African American | 4 | 2 | |
| Asian | 2 | 0 | |
| Latino | 54 | 28 | |
| Native American | 13 | 3 | |
| Mixed | 47 | 19 | |
| Unreported | 1 | 0 | |
| Age | Mean ± SD | 31.74 ± 9.43 | 32.52 ± 10.58 |
| Range | 21 – 56 | 21 – 55 | |
Data Collection and Preprocessing
Behavioral assessment
The assessment was administered through a variety of questionnaires, including the Alcohol Dependence Scale (ADS) (Skinner and Horn, 1984), the Alcohol Use Disorder Identification Test (AUDIT) (Babor et al., 2001) and the Impaired Control Scale (ICS) for alcohol (Heather et al., 1998). We excluded relatively incomplete measures where data were missing for more than 25 subjects. Finally a total of 23 behavioral measures were investigated for associations with identified imaging and genetic components, as listed in Table 2. The missing ratio was no greater than 4/315. It should be noted that most of these behavioral measures showed significant associations with age, except for AgeFirstDrink, EStress-tot and Stress-tot.
Table 2.
Alcohol dependence assessment.
| Assessment | Sub-category | Description |
|---|---|---|
| ADS | ADS-con | Loss of behavior control |
| ADS-obs | Obsessive drinking style | |
| ADS-per | Psychoperceptual withdrawal | |
| ADS-phy | Psychophysical withdrawal | |
| ADS-tot | Total ADS | |
| AUDIT-tot | Total AUDIT score | |
| AUDIT-consump | Alcohol consumption total (sum of AUDIT-1, -2, and -3) | |
| AUDIT-dep | AD total (sum of AUDIT-4, -5, and -6) | |
| AUDIT-probs | Alcohol problems total (sum of AUDIT-7, -8, -9 and -10) | |
| ICS | ICS-total | Total ICS |
| ICS-ac | Attempted control | |
| ICS-fc | Failed control | |
| ICS-pc | Perceived control | |
| Alcohol symptom count | PA-count | Past alcohol abuse symptom count |
| CA-count | Current alcohol abuse symptom count | |
| PD-count | Past AD symptom count | |
| CD-count | Current AD symptom count | |
| Drinking history | NewAgeDrink | Probable age that regular drinking first occurred |
| NewYearsDrink | Probable number of years of regular drinking | |
| AgeFirstDrink | Probable age of first drink | |
| Stress | EStress-tot | Total early stress for ages before 19 (0–18 years old) |
| Stress-tot | Early Stress total (all ages reported) | |
| BDI-tot | Total Beck Depression Inventory |
Functional MRI
Brain activation data were collected during an alcohol craving task as described in (Claus et al., 2011; Filbey et al., 2008). Participants were exposed to small amounts of alcoholic (individual preferred) or juice (litchi) beverages pseudorandomly presented during the MRI scans. Each taste cue trial sequentially consisted of a 2s “Ready” prompt, a 24s taste cue presentation and a 16s washout period. During the cue presentation, participants tasted the presented beverage (second 1–10 and 12–22) and then swallowed (second 10–12 and 22–24). No stimuli were presented during the washout and participants viewed the word “Rest”. Two 9min runs were conducted for each participant, with a single run spanning 12 trials, 6 for each tastant. A 3T Siemens Trio was used for the data collection. The echo-planar gradient-echo pulse sequence was configured as follows: TR = 2s, TE = 29ms, flip angle = 75°, voxel size = 3.75mm × 3.75mm × 4.55mm. The collected fMRI data were preprocessed with Statistical Parametric Mapping 5 (SPM5, http://www.fil.ion.ucl.ac.uk/spm). Standard motion correction was performed and images were normalized to the Montreal Neurological Institute (MNI) template (Jenkinson et al., 2002) and resliced to 3×3×3 mm3. An 8mm full-width half-maximum Gaussian kernel was used for spatial smoothing. Finally alcohol versus juice contrast images spanning a total of 54,937 voxels were extracted for subsequent association analyses.
SNP data
Saliva samples were collected from participants for DNA extraction. Genotyping for all participants was performed at the Mind Research Network using the Illumina Infinium Human 1M-Duo assay spanning 1,199,187 SNP loci. BeadStudio was used to make the final genotype calls. A series of standard quality control procedures were then performed with PLINK (Purcell et al., 2007). Specifically, SNPs and participants were first examined for a genotyping rate threshold of 95%; SNPs were excluded if they deviated from Hardy-Weinberg Equilibrium with a threshold of 10−6 or failed to be missing at random with a threshold of 10−10; 2 participants were excluded due to high heterozygosity (3-SD greater than the mean); Another 2 participants were excluded due to relatedness with identity-by-descent values greater than 0.1875; Minor allele frequency threshold was set to 0.05. After the quality control, discrete numbers were assigned to the categorical genotypes: 0 for no minor allele, 1 for one minor allele and 2 for two minor alleles. Subsequently, we replaced the missing genotypes using high linkage disequilibrium (LD) loci if available (correlation > 0.80), excluded 18,809 SNPs with a missing ratio greater than 1%, and replaced the rest missing genotypes with the major alleles of individual loci. The resulting 717,129 autosomal SNPs were then used for population stratification by principal component analysis (PCA), and three principal components (PC1, 2, and 4) differed significantly among ethnic groups (p = 9.85×10−79, 3.23×10−86 and 3.21×10−55, respectively) while exhibiting no significant associations with drinking behavior measures. These three components were then eliminated from the original data. Afterwards, a Q-Q plot for p-values of SNP association with the AUDIT-tot score tested against a uniform distribution showed no clear indication of population structure (Figure S1).
Association Analysis
The fMRI contrast images were analyzed in conjunction with the SNP data using pICA-MR (Chen et al., 2014), which extends the pICA (Liu et al., 2009) and pICA-R (Chen et al., 2013) approach to accommodate multiple references. Figure 1 shows the flowchart of pICA-MR. As a multivariate approach, pICA-MR first decomposes the two datasets, X1 and X2, into linear combinations of underlying components separately and in parallel. S, A and W denote the component, mixing and unmixing matrices, respectively. The subscript d runs from 1 to 2, denoting two data modalities.
Figure 1.

A flowchart of pICA-MR.
Modality 1 (imaging data) is decomposed by infomax ICA (Bell and Sejnowski, 1995) to organize independent sets of co-varying variables into different components through maximizing entropy. For modality 2 (genetic data), the decomposition is based on constrained infomax so that components are not only independent but closely resemble the reference matrix r (Chen et al., 2014). Each row of r represents a reference vector, which is of the same dimension as the SNP data with non-zeroes representing a group of reference loci likely contributing in a coordinated manner. pICA-MR then calculates the Euclidean distances between each reference vector and all the components only using non-zero reference loci to determine the closest one as the corresponding constrained component, whose distance is further minimized. This design enables a semiblind decomposition to partially constrain the reference loci in the resulting components while still allowing the remaining loci to show their own importance driven by the data. Meanwhile, different reference vectors can constrain the same component, indicating functional convergence in a data-driven manner. Finally, as inherited from pICA (Liu et al., 2009), the inter-modality associations are optimized through maximizing the correlations computed over the columns of the loading matrices A1 and A2. A detailed description of the mathematical model is provided in the supplementary information. Simulations suggest that pICA-MR effectively identifies similarity among multiple references and the detection power is comparable to pICA-R and hence significantly improved compared to blind methods (Chen et al., 2014).
In this work, the number of fMRI components was estimated by minimum description length (MDL) (Rissanen, 1978) on uncorrelated voxels. The number of SNP components was estimated based on component consistency (Chen et al., 2012). Six sets of genes were selected based on previously reported association with alcohol dependence, as shown in Table 3 (see supplementary information for a full description and list of references). Each set including multiple genes was used as one independent reference set and tested separately.
Table 3.
Tested genetic references.
| Reference | Genes | References |
|---|---|---|
| 15q24-25 | CHRNA3, CHRNA5, CHRNB4 | Bierut, 2010; Caporaso et al., 2009; Wang et al., 2009 |
| 4p12 | GABRA4, GABRA2, GABRG1, GABRB1 | Bierut et al., 2010; Enoch et al., 2009 |
| 5q34 | GABRB2, GABRA6, GABRA1, GABRG2 | Radel et al., 2005 |
| 4q23 | ADH1A, ADH1B, ADH1C | Edenberg et al., 2006; Luo et al., 2007 |
| Opioid system | OPRM1, OPRK1, OPRD1 | Filbey et al., 2008; Zhang et al., 2008 |
| CREB-BDNF | CREB1, CREB5, BDNF | Carlezon et al., 2005; Crews et al., 2007; Pandey, 2003 |
Following the design of pICA-MR, a reference matrix was generated with each row representing a group of SNP loci hosted by a single gene. Most of the selected reference genes spanned tens of SNPs forming a single LD block in our data, which were directly used to generate the reference matrix. One exception was CREB5 hosting 228 SNPs, for which multiple LD blocks (r2 > 0.2, (Ripke et al., 2011)) were identified and represented in multiple reference matrices. It should be noted that we only examined six sets of genes in this work. Many other genes of great importance such as those from dopaminergic and glutamatergic systems are left for future investigations.
To assess the fidelity of the identified association, we applied 10-fold validation. Ten runs, each with 90% of the subjects, were conducted to evaluate the reproducibility of the full set SNP-fMRI association in subsets of the data. More informatively, we performed a 1000-run permutation test to assess the validity of our finding, that is, to investigate the possibility of the identified SNP-fMRI association occurring in randomly rearranged subjects. Based on the top associated component pair of each run, we calculated the tail probability to evaluate the significance level of the identified SNP-fMRI association.
To understand the functional influences, the identified SNP and fMRI components were further investigated for associations with all the behavioral measures listed in Table 2. Multiple regression analysis was conducted to control for sex and race. False discovery rate (FDR) was applied to account for multiple tests given the moderate to high correlations among most of the behavioral measures.
Results
The fMRI (54,937 voxels) and SNP (717,129 loci) data were analyzed with pICA-MR. The number of components was estimated to be 15 (fMRI) and 11 (SNP), respectively. Among the tested gene sets, CREB-BDNF elicited a significant SNP-fMRI correlation (r = −0.38, p = 3.98×10⁻¹², passing Bonferroni correction of 0.05/15/11), where the three genes BDNF, CREB1 and CREB5 were identified to constrain the same SNP component. Table S1 summarizes the recruited reference loci, which consisted of all the genotyped loci in BDNF (15 SNPs) and CREB1 (20 SNPs), and an LD block spanning 20 SNPs in CREB5. After regressing out controlling variables (age, sex, race), the SNP-fMRI association remained significant, exhibiting a correlation of −0.36 (p = 2.98×10⁻¹¹), as shown in Figure 2a. The identified SNP-fMRI pair exhibited stable correlations in the 10-fold validation, ranging from 0.23 to 0.33 with a median of 0.27. More importantly, in the 1000-run permutation only one permuted sample exhibited a SNP-fMRI association stronger than that observed in the original data, yielding a significant p-value of 0.001 for our finding.
Figure 2.
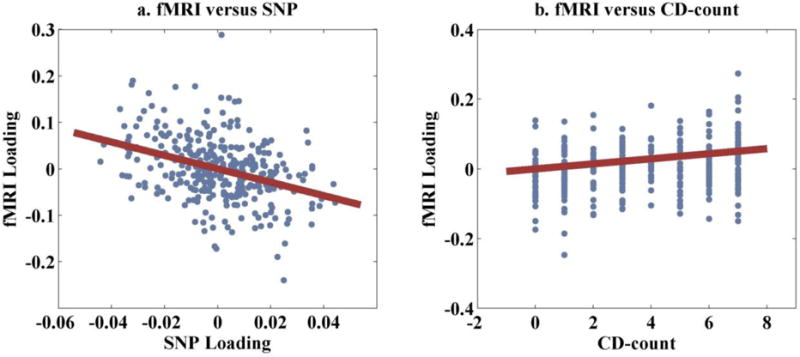
Scatter plots of: (a) the fMRI and SNP loadings; (b) the fMRI loading and CD-count.
The identified fMRI component, with FDR control, was found significantly associated with a number of behavioral measures, including CD-count, ICS-fc, ICS-total and PD-count. The most significant association was observed from CD-count, exhibiting a correlation of 0.25 (p = 7.04×10−06) after regressing out sex and race, as shown in Figure 2b. In addition, the correlation remained significant (r = 0.19, p = 6.45×10−04) after age was further regressed out, suggesting that the variance in activation might reflect more current dependence symptoms than cumulative alcohol use. The fMRI loadings also showed significant associations with ICS-fc, ICS-total and PD-count (correlations of 0.24, 0.23 and 0.21, respectively), all of which highly correlated with CD-count (correlations of 0.68, 0.72 and 0.82 respectively). Due to this collinearity, the individual effect could not be disentangled and we chose to focus on the most significantly associated symptom CD-count in the following discussion. Figure 3 shows the spatial map of the identified fMRI component thresholded at |Z| > 2. Table 4 summarizes the Talairach atlas labels (Lancaster et al., 2000) of the mapped brain network, including precuneus, superior and inferior parietal lobules, as well as posterior cingulate cortex (PCC).
Figure 3.

Spatial map of brain network for the identified fMRI component (|Z| > 2).
Table 4.
Talairach labels of identified brain regions (|Z| > 2).
| Brain region | Brodmann area | L/R volume (cm3) | L/R random effects, max Z (x,y,z) |
|---|---|---|---|
| Precuneus | 7, 19, 39, 31 | 16.8/14.1 | 9.18(0,−58,61)/9.41(3,−58,64) |
| Superior Parietal Lobule | 7, 5 | 8.9/7.6 | 8.55(−3,−67,56)/8.72(6,−64,58) |
| Postcentral Gyrus | 7, 5, 3, 2, 40, 1 | 5.3/4.5 | 8.06(0,−46,66)/9.03(3,−52,66) |
| Inferior Parietal Lobule | 40, 7, 39 | 3.5/3.5 | 4.28(−39,−49,61)/5.11(39,−52,58) |
| Cuneus | 19, 18, 7, 30 | 2.7/3.7 | 4.53(0,−82,40)/4.59(27,−83,37) |
| Paracentral Lobule | 5, 4, 6, 7 | 2.9/1.8 | 7.28(0,−46,63)/5.71(3,−37,68) |
| Posterior Cingulate | 29, 30, 23 | 1.6/1.0 | 3.25(−6,−41,5)/2.99(6,−41,5) |
The identified SNP component did not exhibit any significant association with the behavioral measures. Figure 4 shows a Manhattan plot of weights of loci for the identified SNP component, where the z-score threshold of 3.13 is marked to present the selection of top SNPs (for details, see Figure S2). 1,019 out of the top contributing 2,020 SNPs were mapped to 457 unique genes and used for pathway analyses. Table S2 provides a summary of all the selected top contributing SNPs, including SNP position, hosting gene and z-scored component weight. Ingenuity Pathway Analysis (IPA: Ingenuity® Systems, http://www.ingenuity.com) revealed a number of enriched canonical pathways, including synaptic long term depression (LTD, 1.70×10⁻⁵) and potentiation (LTP, 5.89×10⁻³), CREB Signaling in Neurons (6.31×10⁻⁴), protein kinase A (PKA) signaling (1.26×10⁻²), as well as GABA receptor signaling (2.24×10⁻²), as summarized in Table 5. IPA also indicated a significant enrichment of neurological diseases in our finding, including bipolar disorder (7.56×10⁻⁴), schizophrenia (5.50×10⁻³) and major depression (4.37×10⁻²). The identified genes were also significantly overrepresented in neuritogenesis (2.81×10⁻⁴) and other developmental functions (see Table S3 for a complete summary of pathway analyses). While different thresholds can be used to select top contributing SNPs, we also tested top 1,000 to 5,000 SNPs and similar pathway analyses results were obtained (Table S4). We chose to present the results from 2,020 SNPs since animal models suggested that thousands of genes are involved in the pathology of AD (Mulligan et al., 2006).
Figure 4.

Manhattan plot for the identified SNP component. The black line represents the z-score threshold of 3.13.
Table 5.
Pathway analyses.
| IPA canonical pathway | Genes | P-value |
|---|---|---|
| Synaptic Long Term Depression | GNA14,ITPR1,GRM5,GRM7,GNAI3,GRID1,PLB1, RYR3,LYN,GNAT2,PPP2R1B,PRKCB,PRKCA | 1.70E-05 |
| CREB Signaling in Neurons | GRM5,GRM7,GNAI3,GRIN2A,GRID1,GNAT2, PIK3CD,GNA14,ITPR1,CREB5,PRKCA,PRKCB | 6.31E-04 |
| Axonal Guidance Signaling | LRRC4C,ITSN1,KALRN,RAC1,GNA14,ROBO1, ADAMTS2,GNAI3,SRGAP3,NTRK3,DCC,ADAM19,RTN4, ADAM23,GNAT2,PIK3CD,WNT5B,PRKCA,PRKCB | 5.13E-03 |
| Synaptic Long Term Potentiation | GRM5,GRM7,GRIN2A,GNA14,ITPR1,CREB5,PRKCA, PRKCB | 5.89E-03 |
| Protein Kinase A Signaling | PTPN7,PTPRD,PTPN3,ITPR1,NFKB1,CREB5,PDE1C, GNAI3,HHAT,ADD3,RYR3,DCC,PTPRS,PDE8B, PRKCB,PRKCA | 1.26E-02 |
| GABA Receptor Signaling | GABRG3,GABRR3,AP2M1,AP1B1 | 2.24E-02 |
To further confirm the genetic influence on brain function alterations, we performed a regression analysis between the fMRI and SNP loadings while controlling for age, sex, race as well as associated behavioral measures of CD-count, ICS-fc, ICS-total and PD-count. The SNP component still showed a significant regression effect (p = 1.39×10⁻¹⁰) on the fMRI component.
Discussion
The fMRI loadings exhibited a positive correlation with CD-count, together with positive activations of the component, indicating that subjects experiencing more severe AD symptoms had higher regional activations when exposed to the taste of alcohol. The hyperactivated brain network comprised precuneus, superior and inferior parietal lobules and PCC, as shown in Figure 3 and listed in Table 4. The brain network covered the midline, which might be attributable to spatial smoothing using an 8mm Gaussian kernel. Precuneus belongs to associative cortices and is known to be involved in a wide range of highly integrated tasks, including episodic memory retrieval, self-referential processes and consciousness (Cavanna and Trimble, 2006). Its involvement in a variety of processes builds upon its anatomical wide-spread connections with both adjacent areas such as superior parietal lobule and PCC, and frontal lobes including prefrontal cortex and anterior cingulate cortex (Cavanna and Trimble, 2006). Although not generally targeted for addiction studies, precuneus and parietal regions have been robustly implicated in craving studies, where hyperactivation elicited by drug-related cues has been found associated with severity of dependence (Claus et al., 2011; Liu et al., 2013; Park et al., 2007; Tapert et al., 2004). The drug-cue-elicited activation in precuneus is possibly a reflection of its recruitment in episodic memory retrieval, as the triggering of craving can be considered as a conditioned response where the recollection of past experience as episodic memories serves as a conditioned cue (Robbins et al., 2008). PCC is a key player in the saline network (Sutherland et al., 2012) and frequently implicated in the processing of drug-related stimuli (Tapert et al., 2004; Wrase et al., 2007). Its functional alteration has proven to underlie the concurrent use of alcohol and tobacco (Liu et al., 2014). Of particular interest, as shown in a meta-analysis on fMRI studies of alcohol cue reactivity, brain activation in precuneus and PCC, instead of the mesolimbic system, most effectively differentiates cases from controls in terms of alcohol use severity (Schacht et al., 2013). Overall, the identified brain network echoes considerable similar findings and deserves more attention to elucidate the neuropathology of addiction.
The associated genetic component elicited by the three genes, BDNF, CREB1 and CREB5, negatively correlated with the fMRI component, indicating that subjects carrying lower loadings on the SNP component presented higher brain activation in the identified precuneus and parietal regions. Pathway analyses delineated a complex genetic architecture emphasizing neural plasticity and signaling pathways based on the 457 genes highlighted in the component. A meta-analysis of mouse models identified 3,800 genes differentially expressed between models of high and low amounts of alcohol consumption (Mulligan et al., 2006), suggesting that thousands of genes are involved in the pathology of AD. Our findings appeared to be in line with the animal study and further suggested that the CREB-BDNF pathway likely serves as a hub of the polygenetic effect related to AD, as illustrated below in several associated canonical pathways.
cAMP-response element-binding protein (CREB) functions as a transcription factor and is well known for its role in neural plasticity and long-term memory (Carlezon et al., 2005). Brain derived neurotrophic factor (BDNF) is a CREB regulated gene and active in synaptic plasticity (Bramham and Messaoudi, 2005). Together with several glutamatergic genes (GRM5, GRM7, GRID1 and GRIN2A) and protein kinase C genes (PRKCA and PRKCB), they signify the CREB signaling, synaptic LTD, and synaptic LTP pathways. Synaptic LTP and LTD are two forms of synaptic plasticity which enhances or weakens, respectively, the synchronized stimulations between neurons, thus allowing the refinement of neuronal circuits underlying learning and memory (Malenka and Bear, 2004). It’s commonly recognized that synaptic plasticity plays an important role in the development of addiction, through which use of drug progresses from impulsive to compulsive behavior (Kauer and Malenka, 2007). A meta-analysis further indicated that a genetic component might affect AD through regulating synaptic plasticity (Li et al., 2008), where LTD and LTP are among the top enriched pathways for the 396 addiction-related genes implicated in two or more independent studies. Particularly, one SNP in BDNF (rs6265_A or Val66Met, ‘A’ represents the minor allele) has been identified as predicting relapse in AD patients, where minor allele carriers showed decreased vulnerability to relapse (Wojnar et al., 2009). This is consistent with our finding where the same SNP exhibited a positive weight, indicating that minor allele carriers presented lower brain activation which was associated with less severe AD. The SNP in GRIN2A (rs4628972_G) and three SNPs in PRKCA (rs17688881_C, rs721429_A and rs7217618_C) presented negative weights, indicating that the subjects carrying more minor alleles showed higher brain activations and more severe AD. The opposite was observed for the rest (rs1000061_G in GRM5, rs1353832_C in GRM7, rs1863824_C in GRID1, rs8077110_T in PRKCA and rs880824_A in PRKCB) which all presented positive weights.
As a major inhibitory neurotransmitter in the central nervous system, GABAergic signaling has been implicated in addiction in numerous studies, as reviewed above. It has been reported that chronic cocaine uses decrease GABAergic synapse function, such that LTP induction is not effectively suppressed at excitatory synapses (Liu et al., 2005). Polymorphisms in GABA receptor genes are consistently identified as susceptibility loci to addiction (Bierut et al., 2010), including a number of SNPs in GABRG3 shown to be associated with AD (Dick et al., 2004). In our finding, all the three identified SNPs in GABRG3 (rs12439549_G, rs4438262_G and rs3922613_G) and two SNPs (rs1874864_G and rs7638369_T) in GABRR3 contributed with positive weights, while the rest (rs1844934_T, rs1688378_A and rs1492054_C) exhibited negative weights. Another pathway, cAMP-PKA pathway, is noteworthy here, which is a primary signaling cascade modulating numerous cellular events in neurons, including synaptic plasticity (Waltereit and Weller, 2003). It is documented that activation of the cAMP-PKA signaling leads to increased activity of CREB (Ron and Jurd, 2005), and genetic mutation reducing cAMP-PKA signaling results in increased sensitivity to the sedative effects of ethanol (Wand et al., 2001). The detail of how each SNP in this pathway contributes to the genetic component can be found in Table S2.
It should be noted that the identified genetic component was not specific to alcohol use disorders. The canonical pathways aforementioned and neurodevelopmental functions such as neuritogenesis and axonal guidance (Table S3) are part of much broad neural processes. IPA also implicated that the associated genes were overrepresented in other neuropsychiatric diseases, including bipolar disorder, schizophrenia and major depression. This suggests a genetic basis for the comorbidity among these disorders, for which accumulated evidence has been provided (Johnson et al., 2009; Lee et al., 2013). Overall, the genetic component delineates a relatively general substrate whose disruptions may interact with other factors to trigger various diseases, which is in accord with the fact that the identified brain network also participates in various tasks not specific to those related to AD.
In summary, using a novel semiblind multivariate approach we demonstrate gene interactions within the polygenic model of AD selected by the CREB-BDNF gene set. The extracted SNP component exhibits enrichment in neural plasticity and signaling pathways. The captured brain network, highlighting the precuneus, superior parietal and PCC regions, is related to alcohol dependence scores. The significant SNP-fMRI association indicates that the genetic factor affecting neural plasticity may influence precuneus, superior parietal, and PCC responses to alcohol cues. We speculate one likely mechanism is through learning and memory function executed in these brain regions that is implicated in addiction (Courtney et al., 2014; Robbins et al., 2008), and modulated by neural plasticity.
Supplementary Material
Acknowledgments
We would like to thank MRN Genetics Lab for their help in collecting the genetic data. This project was supported by the National Institutes of Health, grant numbers R33DA027626 (JL); P20GM103472, R01EB006841 and R01EB005846 (VC).
References
- Babor TF, Higgins-Biddle JC, Sauders JB, Monteiro MG. The Alcohol Use Disorders Identification Test: Guide for Use in Primary Care. World Health Organization; Geneva, Switzerland: 2001. [Google Scholar]
- Bell AJ, Sejnowski TJ. An information-maximization approach to blind separation and blind deconvolution. Neural Computation. 1995;7:1129–1159. doi: 10.1162/neco.1995.7.6.1129. [DOI] [PubMed] [Google Scholar]
- Bierut LJ, Agrawal A, Bucholz KK, Doheny KF, Laurie C, Pugh E, et al. A genome-wide association study of alcohol dependence. Proc Natl Acad Sci U S A. 2010;107:5082–5087. doi: 10.1073/pnas.0911109107. [DOI] [PMC free article] [PubMed] [Google Scholar]
- Bramham CR, Messaoudi E. BDNF function in adult synaptic plasticity: The synaptic consolidation hypothesis. Progress in Neurobiology. 2005;76:99–125. doi: 10.1016/j.pneurobio.2005.06.003. [DOI] [PubMed] [Google Scholar]
- Carlezon WA, Duman RS, Nestler EJ. The many faces of CREB. Trends in Neurosciences. 2005;28:436–445. doi: 10.1016/j.tins.2005.06.005. [DOI] [PubMed] [Google Scholar]
- Cavanna AE, Trimble MR. The precuneus: a review of its functional anatomy and behavioural correlates. Brain : a journal of neurology. 2006;129:564–583. doi: 10.1093/brain/awl004. [DOI] [PubMed] [Google Scholar]
- Chen J, Calhoun VD, Liu J. ICA Order Selection Based on Consistency: Application to Genotype Data. 34th Annual International Conference of the IEEE Engineering in Medicine and Biology Society. 2012 doi: 10.1109/EMBC.2012.6345943. in press. [DOI] [PMC free article] [PubMed] [Google Scholar]
- Chen J, Calhoun VD, Liu J. Parallel ICA with Multiple References: A Semi-blind Multivariate Approach. 36th Annual International Conference of the IEEE Engineering in Medicine and Biology Society (EMBC); Chicago, IL USA. 2014. In press. [DOI] [PMC free article] [PubMed] [Google Scholar]
- Chen J, Calhoun VD, Pearlson GD, Perrone-Bizzozero N, Sui J, Turner JA, et al. Guided exploration of genomic risk for gray matter abnormalities in schizophrenia using parallel independent component analysis with reference. Neuroimage. 2013;83C:384–396. doi: 10.1016/j.neuroimage.2013.05.073. [DOI] [PMC free article] [PubMed] [Google Scholar]
- Claus ED, Ewing SW, Filbey FM, Sabbineni A, Hutchison KE. Identifying neurobiological phenotypes associated with alcohol use disorder severity. Neuropsychopharmacology. 2011;36:2086–2096. doi: 10.1038/npp.2011.99. [DOI] [PMC free article] [PubMed] [Google Scholar]
- Conner BT, Noble EP, Berman SM, Ozkaragoz T, Ritchie T, Antolin T, et al. DRD2 genotypes and substance use in adolescent children of alcoholics. Drug and Alcohol Dependence. 2005;79:379–387. doi: 10.1016/j.drugalcdep.2005.03.005. [DOI] [PubMed] [Google Scholar]
- Courtney KE, Ghahremani DG, London ED, Ray LA. The association between cue-reactivity in the precuneus and level of dependence on nicotine and alcohol. Drug Alcohol Depend. 2014 doi: 10.1016/j.drugalcdep.2014.04.026. [DOI] [PMC free article] [PubMed] [Google Scholar]
- Dick DM, Edenberg HJ, Xuei XL, Goate A, Kuperman S, Schuckit M, et al. Association of GABRG3 with alcohol dependence. Alcoholism-Clinical and Experimental Research. 2004;28:4–9. doi: 10.1097/01.ALC.0000108645.54345.98. [DOI] [PubMed] [Google Scholar]
- Filbey FM, Claus E, Audette AR, Niculescu M, Banich MT, Tanabe J, et al. Exposure to the taste of alcohol elicits activation of the mesocorticolimbic neurocircuitry. Neuropsychopharmacology. 2008;33:1391–1401. doi: 10.1038/sj.npp.1301513. [DOI] [PMC free article] [PubMed] [Google Scholar]
- Hasin DS, Stinson FS, Ogburn E, Grant BF. Prevalence, correlates, disability, and comorbidity of DSM-IV alcohol abuse and dependence in the United States: results from the National Epidemiologic Survey on Alcohol and Related Conditions. Arch Gen Psychiatry. 2007;64:830–842. doi: 10.1001/archpsyc.64.7.830. [DOI] [PubMed] [Google Scholar]
- Heather N, Booth P, Luce A. Impaired control scale: cross-validation and relationships with treatment outcome. Addiction. 1998;93:761–771. doi: 10.1046/j.1360-0443.1998.93576112.x. [DOI] [PubMed] [Google Scholar]
- Jenkinson M, Bannister P, Brady M, Smith S. Improved optimization for the robust and accurate linear registration and motion correction of brain images. Neuroimage. 2002;17:825–841. doi: 10.1016/s1053-8119(02)91132-8. [DOI] [PubMed] [Google Scholar]
- Johnson C, Drgon T, Liu QR, Walther D, Edenberg H, Rice J, et al. Pooled association genome scanning for alcohol dependence using 104,268 SNPs: Validation and use to identify alcoholism vulnerability loci in unrelated individuals from the collaborative study on the genetics of alcoholism. American Journal of Medical Genetics Part B-Neuropsychiatric Genetics. 2006;141B:844–853. doi: 10.1002/ajmg.b.30346. [DOI] [PMC free article] [PubMed] [Google Scholar]
- Johnson C, Drgon T, McMahon FJ, Uhl GR. Convergent Genome Wide Association Results for Bipolar Disorder and Substance Dependence. American Journal of Medical Genetics Part B-Neuropsychiatric Genetics. 2009;150B:182–190. doi: 10.1002/ajmg.b.30900. [DOI] [PubMed] [Google Scholar]
- Kauer JA, Malenka RC. Synaptic plasticity and addiction. Nature Reviews Neuroscience. 2007;8:844–858. doi: 10.1038/nrn2234. [DOI] [PubMed] [Google Scholar]
- Lancaster JL, Woldorff MG, Parsons LM, Liotti M, Freitas CS, Rainey L, et al. Automated Talairach atlas labels for functional brain mapping. Human Brain Mapping. 2000;10:120–131. doi: 10.1002/1097-0193(200007)10:3<120::AID-HBM30>3.0.CO;2-8. [DOI] [PMC free article] [PubMed] [Google Scholar]
- Lee SH, Ripke S, Neale BM, Faraone SV, Purcell SM, Perlis RH, et al. Genetic relationship between five psychiatric disorders estimated from genome-wide SNPs. Nature Genetics. 2013;45:984–+. doi: 10.1038/ng.2711. [DOI] [PMC free article] [PubMed] [Google Scholar]
- Li CY, Mao XZ, Wei LP. Genes and (Common) pathways underlying drug addiction. Plos Computational Biology. 2008;4 doi: 10.1371/journal.pcbi.0040002. [DOI] [PMC free article] [PubMed] [Google Scholar]
- Liu J, Calhoun VD, Chen J, Claus ED, Hutchison KE. Effect of homozygous deletions at 22q13.1 on alcohol dependence severity and cue-elicited BOLD response in the precuneus. Addict Biol. 2013;18:548–558. doi: 10.1111/j.1369-1600.2011.00393.x. [DOI] [PMC free article] [PubMed] [Google Scholar]
- Liu J, Claus ED, Calhoun VD, Hutchison KE. Brain Regions Affected by Impaired Control Modulate Responses to Alcohol and Smoking Cues. Journal of Studies on Alcohol and Drugs. 2014 doi: 10.15288/jsad.2014.75.808. [DOI] [PMC free article] [PubMed] [Google Scholar]
- Liu J, Pearlson G, Windemuth A, Ruano G, Perrone-Bizzozero NI, Calhoun V. Combining fMRI and SNP data to investigate connections between brain function and genetics using parallel ICA. Human Brain Mapping. 2009;30:241–255. doi: 10.1002/hbm.20508. [DOI] [PMC free article] [PubMed] [Google Scholar]
- Liu QS, Pu L, Poo MM. Repeated cocaine exposure in vivo facilitates LTP induction in midbrain dopamine neurons. Nature. 2005;437:1027–1031. doi: 10.1038/nature04050. [DOI] [PMC free article] [PubMed] [Google Scholar]
- Luo XG, Kranzler HR, Zuo LJ, Wang S, Schork NJ, Gelernter J. Multiple ADH genes modulate risk for drug dependence in both African- and European-Americans. Human Molecular Genetics. 2007;16:380–390. doi: 10.1093/hmg/ddl460. [DOI] [PMC free article] [PubMed] [Google Scholar]
- Malenka RC, Bear MF. LTP and LTD: An embarrassment of riches. Neuron. 2004;44:5–21. doi: 10.1016/j.neuron.2004.09.012. [DOI] [PubMed] [Google Scholar]
- Meda SA, Jagannathan K, Gelernter J, Calhoun VD, Liu J, Stevens MC, et al. A pilot multivariate parallel ICA study to investigate differential linkage between neural networks and genetic profiles in schizophrenia. Neuroimage. 2010;53:1007–1015. doi: 10.1016/j.neuroimage.2009.11.052. [DOI] [PMC free article] [PubMed] [Google Scholar]
- Mulligan MK, Ponomarev I, Hitzemann RJ, Belknap JK, Tabakoff B, Harris RA, et al. Toward understanding the genetics of alcohol drinking through transcriptome meta-analysis. Proceedings of the National Academy of Sciences of the United States of America. 2006;103:6368–6373. doi: 10.1073/pnas.0510188103. [DOI] [PMC free article] [PubMed] [Google Scholar]
- Park MS, Sohn JH, Suk JA, Kim SH, Sohn S, Sparacio R. Brain substrates of craving to alcohol cues in subjects with alcohol use disorder. Alcohol Alcohol. 2007;42:417–422. doi: 10.1093/alcalc/agl117. [DOI] [PubMed] [Google Scholar]
- Purcell S, Neale B, Todd-Brown K, Thomas L, Ferreira MA, Bender D, et al. PLINK: a tool set for whole-genome association and population-based linkage analyses. American Journal of Human Genetics. 2007;81:559–575. doi: 10.1086/519795. [DOI] [PMC free article] [PubMed] [Google Scholar]
- Ripke S, Sanders AR, Kendler KS, Levinson DF, Sklar P, Holmans PA, et al. Genome-wide association study identifies five new schizophrenia loci. Nature Genetics. 2011;43:969–976. doi: 10.1038/ng.940. [DOI] [PMC free article] [PubMed] [Google Scholar]
- Rissanen J. Modeling by Shortest Data Description. Automatica. 1978;14:465–471. [Google Scholar]
- Robbins TW, Ersche KD, Everitt BJ. Drug Addiction and the Memory Systems of the Brain. Addiction Reviews 2008. 2008;1141:1–21. doi: 10.1196/annals.1441.020. [DOI] [PubMed] [Google Scholar]
- Ron D, Jurd R. The ups and downs of signaling cascades in addiction. Sci STKE. 2005;2005:re14. doi: 10.1126/stke.3092005re14. [DOI] [PubMed] [Google Scholar]
- Schacht JP, Anton RF, Myrick H. Functional neuroimaging studies of alcohol cue reactivity: a quantitative meta-analysis and systematic review. Addict Biol. 2013;18:121–133. doi: 10.1111/j.1369-1600.2012.00464.x. [DOI] [PMC free article] [PubMed] [Google Scholar]
- Schumann G, Johann M, Frank J, Preuss U, Dahmen N, Laucht M, et al. Systematic analysis of Glutamatergic neurotransmission genes in alcohol dependence and adolescent risky drinking behavior. Archives of General Psychiatry. 2008;65:826–838. doi: 10.1001/archpsyc.65.7.826. [DOI] [PubMed] [Google Scholar]
- Skinner HA, Horn JL. Alcohol Dependence Scale: Users Guide. Alcohol Research Foundation; Toronto, Canada: 1984. [Google Scholar]
- Stranger BE, Stahl EA, Raj T. Progress and promise of genome-wide association studies for human complex trait genetics. Genetics. 2011;187:367–383. doi: 10.1534/genetics.110.120907. [DOI] [PMC free article] [PubMed] [Google Scholar]
- Sutherland MT, McHugh MJ, Pariyadath V, Stein EA. Resting state functional connectivity in addiction: Lessons learned and a road ahead. Neuroimage. 2012;62:2281–2295. doi: 10.1016/j.neuroimage.2012.01.117. [DOI] [PMC free article] [PubMed] [Google Scholar]
- Tapert SF, Brown GG, Baratta MV, Brown SA. fMRI BOLD response to alcohol stimuli in alcohol dependent young women. Addictive Behaviors. 2004;29:33–50. doi: 10.1016/j.addbeh.2003.07.003. [DOI] [PubMed] [Google Scholar]
- Treutlein J, Cichon S, Ridinger M, Wodarz N, Soyka M, Maier W, et al. Genome-Wide Association Study of Alcohol Dependence. Alcoholism-Clinical and Experimental Research. 2010;34:43a–43a. doi: 10.1111/j.1530-0277.2010.01156.x. [DOI] [PMC free article] [PubMed] [Google Scholar]
- Uhl GR. Molecular genetic underpinnings of human substance abuse vulnerability: likely contributions to understanding addiction as a mnemonic process. Neuropharmacology. 2004;47:140–147. doi: 10.1016/j.neuropharm.2004.07.029. [DOI] [PubMed] [Google Scholar]
- Waltereit R, Weller M. Signaling from cAMP/PKA to MAPK and synaptic plasticity. Molecular Neurobiology. 2003;27:99–106. doi: 10.1385/MN:27:1:99. [DOI] [PubMed] [Google Scholar]
- Wand G, Levine M, Zweifel L, Schwindinger W, Abel T. The cAMP-protein kinase A signal transduction pathway modulates ethanol consumption and sedative effects of ethanol. The Journal of neuroscience : the official journal of the Society for Neuroscience. 2001;21:5297–5303. doi: 10.1523/JNEUROSCI.21-14-05297.2001. [DOI] [PMC free article] [PubMed] [Google Scholar]
- Wojnar M, Brower KJ, Strobbe S, Ilgen M, Matsumoto H, Nowosad I, et al. Association Between Val66Met Brain-Derived Neurotrophic Factor (BDNF) Gene Polymorphism and Post-Treatment Relapse in Alcohol Dependence. Alcoholism-Clinical and Experimental Research. 2009;33:693–702. doi: 10.1111/j.1530-0277.2008.00886.x. [DOI] [PMC free article] [PubMed] [Google Scholar]
- Wong CCY, Schumann G. Genetics of addictions: strategies for addressing heterogeneity and polygenicity of substance use disorders. Philosophical Transactions of the Royal Society B-Biological Sciences. 2008;363:3213–3222. doi: 10.1098/rstb.2008.0104. [DOI] [PMC free article] [PubMed] [Google Scholar]
- Wrase J, Schlagenhauf F, Kienast T, Wustenberg T, Bermpohl F, Kahnt T, et al. Dysfunction of reward processing correlates with alcohol craving in detoxified alcoholics. Neuroimage. 2007;35:787–794. doi: 10.1016/j.neuroimage.2006.11.043. [DOI] [PubMed] [Google Scholar]
Associated Data
This section collects any data citations, data availability statements, or supplementary materials included in this article.