Abstract
Triiodothyronine (T3) induces hepatocyte proliferation in rodents. Recent work has shown molecular mechanism for T3’s mitogenic effect to be through activation of β-catenin signaling. Since systemic side effects of T3 may preclude its clinical use, and hepatocytes mostly express T3 hormone receptor β (TRβ), we investigated if selective TRβ agonists like GC-1 may also have β-catenin-dependent hepatocyte mitogenic effects. Here we studied the effect of GC-1 and T3 in conditional knockouts of various Wnt pathway components. We also assessed any regenerative advantage of T3 or GC-1 when given prior to partial hepatectomy in mice. Mice administered GC-1 showed increased pSer675-β-catenin, cyclin D1, BrdU incorporation, and PCNA. No abnormalities in liver function tests were noted. GC-1-injected liver-specific β-catenin knockouts (β-catenin LKO) showed decreased proliferation when compared to wild-type littermates. To address if Wnt signaling was required for T3- or GC-1-mediated hepatocyte proliferation, we used LRP5-6-LKO, which lacks the two redundant Wnt coreceptors. Surprisingly, decreased hepatocyte proliferation was also evident in LRP5-6-LKO in response to T3 and GC-1, despite increased pSer675-β-catenin. Further, increased levels of active β-catenin (hypophosphorylated at Ser33, Ser37, and Thr41) were evident after T3 and GC-1 treatment. Finally, mice pretreated with T3 or GC-1 for 7 days followed by partial hepatectomy showed a significant increase in hepatocyte proliferation both at the time (T0) and 24 h after surgery. In conclusion, like T3, TRβ-selective agonists induce hepatocyte proliferation through β-catenin activation via both PKA- and Wnt-dependent mechanisms and confer a regenerative advantage following surgical resection. Hence, these agents may be useful regenerative therapies in liver transplantation or other surgical settings.
Keywords: Wnt pathway, Regeneration, Hepatocyte proliferation, Liver transplantation
INTRODUCTION
The capacity of the liver to regenerate has long been of interest to the scientific community. It is a focus of much research both for academic purposes and clinical applications that could be lifesaving in cases of end-stage liver disease1. Out of the midst of redundant pathways that give the liver this unique ability, β-catenin has emerged as an important player2,3. It is a key effector of the Wnt/β-catenin signaling pathway, which has been shown to play an important role in liver development. It has been shown to participate in liver regeneration in mouse models, zebrafish, rat, and patients in the context of surgical resection or toxicant-induced liver injury. Mice lacking β-catenin in their hepatocytes had impaired liver regeneration in the form of delayed kinetics compared to wild-type mice with intact β-catenin in their hepatocytes. More relevant from a therapeutic standpoint, overexpression of β-catenin led to an earlier and more significant hepatocyte proliferation in mice after partial hepatectomy4,5. In humans, a retrospective study showed increased nuclear β-catenin and proliferating cell nuclear antigen (PCNA) in patients who recovered after acetaminophen-induced injury, compared to patients who required liver transplantation6. Thus, identifying physiological means of activating β-catenin may have significant therapeutic implications, especially in settings of liver transplantation and other surgical settings.
Triiodothyronine (T3) hormone has been identified as mitogenic to adult liver, as well as other organs such as the intestine, heart, and pancreas7–9. It has been shown to cause increased hepatocyte proliferation in rats or mice, which is due to thyroid hormone receptor β (TRβ)7. It was also shown that T3’s mitogenic effect does not require c-jun10, but induces cyclin D111, which is an important target of β-catenin in liver regeneration12,13. We directly assessed the role of β-catenin in T3-mediated hepatocyte proliferation and showed that, indeed, T3-induced hepatocyte proliferation is β-catenin dependent14. Furthermore, we showed that at least part of T3-dependent β-catenin activation is through increase in phosphorylated Ser675-β-catenin (pSer675-β-catenin). This site, along with Ser552, has been shown to be downstream of cAMP-dependent protein kinase A (PKA) activation15. Indeed a PKA inhibitor when administered together with T3 abrogated the observed increase in hepatocyte proliferation14.
Because it is a naturally occurring mitogen, T3 is of great interest as a potential therapeutic agent. However, T3 receptors are widespread throughout the body, and its use may cause significant systemic side effects, especially cardiovascular in nature16. The thyroid hormone is known to exert a myriad of actions affecting the body’s growth and metabolism, and it does so by interacting with several different receptors17. Since the liver has been described to express TRβ7, use of selective agonists like GC-1, or sobetirome, may be superior and relatively risk free18. This drug activates TRβ and has been investigated for its possible role in lowering lipids, as well as improving nonalcoholic steatohepatitis in research models19–21.
In the current study, we show that selective TRβ agonist GC-1 induces hepatocyte proliferation in mice albeit less efficaciously. We used liver-specific β-catenin knockout (β-catenin-LKO) as well as liver-specific double knockouts of Wnt coreceptors LRP5 and 6 (LRP5-6-LKO) mouse models to show that in addition to PKA, Wnt signaling is also required for adequate β-catenin activation to induce hepatocyte proliferation by both T3 and GC-1. Last, we demonstrate a direct regenerative advantage of preadministering T3 or GC-1 to mice after partial hepatectomy, suggesting relevant clinical applications in regenerative medicine.
MATERIALS AND METHODS
Animals
All studies on mice were performed in strict accordance with the Institutional Animal Use and Care Committee at the University of Pittsburgh. Eight-week-old male C57BL/6 male mice (Jackson/Charles River) were maintained on a standard laboratory basal diet (test diet, n = 4) or fed a T3-supplemented diet (4 mg/kg of diet, n = 4; Sigma-Aldrich, St. Louis, MO, USA). GC-1 was administered to the 8-week-old male C57BL/6 male mice either via GC-1-supplemented diet (5 mg/kg of diet; Medchem Express) for 8 days (n = 4) or via daily intraperitoneal (IP) injections of GC-1 dissolved in DMSO (0.3 mg/kg/dose) for 8 days (n = 7). As a control group for injections, DMSO alone was injected daily IP for 8 days (n = 5). Mice were sacrificed 24 h after the last injection.
Eight- to 10-week-old male hepatocyte-specific β-catenin knockout mice (β-cat-LKO) or sex-matched littermate controls obtained from breeding homozygous floxed β-catenin mice and albumin-cre transgenic mice (as described elsewhere12) were given eight daily IP injections of GC-1 (n = 4) or DMSO (n = 4) and harvested around 24 h after the last injection.
Eight- to 10-week-old LRP5-6-LKO were obtained from breeding homozygous LRP5-6 double floxed mice with albumin-cre transgenic mice as described previously22. LRP5-6-LKO or sex-matched littermate controls were given either T3-supplemented diet (n = 4), basal diet (n = 3), IP GC-1 (n = 3), or IP DMSO (n = 3). Mice were sacrificed at 24 h after the last IP injection.
To label dividing hepatocytes, BrdU (5-bromodeoxyuridine) dissolved in drinking water (1 mg/ml) was given to all animals throughout the experimental period. The animals were given food and water ad libitum with a 12-h light/dark daily cycle.
Partial Hepatectomy
After 7 days of receiving T3-supplemented diet (n = 3) or GC-1 diet (n = 3) or standard basal mouse chow (n = 3), C57BL/6 male mice underwent partial hepatectomy as described previously12. Anesthesia was provided with inhaled isoflurane. The animals were sacrificed 24 h posthepatectomy, after isoflurane anesthesia and cervical dislocation. Serum and liver tissues were harvested for further processing.
Immunohistochemistry
Four-micron liver sections were analyzed by immunohistochemistry for β-catenin (BD Biosciences, San Jose, CA, USA), cyclin D1 (Thermo Scientific, Fremont, CA, USA) and PCNA (Santa Cruz Biotechnology, Dallas, TX, USA). Briefly, formalin-fixed sections were deparaffinized in graded xylene and alcohol. Endogenous peroxidase was inactivated using 3% hydrogen peroxide (Sigma-Aldrich). For β-catenin, cyclin D1 staining, slides were microwaved in citrate buffer followed by blocking with SuperBlock for 10 min. Sections were then incubated with secondary anti-mouse (for β-catenin) or anti-rabbit (for cyclin D1) horseradish peroxidase-conjugated antibody for 30 min.
For PCNA, slides were microwaved in zinc sulfate for 12 min, followed by blocking with SuperBlock for 20 min. Sections were incubated with PCNA antibody (Santa Cruz Biotechnology) diluted 1:4,000 in phosphate-buffered saline (PBS) for 60 min. Slides were then incubated with horse anti-mouse secondary antibody (1:700 dilution) for 30 min. ABC was applied for 30 min. DAB kit was then applied. Slides were then dehydrated, coverslips placed, and allowed to dry.
BrdU was stained with mouse antibody (Becton Dickinson) as previously described14. Briefly, tissue sections were deparaffinized, exposed to 0.3% hydrogen peroxide in deionized water for 10 min to block endogenous peroxidase, treated with 2N HCl, and incubated with trypsin 0.1% for 20 min and then with normal goat serum for 20 min at room temperature. Sections were then incubated overnight in a cold room with anti-BrdU monoclonal antibody, followed by biotinylated goat anti-mouse immunoglobulin g (IgG). DAB kit was then applied, and sections were counterstained with hematoxylin. A small segment of intestine was included from each mouse as a positive control for the staining. For quantification of BrdU staining, at least 10 high-power fields (400× or 600×) fields each from at least three biological replicates were counted as indicated in the figures. Statistical analysis was performed as described below.
Protein Extraction and Western Blot Analysis
Protein extraction from frozen liver tissue and Western blot analysis were performed as previously described14. For protein extraction, a small amount of frozen liver tissue was obtained (over dry ice) and was homogenized using RIPA buffer with protease and phosphatase inhibitor cocktail (Sigma-Aldrich). Samples were transferred to a 1.5-ml tube on ice, and spun in a cold room centrifuge at 14,000 RPM for 5 min. The pellet was then discarded, and the sample was aliquoted and stored at −80°C for use. Fifty micrograms of the proteins was resolved by sodium dodecyl sulfate-polyacrylamide gel electrophoresis analysis, and transferred to immobilon-polyvinylidene difluoride membranes.
The primary antibodies used were against β-catenin (BD Biosciences); pSer675-β-catenin, pSer552-β-catenin, active-β-catenin (Cell Signaling Technology), cyclin D1 (Thermo Scientific), and β-actin (Sigma-Aldrich). Dilutions of primary antibody were done according to the manufacturer’s recommendations (1:1,000 for all except cyclin D1, which was 1:200). Horseradish peroxidase-conjugated secondary antibodies used were goat anti-mouse (1:20,000) and goat anti-rabbit (1:10,000) (Millipore). The proteins were detected by Super-Signal West Pico Chemiluminescense Substrate (Thermo Scientific, Rockford, IL, USA) and visualized by autoradiography.
Real-Time Polymerase Chain Reaction (RT-PCR)
Total RNA was extracted by homogenizing frozen liver tissues in TRIzol reagent (Invitrogen, Carlsbad, CA, USA) from GC-1-injected β-cat-LKO (n = 4) and littermate control mice (n = 4), and GC-1-injected LRP5-6-LKO (n = 3) and littermate control mice (n = 3). Two micrograms of total RNA from each sample was reverse transcribed after DNAse treatment using SuperScript III First-Strand Kit (Invitrogen). Real-time PCR was performed on an ABI Prism 7300 Sequence Detection System (Applied Biosystems, Foster City, CA, USA) using SYBR Green. For cyclin D1, values were normalized to GAPDH.
Statistics
Data are presented as mean ± SD or SE as indicated. All statistics were performed using Prism 6 software (GraphPad) for Mac OS X. Comparisons between various groups were performed by Student’s t-test (for two groups) or ordinary one-way ANOVA for multiple comparisons. Analysis for significance was done by Tukey’s multiple comparisons test. Values of p < 0.05, p < 0.01, p < 0.001 and p < 0.0001 are considered significant through out the study.
RESULTS
GC-1 Treatment Induces Hepatocyte Proliferation, β-Catenin Activation, and Cyclin D1 Expression in Wild-Type Mice Without Evidence of any Liver Injury
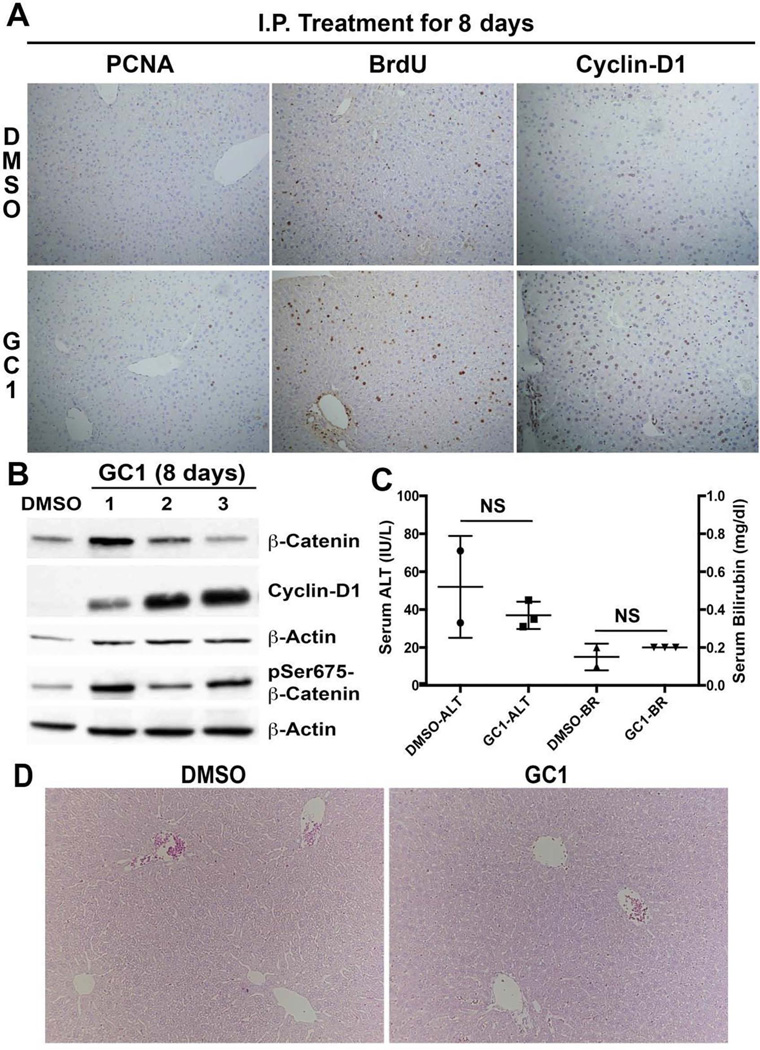
T3 hormone has previously been shown to exert a strong mitogenic effect over hepatocytes in rats and mice, and this action has been shown to require β- catenin activation14. In order to explore if TRβ agonist GC-1 also causes hepatocyte proliferation, we first performed an experiment with normal mice. Two- to 3-month-old C57BL/6 mice received daily IP injections with GC-1 (0.3 mg/kg/dose) dissolved in DMSO or DMSO alone as control. Our results showed an increased number of PCNA-positive hepatocytes as well as BrdU incorporation in GC-1 group showing an increase in hepatocyte proliferation in this group as compared to the DMSO control (Fig. 1A). Immunohistochemistry for cyclin D1 also showed many positive hepatocytes in GC-1 but not DMSO control (Fig. 1A). Western blot analysis using whole-cell lysates from the livers from the two groups showed increased pSer675-β-catenin and cyclin D1 levels in the GC-1-treated group, while total β-catenin levels did not show much difference (Fig. 1B). Serum analysis from the two groups of mice showed insignificant differences in serum ALT or total bilirubin, which remained normal (Fig. 1C). Further, normal hepatic histology comparable to DMSO-injected control was evident in the GC-1 group as shown in representative hematoxylin and eosin (H&E) staining (Fig. 1D). Thus, GC-1 administration by daily IP injections induced hepatocyte proliferation through activation of β-catenin and increased cyclin D1 without any untoward biochemical or histological consequences.
Figure 1.
Thyroid hormone receptor β agonist GC-1 induces hepatocyte proliferation in wild-type mice. (A) Representative photomicrographs (100×) of immunohistochemistry for BrdU and PCNA showed increased proliferation in GC-1-treated mouse livers compared with DMSO controls. Nuclear cyclin D1 was also increased in GC-1-treated mice. (B) Western blot of whole-liver lysates showed increased cyclin D1 and pSer675-β-catenin in GC-1-treated mice compared with DMSO control. (C) Bar graphs shows that the difference in ALT and bilirubin (BR) levels between the experimental groups and control animals was not significant (NS), and all values were within normal limits. (D) Comparable normal hepatic histology in 8-day DMSO and GC-1-injected control mice (100×).
GC-1 Induces Hepatocyte Proliferation Albeit Less Profoundly Than T3
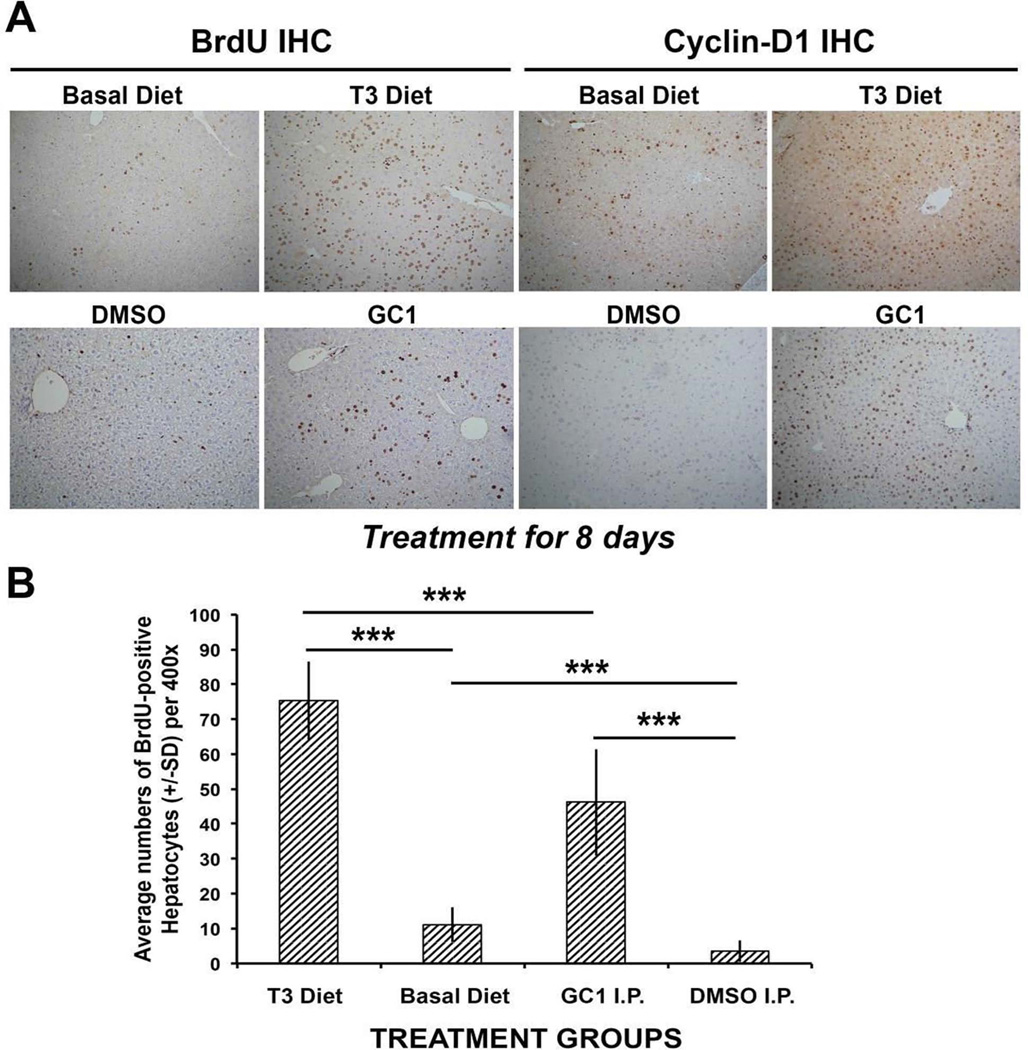
An initial comparison of T3-supplemented diet versus IP GC-1 for 8 days with ad libitum access to BrdU-containing drinking water showed an overall fewer number of BrdU-positive hepatocytes, indicating lesser proliferation in the GC-1-treated group (Fig. 2A). This went along with notably increased cyclin D1 staining in hepatocytes after T3 and GC-1 as compared to their respective controls, although greater numbers of positive cells were evident in the T3 group (Fig. 2A). When BrdU-positive hepatocytes were carefully counted in T3-fed and GC-1-injected groups, the difference between the two groups was statistically significant (p < 0.001) (Fig. 2B). Interestingly however, a decrease in the number of BrdU-labeled hepatocyte nuclei was also observed in the DMSO-injected mice when compared to mice on basal diet, and this difference was also statistically significant (Fig. 2B).
Figure 2.
Comparison of T3 diet-supplemented versus GC-1-injected mice. (A) Immunohistochemistry for BrdU and cyclin D1 shows increased staining in the T3 and GC-1 treatment groups when compared with respective controls (100×). (B) Bar graphs showing average number of BrdU-positive hepatocyte nuclei per high-power field (HPF) (400×) in different conditions. Ten HPFs were counted for each group. T3 diet showed the highest proliferation when compared with basal diet and with GC-1 injections (***p < 0.001). GC-1 showed increased proliferation when compared to DMSO-injected controls (***p < 0.001). DMSO-injected controls had less baseline proliferation than basal diet-fed animals with no other intervention (***p < 0.001).
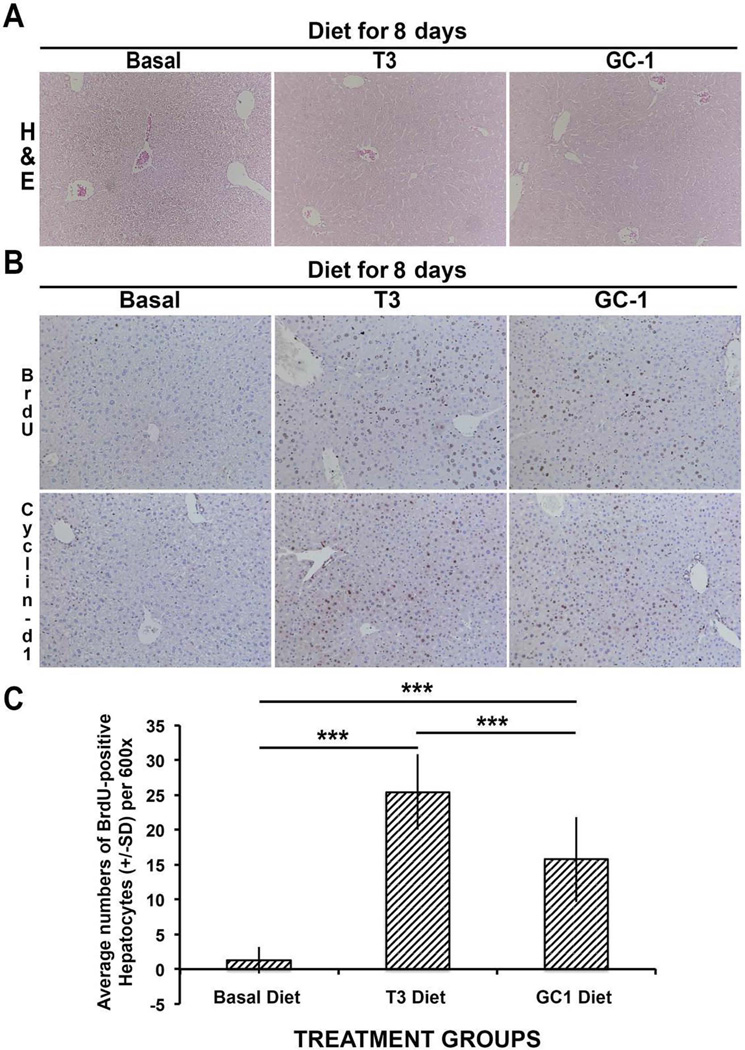
Differences between the mode of drug delivery plus the finding of lower basal level of proliferating cells in the DMSO group prompted us to compare hepatocyte proliferation in mice administered T3 and GC-1 via supplemented diets. Normal male mice were fed regular rodent chow, T3-supplemented (4 mg/kg of diet) chow, or GC-1-supplemented (5 mg/kg of diet) chow for 8 days. As with GC-1 IP injection, no histological changes in the livers were observed after GC-1 or T3 feeding as compared to the control basal diet (Fig. 3A). Mice fed T3- or GC-1-supplemented diets showed increased BrdU incorporation when compared to basal diet-fed controls (Fig. 3B). Cyclin D1 staining in hepatocytes was increased in both groups as compared to basal diet (Fig. 3B).
Figure 3.
Increased hepatocyte proliferation in wild-type mice fed T3-supplemented (4 mg/kg) and GC-1-supplemented (5 mg/kg) diets. (A) Similar hepatic histology is observed in H&E-stained sections in basal diet-, T3 diet-, and GC diet-fed mice as shown in representative images from all three groups (100×). (B) Immunohistochemistry shows increased BrdU incorporation and increased nuclear cyclin D1 in both T3 diet- and GC-1 diet-fed groups when compared to basal diet-fed animals (100×). (C) Bar graphs showing average number of BrdU-positive hepatocyte nuclei per HPF (600×) in different conditions. Ten HPFs were counted for each group. T3- and GC-1-fed animals had significantly more BrdU-positive hepatocyte nuclei than basal diet GC-1-fed mice (***p < 0.001). Interestingly, a significant difference in hepatocyte proliferation was also evident between the T3 diet- and GC-1-diet fed mice (***p < 0.001).
However, when BrdU-positive hepatocytes were counted, we continued to observe a significant difference in BrdU incorporation between T3 versus GC-1 diet groups (Fig. 3C), although the discrepancy was less than what was observed in T3 diet-fed versus GC-1-injected group. Thus, GC-1 induces hepatocyte proliferation via β-catenin activation and cyclin D1 expression, although to modestly less extent than T3.
Presence of β-Catenin Is Required for Significant Level of Proliferation in Response to TRβ Agonist GC-1
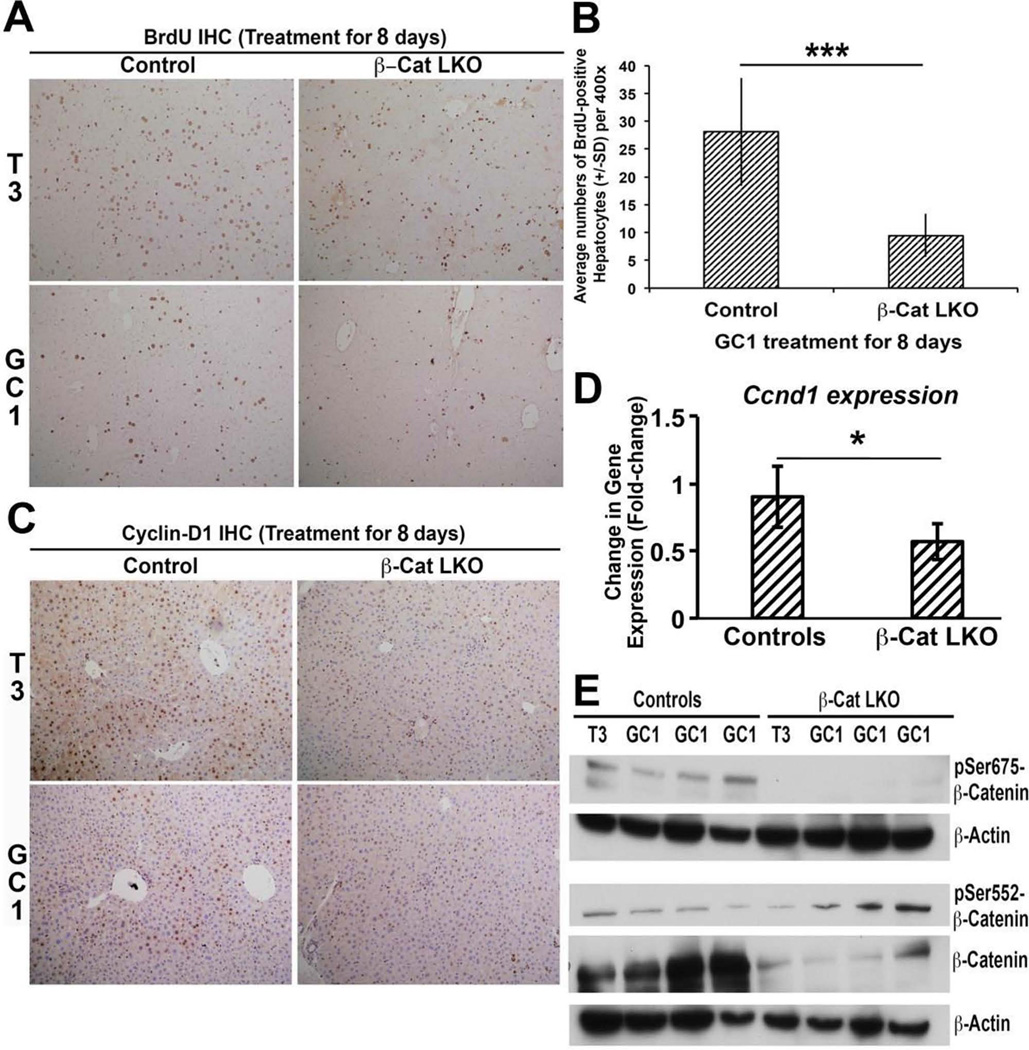
Since the T3 hormone has been shown to require β-catenin to exert mitogenic effect in mouse hepatocytes14, we next asked whether the action of selective TRβ agonist would similarly be dependent on β-catenin. β-Cat-LKO mice and wild-type littermate controls received eight daily IP injections of GC-1 (0.3 mg/kg/dose) or DMSO alone (control) as described in the Materials and Methods section. Like T3, GC-1-treated β-cat-LKO mice showed decreased hepatocyte proliferation as shown by low BrdU incorporation in hepatocytes in β-cat-LKO as compared to controls (Fig. 4A and B). However, notable BrdU incorporation continued to occur in the nonparenchymal cell (NPC) population in the β-cat-LKO group after GC-1 administration. Both of these findings were similar to those observed after T3 administration to β-cat-LKO14.
Figure 4.
β-Catenin in hepatocytes is required for GC-1-induced hepatocyte proliferation. (A) Immunohistochemistry for BrdU shows decreased staining in T3 diet-fed and GC-1-injected β-cat-LKO mice as compared to control mice. As shown in previous work, there is increased proliferation in control mice fed T3 diet (100×). (B) Bar graphs showing average number of BrdU-positive hepatocyte nuclei per HPF (400×) in GC-1-injected β-cat-LKO as compared to control mice. A total 10 HPFs per group were counted. A significant difference in hepatocyte proliferation was observed between the two groups (***p < 0.001). (C) Immunohistochemistry for cyclin D1 shows increased staining in the livers of littermate control mice that received T3 or GC-1 as compared to notably less staining in β-cat-LKO mice (100×). (D) Real-time PCR shows significant decrease in mRNA expression of cyclin D1 in GC-1-injected β-catenin-LKO mice as compared to littermate controls (one-tailed t-test, *p < 0.05). (E) Representative Western blots using liver lysates from β-cat-LKO and controls after treatment with T3 or GC-1. As expected, β-catenin and pSer675-β-catenin levels are absent or low. Interestingly, pSer552-β-catenin levels are similar to wild-type or slightly increased.
Consistent with the lack of optimum BrdU response to GC-1, the β-cat-LKO livers also showed a notable decrease in nuclear cyclin D1 by immunohistochemistry when compared to controls, similar to that observed in response to T3 (Fig. 4C). This was verified by RT-PCR analysis, which showed a significant decrease in cyclin D1 mRNA expression in β-cat-LKO mice receiving GC-1 compared to controls (Fig. 4D).
Last, we wanted to address the status of PKA-dependent serine phosphorylation of β-catenin in β-cat-LKO following GC-1 and T3 treatment. Western blot analysis using liver lysates from β-cat-LKO and control mice treated with T3 or GC-1 showed notably lower total β-catenin in KO, which represents continued β-catenin expression in the NPCs, as also noted elsewhere12 (Fig. 4E). As expected, pSer675-β-catenin was absent in β-cat-LKO as compared to controls treated with GC-1 or T3. Intriguingly though, we found that β-cat-LKO mice that received T3 or GC-1 showed even higher levels of pSer552-β-catenin levels as compared to controls subjected to similar treatment (Fig. 4E). These findings suggest a divergence in PKA-dependent β-catenin activation in response to T3 or GC-1 in hepatocytes versus NPCs that may eventually be contributing to their overall mitogenic response in the liver.
Lack of Hepatocyte Proliferation in Response to Both T3 and GC-1 Upon Disruption of Wnt-β–Catenin Axis in the Hepatocytes
Previous work and our observations thus far show that like T3, GC-1 also increases phosphorylation of β-catenin at Ser675. We aimed to further substantiate these results and directly investigate if Wnt-dependent β-catenin activation could be contributing to the overall mitogenic effect of T3 and GC-1. For this, we utilized LRP5-6-LKO mice that lack the two redundant Wnt coreceptors (LRP5 and LRP6). These mice, unlike β-cat-LKO, have intact β-catenin in hepatocytes; however, the absence of Wnt coreceptors disallows β-catenin activation in hepatocytes in response to Wnt secretion14.
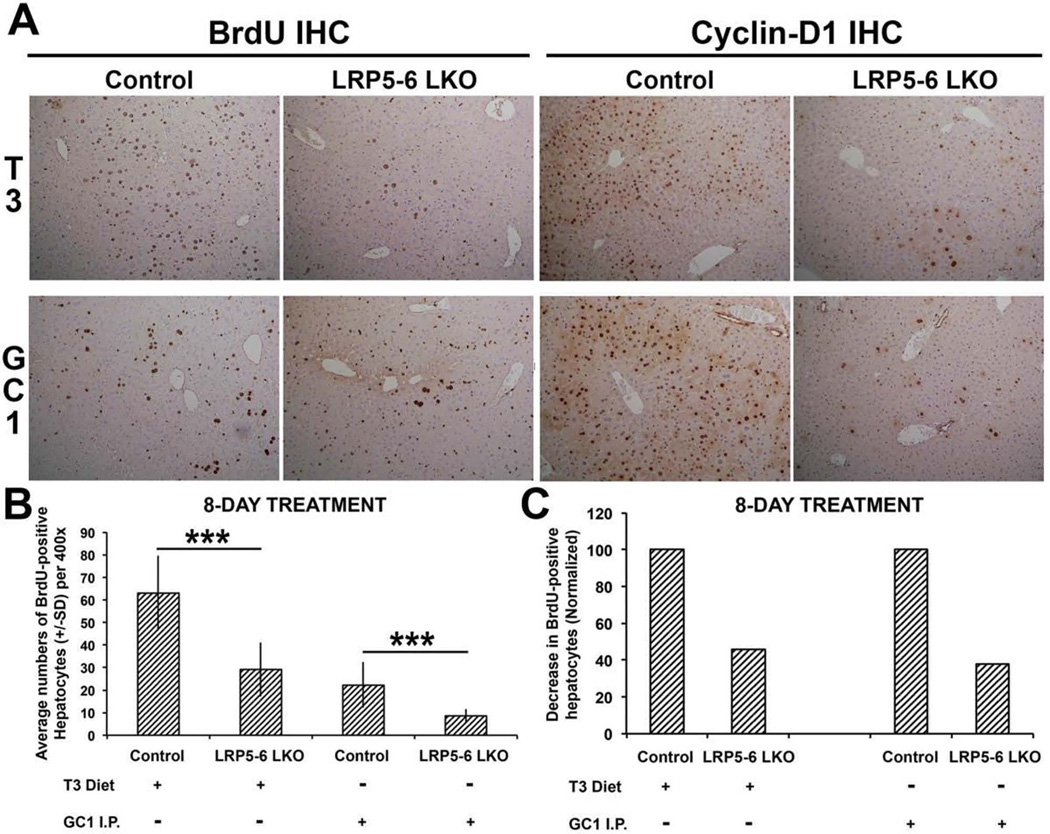
LRP5-6-LKO male mice and littermate controls aged 2–3 months received either T3-supplemented diet (4 mg/kg of diet) or regular control diet. Another cohort received eight daily IP injections of GC-1 (0.3 mg/kg/dose) or DMSO. Interestingly, LRP5-6-LKO mice treated with either T3 or GC-1 showed a notable decrease in the number of BrdU-labeled hepatocyte nuclei when compared with the controls (Fig. 5A). A careful counting of the BrdU-positive hepatocytes verified a significant difference in hepatocyte proliferation in response to T3 and GC-1 as compared to controls (Fig. 5B), and occurred with the same profoundness in response to T3 or GC-1 in the absence of LRP5-6 in hepatocytes (Fig. 5C). Likewise, the numbers of cyclin D1-positive hepatocytes were also notably decreased in LRP5-6-LKO in response to T3 and GC-1 as shown by immunohistochemistry (Fig. 5A).
Figure 5.
T3- and GC-1-induced proliferation is blunted in the absence of redundant Wnt coreceptors LRP5-6 in hepatocytes. (A) BrdU and cyclin D1 immunohistochemistry shows decreased staining of hepatocytes in LRP5-6-LKO as compared to littermate controls in response to T3 and GC-1 administration. Continued staining of smaller nonparenchymal cells is observed in controls and LRP5-6-LKO in response to T3 and GC-1 (100×). (B) Bar graph shows a significant decrease in the number of hepatocytes displaying BrdU-positive nuclei per HPF (400×) in the liver sections of LRP5-6 versus controls in response to T3 and GC-1 (***p < 0.001). (C) Normalizing BrdU counts to their respective controls show that LRP5-6-LKO shows comparably reduced percentage of hepatocyte labeling in response to T3 and GC-1.
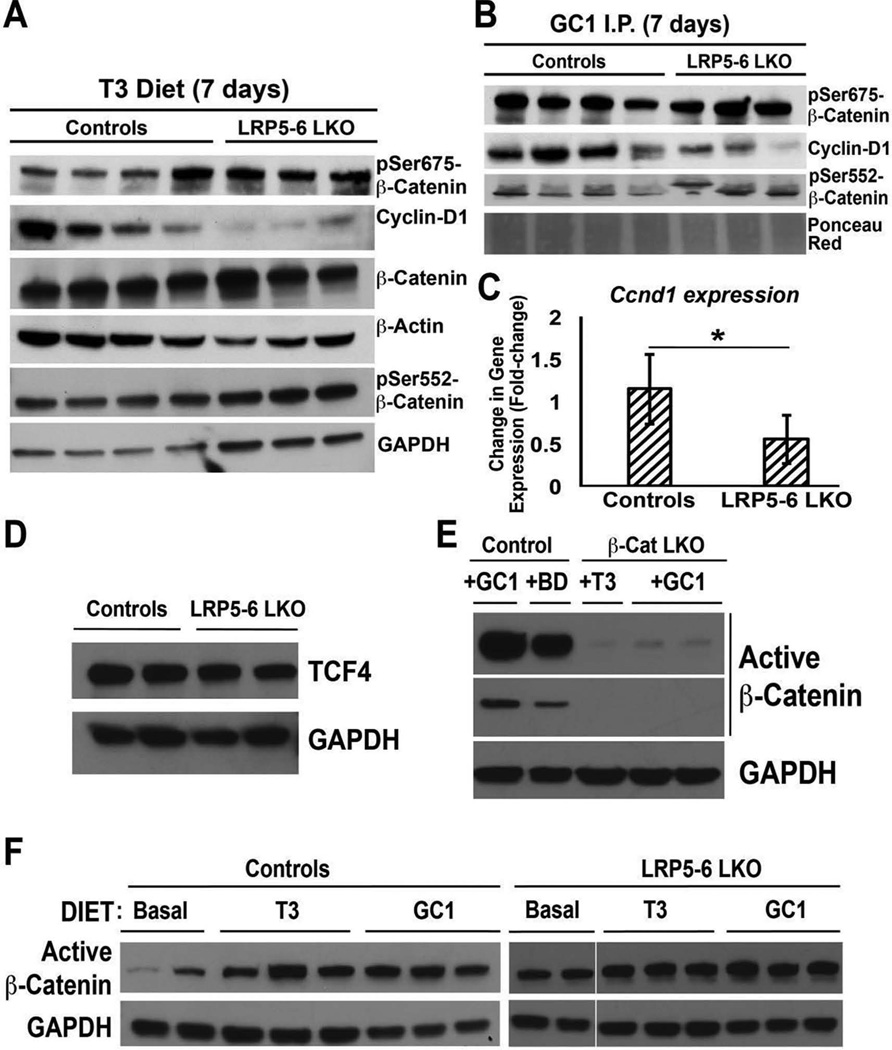
Next, we wanted to explore the mechanism of this rather unexpected finding. First, we wanted to verify if β-catenin levels were any different in LRP5-6-LKO. As expected and also reported elsewhere, we found comparable levels of total β-catenin in LRP5-6-LKO in the control and T3 group (Fig. 6A) and GC-1 group (not shown). Further, in agreement with immunohistochemistry findings (Fig. 5A), LRP5-6-LKO showed decreased cyclin D1 protein and mRNA expression in response to both T3 and GC-1 by Western blots as well (Fig. 6A–C and not shown). Interestingly, either comparable or even greater levels of pSer675-β-catenin were evident in LRP5-6-LKO and littermate controls treated with GC-1 and T3 (Fig. 6A and B). We continued to see a modest increase in the levels of pSer552-β-catenin in LRP5-6-LKO after both T3 and GC-1 (Fig. 6A and B).
Figure 6.
T3 and GC-1 induce β-catenin activation via both PKA and Wnt signaling. (A) Representative Western blots showing comparable total β-catenin levels in liver lysates from controls and LRP5-6 administered T3 diet for 8 days. Despite increased levels of pSer675-β-catenin and pSer552-β-catenin, decreased cyclin D1 was evident in the LRP5-6-LKO group. GAPDH and β-actin were loading controls. (B) Representative Western blots showing comparable total β-catenin levels in liver lysates from controls and LRP5-6 injected with GC-1 for 8 days. Despite comparably high levels of pSer675-β-catenin and even greater pSer552-β-catenin levels in LRP5-6-LKO liver lysates, cyclin D1 levels were notably lower in this group. Ponceau Red shows comparable loading in all lanes. (C) RT-PCR shows reduced mRNA expression of cyclin D1 gene in the livers from GC-1-injected LRP5-6-LKO as compared to controls (one-tailed t-test, *p < 0.05). (D) Western blot shows comparable levels of TCF4 in the liver lysates of LRP5-6-LKO and littermate control livers. GAPDH shows equal loading in all lanes. (E) Representative Western blot shows that 8 days of GC-1 diet fed to animals leads to notably increased levels of active β-catenin (upper panel, darker exposure; lower panel, lighter exposure). Liver lysates from T3 or GC-1 administered β-cat-LKO show very low levels of active β-catenin, presumably from the nonparenchymal cells. GAPDH represents comparable loading in all lanes. (F) Representative Western blot shows notable increase in active β-catenin levels in liver lysates from control littermates administered T3 or GC-1 for 8 days as compared to basal diet. However, comparable levels of active β-catenin were observed in LRP5-6-LKO liver lysates fed basal diet or administered T3 or GC-1 diet for 8 days. GAPDH depicts equal loading in each lane.
Because cyclin D1 expression is regulated by β-catenin interaction with transcription factor TCF4, we next queried the liver lysates from the LRP5-6-LKO for the levels of TCF4. Comparable levels of total TCF4 were evident in the LRP- LKO and controls (Fig. 6D).
Since β-catenin-LKO and LRP5-6-LKO both are refractory to T3 and GC-1 treatment in terms of hepatocyte proliferation due to impaired cyclin D1 induction, we next wanted to determine if intact Wnt signaling is also contributing to β-catenin activation in addition to PKA-dependent β-catenin activation as evident by increased pSer675-β-catenin. For this, we used antibody against active β-catenin (hypophosphorylated at Ser33, Ser37, and Thr41). To check the specificity of this antibody, we used liver lysates from β-cat-LKO and controls treated with T3, GC-1, or basal diet. A notable increase in active-β-catenin was evident in the GC-1-treated group as compared to basal diet (Fig. 6E). A very faint signal presumably due to NPCs was evident in β-cat-LKO after T3 or GC-1 treatment, indicating the specificity of the antibody (Fig. 6E). We next determined if intact Wnt signaling is required to activate β-catenin in hepatocytes after T3 or GC-1 treatment. A dramatic increase in active β-catenin levels was evident in liver lysates of control mice fed T3 or GC-1 diet for 8 days as compared to basal diet-fed mice (Fig. 6F). However, no notable differences in active β-catenin levels were evident in LRP5-6-LKO after T3 or GC-1 feeding when compared to basal diet (Fig. 6F).
Taken together, these findings suggest that hepatocyte proliferation in response to both T3 and GC-1 may eventually be a net result of PKA- and Wnt-dependent β-catenin activation.
Pretreatment With T3- or GC-1-Supplemented Diet Prior to Partial Hepatectomy Leads to a Proliferative Advantage at 24 h Posthepatectomy in Mice
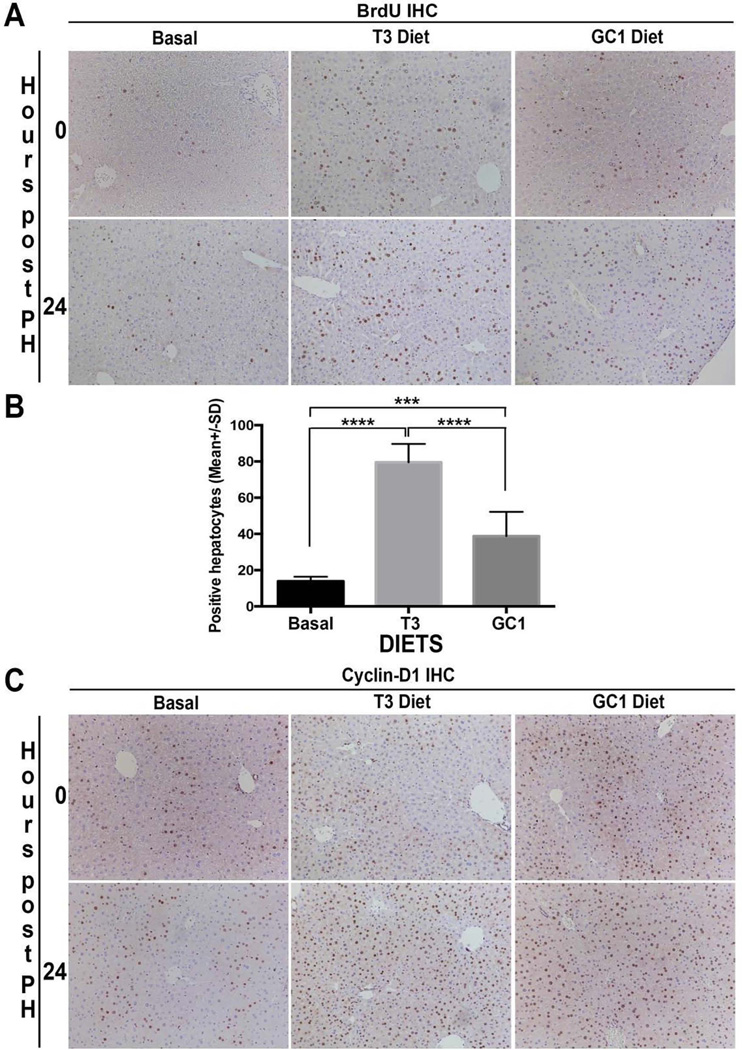
To directly investigate any significance of T3 or GC-1 in hepatic regenerative therapies, we next explored their usage in partial hepatectomy model. Since the kinetics of hepatocyte proliferation during liver regeneration after partial hepatectomy in C57BL/6 mice are well known, we queried if T3 or GC-1 pretreatment of mice offers any regenerative advantage in the setting of partial hepatectomy, a procedure relevant in patients as well. Two-month-old C57BL/6 mice were put on T3 diet, GC-1 diet, or kept on basal diet for 7 days with drinking water containing BrdU ad libitum. On day 7, all mice were subjected to two thirds hepatectomy, and resected lobes were retained for analysis for BrdU and cyclin D1 by immunohistochemistry. Hepatectomized mice from all three groups were sacrificed 24 h later, a time point around 12–16 h prior to the observed peak hepatocyte proliferation23,24. Livers from the 24-h time point were assessed for BrdU incorporation in hepatocytes and cyclin D1 by immunohistochemistry. Seven-day pretreatment of mice with either T3 or GC-1 led to increased BrdU-positive hepatocytes as compared to basal diet as observed in the analysis of resected lobes (Fig. 7A). Interestingly, while very few hepatocytes showed BrdU-positive nuclei at 24 h after hepatectomy in mice fed basal diet, a pronounced increase was observed in T3- as well as GC-1-fed group of animals (Fig. 7A). In fact, the numbers of hepatocytes positive for nuclear BrdU were significantly higher in T3- and GC-1-fed mice versus basal diet (Fig. 7B). Interestingly, however, T3 pretreatment showed significantly greater hepatocyte proliferative response than GC-1 posthepatectomy (Fig. 7B).
Figure 7.
Increased hepatocyte proliferation and cyclin D1 expression after partial hepatectomy in mice pretreated with T3- or GC-1-supplemented diet for 8 days. (A) Immunohistochemistry for BrdU shows increased numbers of hepatocyte staining positive after 8 days of T3 or GC-1 feeding ad libitum as compared to mice fed basal diet. The analysis was carried out in lobes that were surgically removed at the time of hepatectomy (time 0). A further increase in BrdU staining was evident in regenerating livers at 24 h in animals that were maintained on T3 or GC-1 diet postsurgery as compared to the group fed basal diet after surgery (100×). (B) Bar graph shows a significant increase in the number of BrdU-positive hepatocytes at 24 h after hepatectomy in the control diet-fed group versus T3 diet-fed group (****p < 0.0001) and control diet-fed group versus GC-1 diet-fed group (***p < 0.001). Further, a significant difference was also observed between the T3- and GC-1-fed group (****p < 0.0001). (C) Immunohistochemistry for cyclin D1 shows increased numbers of hepatocyte staining positive after 8 days of T3 or GC-1 feeding ad libitum as compared to mice fed basal diet. The analysis was carried in lobes that were surgically removed at the time of hepatectomy (time 0). A further increase in cyclin D1 staining was evident in regenerating livers at 24 h in animals that were maintained on T3 or GC-1 diet postsurgery as compared to the group fed basal diet after surgery (100×).
We next assessed cyclin D1 in the same groups by immunohistochemistry. Cyclin D1 was restricted to a subset of midzonal hepatocytes in basal diet-fed mice in resected lobes as well as regenerating lobes at 24 h (Fig. 7C). An expansion of cyclin D1-positive hepatocytes in the midzonal area was evident in both T3 and GC-1 pretreatment livers in the resected lobes at the time of hepatectomy (Fig. 7C). However, at 24 h after hepatectomy, a panlobular distribution of hepatocytes with nuclear cyclin D1 was clearly evident in the livers from T3- as well as GC-1-treated mice. (Fig. 7C).
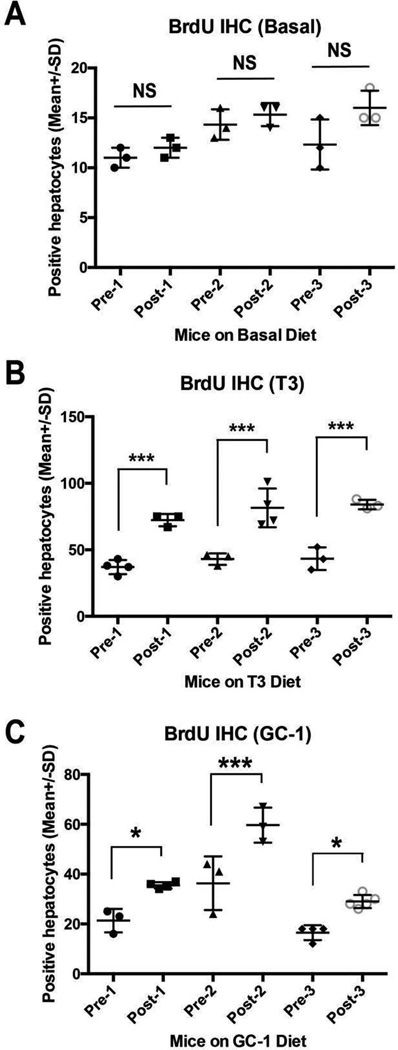
Finally, we queried change in BrdU incorporation longitudinally in the same animal in basal diet, T3, and GC-1 groups to address their relative efficacy in inducing hepatocyte proliferation over 24 h during liver regeneration. No significant differences were observed in hepatocyte proliferation between prehepatectomy and 24-h posthepatectomy livers in animals that were on basal diet (Fig. 8A). T3 induced significant increase in hepatocyte proliferation, which was around twofold over the 24-h liver regeneration period in all three mice tested (Fig. 8B). Similarly, GC-1 also induced a significant increase in hepatocyte proliferation of around twofold over its baseline within 24 h during liver regeneration in all three animals tested (Fig. 8C). Thus, both T3 and GC-1 pretreatment offered a regenerative advantage to the liver following surgical resection in mice.
Figure 8.
Increased hepatocyte proliferation after partial hepatectomy in mice pretreated with T3- or GC-1-supplemented diet for 8 days. (A) Bar graph showing no significant (NS) differences in the average number of number of BrdU-positive hepatocytes per 100× field in liver sections in three independent mice on basal diet at the time of hepatectomy (Pre-1–3) versus at 24 h after hepatectomy in the same animals (Post-1–3). (B) Bar graph showing significant differences (***p < 0.001) in the average number of number of BrdU-positive hepatocytes per 100× field in liver sections in three independent mice on T3 diet at the time of hepatectomy (Pre-1–3) versus at 24 h after hepatectomy in the same animals (Post-1–3). (C) Bar graph showing significant differences (*p < 0.05; ***p < 0.001) in the average number of number of BrdU-positive hepatocytes per 100× field in liver sections in three independent mice on GC-1 diet at the time of hepatectomy (Pre-1–3) versus at 24 h after hepatectomy in the same animals (Post-1–3).
DISCUSSION
In our current project, we further explore the idea that selective thyromimetics activating TRβ in the liver are effective in inducing hepatocyte proliferation. On the basis of the recently proposed mechanism for T3 action, we propose that hepatocyte proliferation induced by GC-1 is also dependent on the presence of β-catenin. Indeed, similar to previous work, our results show that GC-1 is capable of inducing β-catenin activation, which in turn increased cyclin D1 expression and eventually hepatocyte proliferation, when given either as an injection or as a diet. Intriguingly, GC-1 when delivered IP in DMSO showed lesser increases in hepatocyte proliferation than when delivered orally through diet. This was most likely due to the use of DMSO as a solvent for GC-1. This was strengthened by the observation that DMSO delivery by itself affected hepatocyte proliferation. Indeed, the role of DMSO in inhibiting hepatocyte proliferation, especially in cultures, has been known for a long time25. When GC-1 was administered to mice via diet, hepatocyte proliferation was increased to a notably greater extent, although it was less so than that induced with T3 diet. This could be due to the dose of GC-1 in diet or other unknown mechanisms, especially since a previous study has reported comparable efficacy of T3 and GC-1 in inducing hepatocyte proliferation7. Nonetheless, GC-1 administration caused profound increase in hepatocyte proliferation.
Our study also focuses on further elucidating the mechanism by which T3 and selective thyromimetics cause hepatocyte proliferation. In order to identify if β-catenin is also required for the actions of GC-1, we administered GC-1 to β-cat-LKO mice and controls. Our results showed that similar to T3, there was a significant decrease in proliferation in response to GC-1 when β-catenin is absent from hepatocytes. This occurred concomitant to lack of cyclin D1 increase in hepatocytes, which is a known β-catenin target12. To further try and characterize the mechanism of β-catenin activation by the thyromimetics like T3 and GC-1, we next used a mouse model that has conditional loss of Wnt coreceptors LRP5 and LRP6 in hepatocytes and has been described by us recently22. In the absence of these coreceptors, Wnt is unable to transduce its signal to β-catenin26. However, β-catenin is present in hepatocytes and hence may be capable of being activated by non-Wnt mechanisms. On the basis of the previously proposed mechanism involving PKA-dependent phosphorylation of β-catenin, our expectation was that treatment of LRP5-6-LKO mice with T3 or GC-1 would result in a similar degree of hepatocyte proliferation when compared to the control mice. Intriguingly, our results show that LRP5-6-LKO mice have significantly reduced hepatocyte proliferation in response to T3 or GC-1 when compared to controls along with decreased cyclin D1 in hepatocyte nuclei.
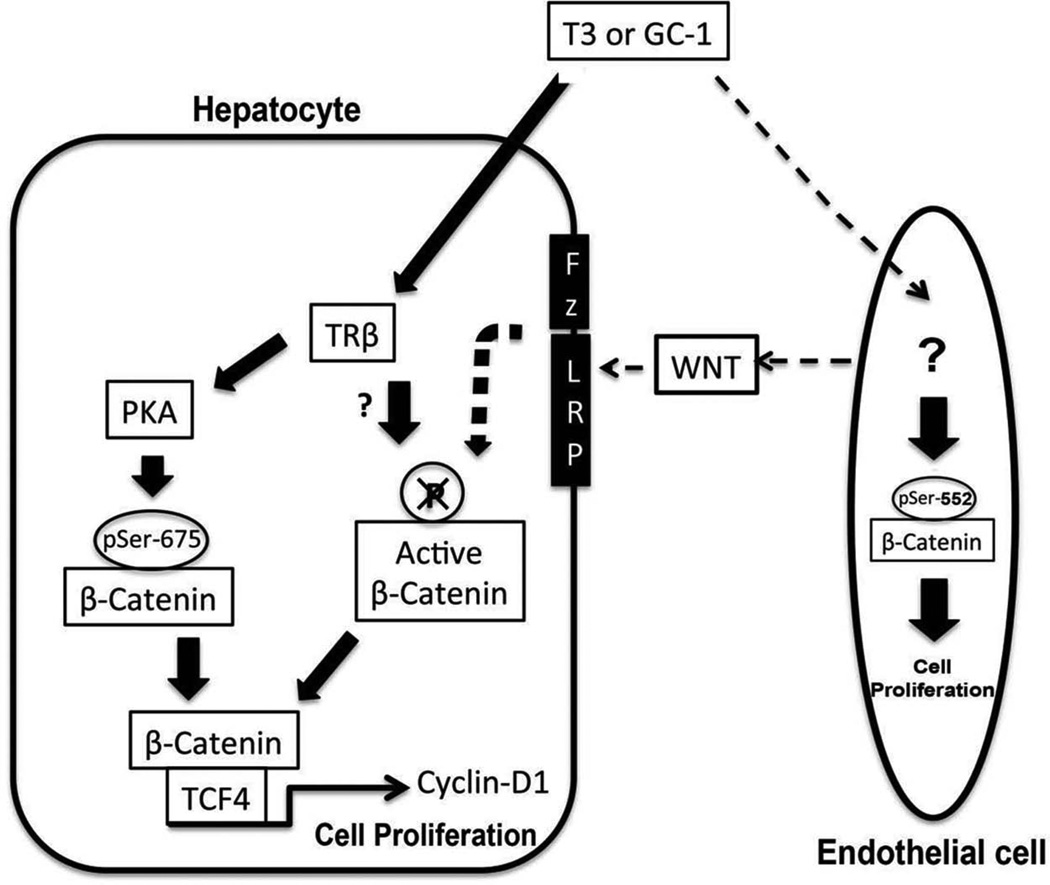
Furthermore, this occurred despite comparable levels of TCF4 and equally increased levels of pSer675-β-catenin in LRP5-6-LKO mice. This suggests that T3- and GC-1-induced β-catenin activation brought about via PKA activation is intact in the absence of LRP5-6 in hepatocytes. To address the discrepancy of low regenerative response in LRP5-6-LKO following GC-1 and T3, we revisited the effect of these factors on canonical Wnt signaling. In our previous publication, we examined the effect of T3 on Wnt-dependent β-catenin activation by only assessing any changes in levels of Ser9-GSK3β14. However, this particular phosphorylation site at GSK3β has been shown to be inconsequential in Wnt signaling and only relevant in insulin signaling27. In the current study we used an antibody that detects β-catenin, which is hypophosphorylated at Ser33, Ser37, and Thr41, which is a direct consequence of Wnt signaling28. We first verified the specificity of this antibody using β-cat-LKO. Further, we observed a notable increase in active-β-catenin levels following GC-1 treatment in normal animals. In the absence of LRP5-6 on hepatocytes, there was a failure of any increase in active-β-catenin levels in response to T3 and GC-1. These findings suggest that T3 and TRβ agonists require intact Wnt signaling as well as PKA to allow for optimal β-catenin activation and hepatocyte proliferation (Fig. 9).
Figure 9.
Mechanism of T3/GC-1-induced β-catenin activation leading to cyclin D1 expression and cell proliferation. In hepatocytes, T3/GC-1 appears to activate β-catenin via PKA-dependent mechanism as well as through canonical Wnt signaling. It is likely that T3/GC-1 may induce β-catenin activation in endothelial cells to induce cell proliferation and also may stimulate Wnt release to activate β-catenin in hepatocytes in a paracrine fashion.
A relevant question that remains is how does T3 or GC-1 cause Wnt-dependent β-catenin activation? Previous studies in liver regeneration after partial hepatectomy, including ours, have shown that the NPCs such as sinusoidal endothelial cells and macrophages are the source of Wnts, which activate β-catenin in hepatocytes in a paracrine manner22,29. We have observed NPC proliferation in response to T3 and GC-1. It is an intriguing possibility that the thyromimetics may also be contributing to β-catenin activation and hepatocyte proliferation indirectly by inducing Wnt secretion from NPCs (Fig. 9), although this will need to be investigated directly.
Finally, we also made another unexpected observation. We observed an increase in the levels of pSer552-β-catenin in β-cat-LKO and LRP5-6-LKO mice following treatment with T3 and GC-1. As published elsewhere, this site can also lead to β-catenin activation15. Intriguingly though, this increase was evident even in livers that lacked β-catenin in hepatocytes, and hence this observation most likely represents β-catenin phosphorylation and activation in the NPCs of the liver following GC-1 and T3 treatment. The relevance of this observation requires further investigation, but it is conceivable that T3 and GC-1 may be stimulating proliferation of NPCs such as endothelial cells by β-catenin activation through phosphorylation at Ser552.
Also, thyromimetics may induce release of Wnt proteins from endothelial cells, which could then eventually contribute to endothelial cell proliferation in an autocrine manner and to hepatocyte proliferation in a paracrine fashion through stimulation of the canonical Wnt signaling pathway (Fig. 9).
The last part of our study directly investigated whether pretreatment with T3 or GC-1 prior to partial hepatectomy would confer a regenerative advantage to mice. The effect of T3 on liver regeneration has been examined in rats previously, and those results did show a regenerative advantage after partial hepatectomy, and a survival advantage in a 90% hepatectomy model, which is normally associated with high mortality30. Our results show significantly increased BrdU incorporation in hepatocytes 24 h after partial hepatectomy in mice that received T3- or GC-1-supplemented diet for 8 days prior to the surgery. Even though this is a non lethal model and mouse livers typically regenerate within 14 days, we show a clear and robust regenerative response following T3 or GC-1 preadministration. This was again due to increased expression of cyclin D1. This part of the study demonstrates the direct relevance of administration of thyromimetics in the setting of liver transplantation to induce regeneration in the donor and/or recipient.
In conclusion, we have shown that like T3, GC-1 causes pronounced hepatocyte proliferation secondary to increased cyclin D1 expression that is dependent on activation of β-catenin. We also found that disrupting Wnt signaling abolishes GC-1- and T3-dependent β-catenin activation. We further validate the efficacy of these agents to induce hepatocyte proliferation and eventually stimulate the process of liver regeneration, which has significant therapeutic implications in the transplantation settings.
Acknowledgments
This study was funded by NIH grants 1R01DK62277 and 1R01DK100287 and Endowed Chair for Experimental Pathology to S.P.S.M., and by grants from Associazione Italiana Ricerca sul Cancro (grant IG-15279 to A.C.), Regione Autonoma Sardegna 2012, and Fondazione Banco di Sardegna (to A.C.).
REFERENCES
- 1.Karp SJ. Clinical implications of advances in the basic science of liver repair and regeneration. Am J Transplant. 2009;9:1973–1980. doi: 10.1111/j.1600-6143.2009.02731.x. [DOI] [PubMed] [Google Scholar]
- 2.Monga SP. Role and regulation of beta-catenin signaling during physiological liver growth. Gene Expr. 2014;16:51–62. doi: 10.3727/105221614X13919976902138. [DOI] [PMC free article] [PubMed] [Google Scholar]
- 3.Monga SP. Beta-catenin signaling and roles in liver homeostasis, injury, and tumorigenesis. Gastroenterology. 2015;148:1294–1310. doi: 10.1053/j.gastro.2015.02.056. [DOI] [PMC free article] [PubMed] [Google Scholar]
- 4.Goessling W, North TE, Lord AM, Ceol C, Lee S, Weidinger G, Bourque C, Strijbosch R, Haramis AP, Puder M, Clevers H, Moon RT, Zon LI. APC mutant zebrafish uncover a changing temporal requirement for Wnt signaling in liver development. Dev Biol. 2008;320:161–174. doi: 10.1016/j.ydbio.2008.05.526. [DOI] [PubMed] [Google Scholar]
- 5.Nejak-Bowen KN, Thompson MD, Singh S, Bowen WC, Jr, Dar MJ, Khillan J, Dai C, Monga SP. Accelerated liver regeneration and hepatocarcinogenesis in mice overexpressing serine-45 mutant beta-catenin. Hepatology. 2010;51:1603–1613. doi: 10.1002/hep.23538. [DOI] [PMC free article] [PubMed] [Google Scholar]
- 6.Apte U, Singh S, Zeng G, Cieply B, Virji MA, Wu T, Monga SP. Beta-catenin activation promotes liver regeneration after acetaminophen-induced injury. Am J Pathol. 2009;175:1056–1065. doi: 10.2353/ajpath.2009.080976. [DOI] [PMC free article] [PubMed] [Google Scholar]
- 7.Kowalik MA, Perra A, Pibiri M, Cocco MT, Samarut J, Plateroti M, Ledda-Columbano GM, Columbano A. TRbeta is the critical thyroid hormone receptor isoform in T3-induced proliferation of hepatocytes and pancreatic acinar cells. J Hepatol. 2010;53:686–692. doi: 10.1016/j.jhep.2010.04.028. [DOI] [PubMed] [Google Scholar]
- 8.Ledda-Columbano GM, Molotzu F, Pibiri M, Cossu C, Perra A, Columbano A. Thyroid hormone induces cyclin D1 nuclear translocation and DNA synthesis in adult rat cardiomyocytes. FASEB J. 2006;20:87–94. doi: 10.1096/fj.05-4202com. [DOI] [PubMed] [Google Scholar]
- 9.Tutton PJ. The influence of thyroidectomy and of triiodothyronine administration on epithelial cell proliferation in the jejunum of rat. Virchows Arch B Cell Pathol. 1976;20:139–142. doi: 10.1007/BF02890334. [DOI] [PubMed] [Google Scholar]
- 10.Leoni VP, Ledda-Columbano GM, Pibiri M, Saliba C, Perra A, Kowalik MA, Grober OM, Ravo M, Weisz A, Locker J, Ghiso E, Giordano S, Columbano A. Expression of c-jun is not mandatory for mouse hepatocyte proliferation induced by two nuclear receptor ligands: TCPOBOP and T3. J Hepatol. 2011;55:1069–1078. doi: 10.1016/j.jhep.2011.02.016. [DOI] [PubMed] [Google Scholar]
- 11.Pibiri M, Ledda-Columbano GM, Cossu C, Simbula G, Menegazzi M, Shinozuka H, Columbano A. Cyclin D1 is an early target in hepatocyte proliferation induced by thyroid hormone (T3) FASEB J. 2001;15:1006–1013. doi: 10.1096/fj.00-0416com. [DOI] [PubMed] [Google Scholar]
- 12.Tan X, Behari J, Cieply B, Michalopoulos GK, Monga SP. Conditional deletion of beta-catenin reveals its role in liver growth and regeneration. Gastroenterology. 2006;131:1561–1572. doi: 10.1053/j.gastro.2006.08.042. [DOI] [PubMed] [Google Scholar]
- 13.Torre C, Benhamouche S, Mitchell C, Godard C, Veber P, Letourneur F, Cagnard N, Jacques S, Finzi L, Perret C, Colnot S. The transforming growth factor-alpha and cyclin D1 genes are direct targets of beta-catenin signaling in hepatocyte proliferation. J Hepatol. 2011;55:86–95. doi: 10.1016/j.jhep.2010.10.021. [DOI] [PubMed] [Google Scholar]
- 14.Fanti M, Singh S, Ledda-Columbano GM, Columbano A, Monga SP. Tri-iodothyronine induces hepatocyte proliferation by protein kinase A-dependent beta-catenin activation in rodents. Hepatology. 2014;59:2309–2320. doi: 10.1002/hep.26775. [DOI] [PMC free article] [PubMed] [Google Scholar]
- 15.Taurin S, Sandbo N, Qin Y, Browning D, Dulin NO. Phosphorylation of beta-catenin by cyclic AMP-dependent protein kinase. J Biol Chem. 2006;281:9971–9976. doi: 10.1074/jbc.M508778200. [DOI] [PubMed] [Google Scholar]
- 16.Boelen A, Kwakkel J, Fliers E. Thyroid hormone receptors in health and disease. Minerva Endocrinol. 2012;37:291–304. [PubMed] [Google Scholar]
- 17.Brent GA. Mechanisms of thyroid hormone action. J Clin Invest. 2012;122:3035–3043. doi: 10.1172/JCI60047. [DOI] [PMC free article] [PubMed] [Google Scholar]
- 18.Chiellini G, Apriletti JW, Yoshihara HA, Baxter JD, Ribeiro RC, Scanlan TS. A high-affinity subtype-selective agonist ligand for the thyroid hormone receptor. Chem Biol. 1998;5:299–306. doi: 10.1016/s1074-5521(98)90168-5. [DOI] [PubMed] [Google Scholar]
- 19.Cable EE, Finn PD, Stebbins JW, Hou J, Ito BR, van Poelje PD, Linemeyer DL, Erion MD. Reduction of hepatic steatosis in rats and mice after treatment with a liver-targeted thyroid hormone receptor agonist. Hepatology. 2009;49:407–417. doi: 10.1002/hep.22572. [DOI] [PubMed] [Google Scholar]
- 20.Johansson L, Rudling M, Scanlan TS, Lundasen T, Webb P, Baxter J, Angelin B, Parini P. Selective thyroid receptor modulation by GC-1 reduces serum lipids and stimulates steps of reverse cholesterol transport in euthyroid mice. Proc Natl Acad Sci USA. 2005;102:10297–10302. doi: 10.1073/pnas.0504379102. [DOI] [PMC free article] [PubMed] [Google Scholar]
- 21.Perra A, Simbula G, Simbula M, Pibiri M, Kowalik MA, Sulas P, Cocco MT, Ledda-Columbano GM, Columbano A. Thyroid hormone (T3) and TRbeta agonist GC-1 inhibit/reverse nonalcoholic fatty liver in rats. FASEB J. 2008;22:2981–2989. doi: 10.1096/fj.08-108464. [DOI] [PubMed] [Google Scholar]
- 22.Yang J, Mowry LE, Nejak-Bowen KN, Okabe H, Diegel CR, Lang RA, Williams BO, Monga SP. beta-catenin signaling in murine liver zonation and regeneration: A Wnt-Wnt situation! Hepatology. 2014;60:964–976. doi: 10.1002/hep.27082. [DOI] [PMC free article] [PubMed] [Google Scholar]
- 23.Fausto N. Liver regeneration. J Hepatol. 2000;32:19–31. doi: 10.1016/s0168-8278(00)80412-2. [DOI] [PubMed] [Google Scholar]
- 24.Michalopoulos GK. Principles of liver regeneration and growth homeostasis. Compr Physiol. 2013;3:485–513. doi: 10.1002/cphy.c120014. [DOI] [PubMed] [Google Scholar]
- 25.Chan K, Kost DP, Michalopoulos G. Multiple sequential periods of DNA synthesis and quiescence in primary hepatocyte cultures maintained on the DMSO-EGF on/off protocol. J Cell Physiol. 1989;141:584–590. doi: 10.1002/jcp.1041410317. [DOI] [PubMed] [Google Scholar]
- 26.Riddle RC, Diegel CR, Leslie JM, Van Koevering KK, Faugere MC, Clemens TL, Williams BO. Lrp5 and Lrp6 exert overlapping functions in osteoblasts during postnatal bone acquisition. PLoS One. 2013;8:e63323. doi: 10.1371/journal.pone.0063323. [DOI] [PMC free article] [PubMed] [Google Scholar]
- 27.McManus EJ, Sakamoto K, Armit LJ, Ronaldson L, Shpiro N, Marquez R, Alessi DR. Role that phosphorylation of GSK3 plays in insulin and Wnt signalling defined by knockin analysis. EMBO J. 2005;24:1571–1583. doi: 10.1038/sj.emboj.7600633. [DOI] [PMC free article] [PubMed] [Google Scholar]
- 28.Villar J, Cabrera NE, Valladares F, Casula M, Flores C, Blanch L, Quilez ME, Santana-Rodriguez N, Kacmarek RM, Slutsky AS. Activation of the Wnt/beta-catenin signaling pathway by mechanical ventilation is associated with ventilator-induced pulmonary fibrosis in healthy lungs. PLoS One. 2011;6:e23914. doi: 10.1371/journal.pone.0023914. [DOI] [PMC free article] [PubMed] [Google Scholar]
- 29.Ding BS, Nolan DJ, Butler JM, James D, Babazadeh AO, Rosenwaks Z, Mittal V, Kobayashi H, Shido K, Lyden D, Sato TN, Rabbany SY, Rafii S. Inductive angiocrine signals from sinusoidal endothelium are required for liver regeneration. Nature. 2010;468:310–315. doi: 10.1038/nature09493. [DOI] [PMC free article] [PubMed] [Google Scholar]
- 30.Columbano A, Simbula M, Pibiri M, Perra A, Deidda M, Locker J, Pisanu A, Uccheddu A, Ledda-Columbano GM. Triiodothyronine stimulates hepatocyte proliferation in two models of impaired liver regeneration. Cell Prolif. 2008;41:521–531. doi: 10.1111/j.1365-2184.2008.00532.x. [DOI] [PMC free article] [PubMed] [Google Scholar]


