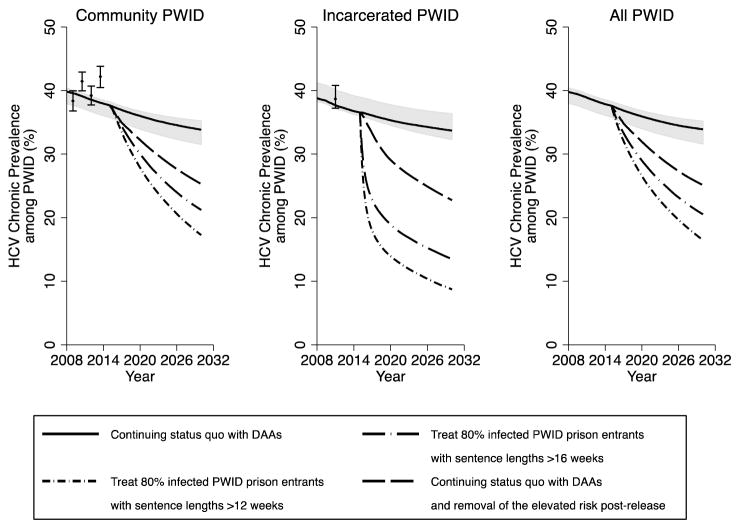
Figure 3. Impact of different prevention and treatment scenarios on chronic HCV prevalence over time in Scotland amongst community PWID, incarcerated PWID and all PWID.
Lines represent the median chronic HCV prevalence, with the shaded area representing the 95% CrI for the status quo projection (no scale-up) from 2015 onwards. HCV prevalence data points shown for comparison with 95% confidence intervals.

