

Abstract
IMPORTANCE
Coronary artery calcium (CAC) is associated with coronary heart disease (CHD) and cardiovascular disease (CVD); however, prognostic data on CAC are limited in younger adults.
OBJECTIVE
To determine if CAC in adults aged 32 to 46 years is associated with incident clinical CHD, CVD, and all-cause mortality during 12.5 years of follow-up.
DESIGN, SETTING, AND PARTICIPANTS
The Coronary Artery Risk Development in Young Adults (CARDIA) Study is a prospective community-based study that recruited 5115 black and white participants aged 18 to 30 years from March 25, 1985, to June 7, 1986. The cohort has been under surveillance for 30 years, with CAC measured 15 (n = 3043), 20 (n = 3141), and 25 (n = 3189) years after recruitment. The mean follow-up period for incident events was 12.5 years, from the year 15 computed tomographic scan through August 31, 2014.
MAIN OUTCOMES AND MEASURES
Incident CHD included fatal or nonfatal myocardial infarction, acute coronary syndrome without myocardial infarction, coronary revascularization, or CHD death. Incident CVD included CHD, stroke, heart failure, and peripheral arterial disease. Death included all causes. The probability of developing CAC by age 32 to 56 years was estimated using clinical risk factors measured 7 years apart between ages 18 and 38 years.
RESULTS
At year 15 of the study among 3043 participants (mean [SD] age, 40.3 [3.6] years; 1383 men and 1660 women), 309 individuals (10.2%) had CAC, with a geometric mean Agatston score of 21.6 (interquartile range, 17.3–26.8). Participants were followed up for 12.5 years, with 57 incident CHD events and 108 incident CVD events observed. After adjusting for demographics, risk factors, and treatments, those with any CAC experienced a 5-fold increase in CHD events (hazard ratio [HR], 5.0; 95% CI, 2.8–8.7) and 3-fold increase in CVD events (HR, 3.0; 95% CI, 1.9–4.7). Within CAC score strata of 1–19, 20–99, and 100 or more, the HRs for CHD were 2.6 (95% CI, 1.0–5.7), 5.8 (95% CI, 2.6–12.1), and 9.8 (95% CI, 4.5–20.5), respectively. A CAC score of 100 or more had an incidence of 22.4 deaths per 100 participants (HR, 3.7; 95% CI, 1.5–10.0); of the 13 deaths in participants with a CAC score of 100 or more, 10 were adjudicated as CHD events. Risk factors for CVD in early adult life identified those above the median risk for developing CAC and, if applied, in a selective CAC screening strategy could reduce the number of people screened for CAC by 50% and the number imaged needed to find 1 person with CAC from 3.5 to 2.2.
CONCLUSIONS AND RELEVANCE
The presence of CAC among individuals aged between 32 and 46 years was associated with increased risk of fatal and nonfatal CHD during 12.5 years of follow-up. A CAC score of 100 or more was associated with early death. Adults younger than 50 years with any CAC, even with very low scores, identified on a computed tomographic scan are at elevated risk of clinical CHD, CVD, and death. Selective use of screening for CAC might be considered in individuals with risk factors in early adulthood to inform discussions about primary prevention.
Coronary artery calcium (CAC) measured by noncontrast cardiac computed tomographic (CT) scan is a noninvasive measure of coronary artery disease that is associated with coronary heart disease (CHD) and cardiovascular disease (CVD) in middle and older age.1–4 The Coronary Artery Risk Development in Young Adults (CARDIA) Study previously reported that nonoptimal levels of modifiable cardiovascular risk factors at a mean age of 25 years were associated with prevalent CAC measured 15 years later at a mean age of 40 years.5 It is unknown if the presence of CAC by midlife increases the risk of CHD clinical events during the next decade in this younger population.
We hypothesized that the presence of CAC among individuals aged 32 to 46 years would be associated with clinical CHD and CVD occurring by the age of 58 years. Furthermore, we explored whether early clinical risk factors were associated with the development of CAC and whether such early risk factors support a strategy of selective screening for CAC to inform discussions about primary prevention.
Methods
Study Sample
The CARDIA Study enrolled 5115 black and white men and women aged 18 to 30 years from March 25, 1985, to June 7, 1986 (year 0), from Birmingham, Alabama; Chicago, Illinois; Minneapolis, Minnesota; and Oakland, California. Sampling was population based and approximately balanced within field center by sex, age, race/ethnicity, and educational level.6,7 Examinations during 2000–2001 (year 15; 3672 of 4989 survivors [73.6%] attending), 2005–2006 (year 20; 3549 of 4936 [71.9%]), and 2010–2011 (year 25; 3499 of 4853 [72.1%]) included CT imaging for CAC. The protocols were approved by institutional review boards of the University of Alabama at Birmingham, Kaiser Permanente of Oakland California, University of Minnesota, and Northwestern University. Signed informed consent was obtained from all participants at every examination.
Measurement of Demographics and Cardiovascular Risk Factors
Standardized assessment and quality control protocols were used at all examinations. Participants were asked to fast for 12 hours and to avoid smoking and strenuous physical activity for 2 hours before examination. Age, race/ethnicity, sex, years of education attained, and smoking habits (never, former, or current) were self-reported. Three blood pressure (BP) measurements were obtained while the participant was seated at each examination. Hypertension was defined as a BP of 140/90 mm Hg or more or use of antihypertensive medication. Plasma from venipuncture was stored at −70°C. Total and high-density lipoprotein cholesterol and triglycerides were assayed enzymatically. Low-density lipoprotein cholesterol was computed. Body mass index was calculated as weight in kilograms divided by height in meters squared. Diabetes was diagnosed as the first fasting plasma glucose level of 126 mg/dL or more (to convert glucose to millimoles per liter, multiply by 0.0555) (measured at years 0, 7, 10, 15, 20, and 25), a 2-hour glucose level of 200 mg/dL or more (measured at years 10, 20, and 25), hemoglobin A1c of 6.5% or more (measured at years 20 and 25), or use of medication for diabetes (assessed at all examinations). Missing values at the year 15 examination (baseline for this analysis) for smoking (n = 6), body mass index (n = 11), BP (n = 9), and serum lipids (n = 40) were interpolated from results of adjacent examinations. Clinical results, including lipids and CAC score, were reported to participants after each examination.
Measurement of CAC by CT Scan
A standard protocol for noncontrast CT scan was used to measure CAC (eTable 1 in the Supplement).8 Two sequential scans were performed at years 15 and 20 and then averaged. Given observed reproducibility, a single CT scan was performed at year 25. The Agatston score was calculated corrected for slice thickness, with a minimum calcification area of 1.87 mm2 and attenuation threshold of 130 or more Hounsfield units on a dedicated computer workstation (TeraRecon).9 The previously reported year 15 CAC scores were adjudicated for discordant CAC presence within paired scans (years 15 and 20), score change of more than 200, regression to a score of 0, or identification of potential surgical intervention (pacemaker, valve replacement, intracoronary stent, or coronary bypass). Robustness of the CAC score has been published.10–12
Ascertainment of Clinical Events
The mean follow-up period for incident events was 12.5 years, from the year 15 CT scan through August 31, 2014. Hospitalizations and relevant outpatient procedures were queried annually. Two physician members of the CARDIA Endpoints Surveillance and Adjudication Subcommittee (C.E.L.) independently adjudicated medical records for each potential event or underlying cause of death (details at http://www.cardia.dopm.uab.edu), with committee review in the case of disagreements. Coronary heart disease events included hospitalization for myocardial infarction or acute coronary syndrome with increasing symptoms consistent with ischemia but without infarction, or CHD death (including fatal myocardial infarction) (n = 46) or coronary revascularization (n = 11). Cardiovascular disease events included CHD, heart failure, stroke, transient ischemic attack, or peripheral artery disease.
Exclusions
We excluded 125 participants who died before their 15th recruitment anniversary and 52 who were unable to be contacted after that anniversary. Among the remaining eligible participants, 958 never underwent a CT scan. Participants were ineligible for CT scanning if they were pregnant (or potentially pregnant) or if their weight was above the limit for the CT scan table. One or more CT scans was performed on 3980 of 4938 living and contactable CARDIA participants (80.6%). Participants whose CHD or CVD event occurred before the year 15 examination were removed from specific analyses.
Predicting CAC From Clinical Risk Factors
A CAC prediction score was created based on participant age, race/ethnicity, sex, educational level, field center, smoking status, low-density lipoprotein cholesterol, body mass index, systolic BP, presence of diabetes, and use of medication(s) for BP and lipid control; these factors were measured at 2 time points 7 years apart when the participants were between the ages of 18 and 38 years (eAppendix in the Supplement). The predicted probability of developing CAC before age 56 years was grouped into deciles and compared with the observed CAC status across the set of 3 CT scans offered to CARDIA participants and with the occurrence of CHD before age 58 years.
Statistical Analysis
We compared participant characteristics at enrollment (year 0) and subsequent follow-ups according to participation in CT scans. We described CAC score increments in people who underwent CT scans at year 15, 20, and 25. Cox proportional hazards regression assessed the association of year 15 CAC score with incident CHD and CVD events. Coronary heart disease incidence density (ID) was estimated by year 15 categories of Framingham Risk Score (FRS) and CAC using Poisson regression with person-time offset. Linear regression predicted any CAC by year 25. P < .05 (2-sided) was considered significant. All analyses used SAS, version 9.4 (SAS Institute Inc).
Results
Of 3980 participants who underwent any CT scan, 745 (18.7%), 1077 (27.1%), and 2158 (54.2%) had CAC measured 1, 2, or 3 times, respectively. The 1135 baseline participants who never underwent a CT scan were slightly younger (mean [SD] age, 24.2 [3.7] vs 25.0 [3.6] years) and more likely to be male (565 [49.8%] vs 1763 [44.3%]), black (717 [63.2%] vs 1920 [48.2%]), and current smokers (453 of 1122 [40.4%] vs 1093 of 3957 [27.6%]) than those who underwent any CT scan (Table 1). Coronary artery calcium scores were measured in 3043, 3141, and 3189 participants 15, 20, and 25 years, respectively, after study enrollment. The FRS, medication use, prevalence of diabetes, body mass index, systolic BP, high-density lipoprotein cholesterol, and triglycerides increased and current smoking decreased with age. At 15, 20, and 25 years after enrollment, the FRS 10-year risk of CHD was nonoptimal (greater than 4%) in 606 of 3043 (19.9%), 858 of 3076 (27.9%), and 1395 of 3118 (44.7%) of participants, respectively; 80 of 3043 (2.6%), 331 of 3076 (10.8%), and 560 of 3118 (18.0%), respectively, used lipid-lowering therapies; and 230 of 3043 (7.6%), 546 of 3076 (17.8%), and 877 of 3118 (28.1%), respectively, used antihypertensive therapies (eTable 2 in the Supplement).
Table 1.
Participant Characteristicsa
| Characteristic | CAC Never Measured, Year 0, 1985–1986 (n = 1135) |
CAC Ever Measured, Year 0, 1985–1986 (n = 3980) |
CAC Measured at Specified Examination | ||
|---|---|---|---|---|---|
| Year 15, 2000–2001 (n = 3043) |
Year 20, 2005–2006 (n = 3141) |
Year 25, 2010–2011 (n = 3189) |
|||
| Age, mean (SD), y | 24.2 (3.7) | 25.0 (3.6) | 40.3 (3.6) | 45.3 (3.6) | 50.1 (3.6) |
| Female, No. (%) | 570 (50.2) | 2217 (55.7) | 1660 (54.6) | 1788 (56.9) | 1806 (56.6) |
| White, No. (%) | 418 (36.8) | 2060 (51.8) | 1667 (54.8) | 1728 (55.0) | 1672 (52.4) |
| Education, mean (SD), y | 13.1 (2.1) | 14.0 (2.2) | 15.0 (2.5) | 15.0 (2.6) | 15.0 (2.7) |
| Body mass index, mean (SD)b | 24.6 (5.6) | 24.5 (4.9) | 28.5 (6.3) | 29.1 (6.7) | 30.3 (7.1) |
| Cigarette smoking status, No. (%) | |||||
| Never | 536/1122 (47.8) | 2321/3957 (58.7) | 1846/3037 (60.8) | 1902/3112 (61.1) | 1908/3140 (60.8) |
| Former | 133/1122 (11.9) | 543/3957 (13.7) | 566/3037 (18.6) | 611 (19.6) | 691/3140 (22.0) |
| Current | 453/1122 (40.4) | 1093/3957 (27.6) | 625/3037 (20.6) | 599 (19.2) | 541/3140 (17.2) |
| Systolic blood pressure, mean (SD), mm Hg | 111.3 (11.5) | 110.2 (10.8) | 113.1 (14.6) | 115.5 (14.6) | 119.8 (16.1) |
| Diastolic blood pressure, mean (SD), mm Hg | 68.9 (10.2) | 68.5 (9.4) | 74.6 (11.4) | 72 (11.1) | 75 (11.2) |
| Hypertension, No. (%) | 63 (5.6) | 143 (3.6) | 607 (19.9) | 864 (27.5) | 1267 (39.7) |
| LDL cholesterol, mean (SD), mg/dL | 106.6 (31.8) | 109.8 (31) | 113.6 (31.5) | 110.2 (32.1) | 112.1 (32.9) |
| HDL cholesterol, mean (SD), mg/dL | 52.9 (14.1) | 53.2 (13) | 50.5 (14.5) | 54.4 (16.7) | 57.9 (18.0) |
| Triglycerides, mean (SD), mg/dL | 75.1 (51.4) | 72.3 (47.6) | 105.9 (95.2) | 109.7 (80.3) | 115.2 (89.0) |
| Cholesterol-lowering medication, No. (%) | 0 | 0 | 73 (2.4) | 280 (8.9) | 503 (15.8) |
| Diabetes mellitus, No. (%) | 11 (1.0) | 23 (0.6) | 134 (4.4) | 286 (9.1) | 447 (14.0) |
| Framingham 10-y risk of CHD, No. (%) | |||||
| ≤4% | 1055/1105 (95.5) | 3814/3925 (97.2) | 2437 (80.1) | 2218/3076 (72.1) | 1723/3118 (55.3) |
| 5%–11% | 50/1105 (4.5) | 108/3925 (2.8) | 546 (17.9) | 758/3076 (24.6) | 1159/3118 (37.2) |
| ≥12% | 0 | 3/3925 (0.1) | 60 (2.0) | 100/3076 (3.3) | 236/3118 (7.6) |
| CAC prevalence, No. (%) | NA | NA | 309 (10.2) | 631 (20.1) | 907 (28.4) |
| CAC Agatston score >0 geometric mean (interquartile range) | NA | NA | 21.6 (17.3–26.8) | 59.1 (47.7–73.2) | 144.4 (116.9–178.3) |
Abbreviations: CAC, coronary artery calcium; CHD, coronary heart disease; HDL, high-density lipoprotein; LDL, low-density lipoprotein; NA, not applicable.
SI conversion factors: To convert cholesterol to millimoles per liter, multiply by 0.0259; to convert triglycerides to millimoles per liter, multiply by 0.0113.
Sample sizes were reduced where a specific observation was missing or excluded in the case of triglycerides ≥400 mg/dL, with resulting minimum sample sizes of 1114, 3937, 2972, 3072, and 3145, respectively, across the columns.
Calculated as weight in kilograms divided by height in meters squared.
CAC in Adults Aged 32 to 56 Years
Cohort mean (SD) ages at years 15, 20, and 25 were 40.3 (3.6), 45.3 (3.6), and 50.1 (3.6) years, respectively, with a prevalence of CAC of 10.2% (309 of 3043), 20.1% (631 of 3141), and 28.4% (907 of 3189), respectively (Table 1). The 5-year incidence of CAC, among those without CAC 5 years earlier, was 11.9% (266 of 2238 participants) between year 15 and year 20 (participants aged 40.3–45.3 years) and 14.4% (301 of 2097 participants) between years 20 and 25 (participants aged 45.3–50.1 years). Overall, the 10-year incidence of CAC between years 15 and 25 was 22.1% (488 of 2209 participants). Among those with nonzero CAC scores, the overall geometric mean score was 21.6 (interquartile range [IQR], 17.3–26.8) at year 15, increasing to 59.1 (IQR, 47.7–73.2) at year 20 and 144.4 (IQR, 116.9–178.3) at year 25 and increasing exponentially after adjusting for age, race/ethnicity, and sex (Figure 1).
Figure 1. Individuals Aged 32 to 46 Years With Prevalent Coronary Artery Calcium (CAC) and Progression During the Following 10 Years.
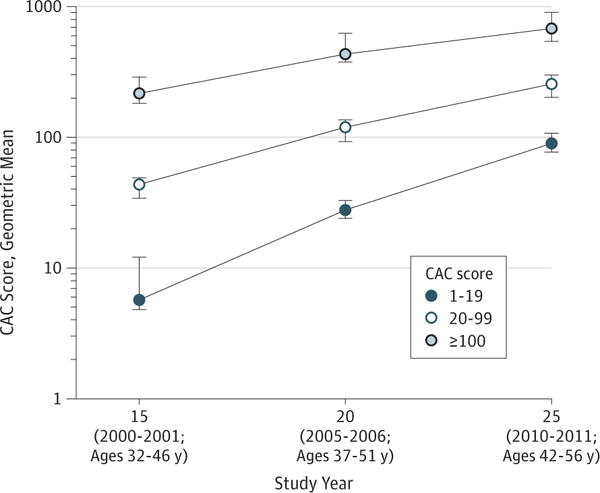
The geometric means and 95% CIs by CAC score category at the year 15 examination (2000–2001), estimated in repeated measures regression with banded covariance structure, are presented. The geometric mean was used to address the skewness of the distribution and can be interpreted as comparable to the median of the distribution. Although CAC was initially minimal in the group with the lowest score (1–19), during the following 10 years the geometric mean CAC score increased from 5.7 at year 15 to 27.4 at year 20 to 89.8 at year 25. In the group with a score of 20–99, the geometric mean CAC score increased from 43.6 at year 15 to 117.8 at year 20 to 255.7 at year 25. In the group with a score of ≥100, the geometric mean CAC score increased from 217.2 at year 15 to 440.4 at year 20 to 680.0 at year 25. The linear increase observed, when plotted on the log scale y-axis, indicates exponential increase over time in the amount of CAC.
CAC and Incident CHD, CVD, and Death
We observed 57 incident CHD events after the baseline CT scan (number at risk, 3036, excluding 7 with CHD before year 15). Events increased monotonically across clinical CAC ranges (eFigure in the Supplement). The unadjusted incidence density in those with any CAC was 8.9 events per 100 individuals followed up for 12½ years. Compared with no CAC, the adjusted hazard ratio (HR) for CHD among those with any CAC was 5.0 (95% CI, 2.8–8.7; P < .001) (Table 2). The incidence density of any CHD increased from 4.8 events per 100 persons (HR, 2.6; 95% CI, 1.0–5.7; P = .03) at a CAC score of 1 to 19, to 10.6 events per 100 persons (HR, 5.8; 95% CI, 2.6–12.1; P < .001) at a CAC score of 20 to 99, to 26.1 events per 100 persons (HR, 9.8; 95% CI, 4.5–20.5; P < .001) at a CAC score of 100 or more (Table 2). This association was similar when we excluded coronary revascularization without acute symptomatic presentation from CHD events. Although CAC was associated with the 108 fatal or nonfatal CVD events (HR, 3.0; 95% CI, 1.9–4.7), it was not associated with the CVD events that did not involve CHD (eTable 3 in the Supplement). The presence of any CAC had an incidence density of 8.1 all–cause deaths per 100 people followed up for 12.5 years (HR, 1.6; 95% CI, 1.0–2.6; P = .05) (Table 2) in the fully adjusted model. The incidence density increased to 22.4 deaths per 100 people in those with a CAC score of 100 or more (HR, 3.7; 95% CI 1.5–10.0; P < .001) in the fully adjusted model. Of the observed 13 deaths in participants with a CAC score of 100 or more, 10 were adjudicated as CHD events. The risk of CHD event across year 15 CAC categories increased within each year 15 FRS category (Figure 2).
Table 2.
Incident CHD Events and All-Cause Death by CAC Scorea
| CAC scoreb | All CHD | CHD Excluding Coronary Artery Revascularization Without Acute Symptomsc | All-Cause Death | ||||||||||||||
|---|---|---|---|---|---|---|---|---|---|---|---|---|---|---|---|---|---|
| No.d | p-y | Events | IDe | HR (95% CI)f | P Value | p-y | Events | IDe | HR (95% CI)f | P Value | No.d | p-y | Events | IDe | HR (95% CI)f | P Value | |
| None | 2733 | 34413 | 27 | 1.0 | 1 [Reference] | NA | 34432 | 23 | 0.8 | 1 [Reference] | NA | 2734 | 34497 | 82 | 3.0 | 1 [Reference] | NA |
| Any, >0 | 303 | 3644 | 30 | 10.3 | 5.0 (2.8–8.7) | <.001 | 3693 | 23 | 7.6 | 4.1 (2.2–7.7) | <.001 | 309 | 3847 | 25 | 8.1 | 1.6 (1.0–2.6) | .05 |
| Score ranges | |||||||||||||||||
| 1–19 | 150 | 1844 | 7 | 4.8 | 2.6 (1.0–5.7) | .03 | 1849 | 6 | 4.0 | 2.3 (0.8–5.6) | .07 | 152 | 1897 | 8 | 5.3 | 1.1 (0.5–2.1) | .89 |
| 20–99 | 98 | 1177 | 10 | 10.6 | 5.8 (2.6–12.1) | <.001 | 1195 | 8 | 8.2 | 5.1 (2.1–11.6) | <.001 | 99 | 1243 | 4 | 4.0 | 0.9 (0.3–2.7) | .85 |
| ≥100 | 55 | 623 | 13 | 26.1 | 9.8 (4.5–20.5) | <.001 | 649 | 9 | 16.4 | 6.8 (2.7–15.6) | <.001 | 58 | 706 | 13 | 22.4 | 3.7 (1.5–10.0) | <.001 |
| Total | 3036 | 38056 | 57 | 1.9 | NA | NA | 38125 | 46 | 1.5 | NA | NA | 3043 | 38330 | 107 | 3.5 | NA | NA |
Abbreviations: CAC, coronary artery calcium; CHD, coronary heart disease; HR, hazard ratio; ID, incidence density; NA, not applicable; p-y, person-years; Ref, reference.
Individuals aged 32 to 46 years in 2000–2001 and followed up through 2014 to a maximum age of 58 years.
Total CAC score (Agatston score), all coronary vessels at year 15 examination (2000–2001) by presence and score categories.
Coronary artery revascularization procedures included coronary artery bypass grafting and percutaneous coronary interventions and were excluded as events when documentation was not available to confirm a diagnosis of acute symptomatic presentation of CHD (n = 10).
Number of participants at risk at year 15 examination, 2000–2001; 7 of the 3043 participants who had a computed tomographic scan at year 15 had a prior CHD event and were excluded from analysis for incident CHD.
Number of adjudicated CHD events or deaths per 100 people followed up for 12½ years.
Hazard ratios in proportional hazards regression adjusted for age, race/ethnicity, sex, field center, smoking status, maximum educational level, systolic blood pressure, treatment for hypertension, cholesterol, triglycerides, high-density lipoprotein cholesterol, treatment for dyslipidemia, type 1 or 2 diabetes, and body mass index.
Figure 2. Incidence Density of Coronary Heart Disease (CHD) Events per 100 Persons.

Incidence density of CHD events per 100 persons in a fully adjusted Poisson regression model, for coronary artery calcium (CAC) score category within Framingham Heart Study 10-year predicted CHD risk as determined at the year 15 examination (2000–2001) and then followed up for 12.5 years.
Prediction of CAC at Age 32 to 56 Years
Risk factors for CVD during early adulthood were associated with the development of CAC before age 56 years (eTable 4 in the Supplement). A CAC prediction score using clinical risk factors measured 7 years apart between ages 18 and 38 years was associated with the presence or absence of CAC in the cohort, with a model R2 = 0.18 (eAppendix in the Supplement). The CAC prediction score discriminated between those with a low and high probability of developing CAC before age 56 years. Participants in the lowest CAC risk decile had an observed presence of CAC of 4.2% (14 of 333) compared with 67.8% (217 of 320) in the highest CAC risk decile (eTable 5 in the Supplement). A strategy of restricting CAC screening to persons with a risk score above the median value captured 77.3% of all participants with any CAC (745 of 964) and 95.5% of participants with CHD events (64 of 67) while reducing the number of individuals recommended to be screened by 50.0% (1665 of 3330) (Table 3).
Table 3.
Use of Risk Factors Measured in Early Adult Life to Identify the Population Most at Risk for Developing CAC and Incidence of Coronary Heart Diseasea
| CAC Screening Strategy in Middle Age | No. (%) | CHD Incidence, No. (%) | CAC Prevalence, No. (%) | Cohort CAC Found by CAC Screening Strategy, No. (%) | No. Enrolled to Find 1 Case of CAC |
|---|---|---|---|---|---|
| Entire eligible cohort | 3330 (100) | 67 (2.0) | 964 (28.9) | 964/964 (100.0) | 3.5 |
| Predicted low CAC risk | 1665 (50.0) | 3 (0.2) | 219 (13.2) | 219/964 (22.7) | 7.7 |
| Predicted high CAC risk | 1665 (50.0) | 64 (3.8) | 745 (44.7) | 745/964 (77.3) | 2.2 |
Abbreviation: CAC, coronary artery calcium.
The probability of developing CAC by ages 32 to 56 years is based on Coronary Artery Risk Development in Young Adults Study cohort risk factors measured twice: when the cohort had a mean age of 25 years (range at year 0 examination, 18–30 years) and 32 years (range at year 7 examination, 25–38 years), using linear regression to predict the development of any CAC at any of the year 15, 20, or 25 examinations (during ages 32–56 years). Risk factors were measured during the year 0 and 7 examinations and included the following: age, race/ethnicity, sex, field center, educational level and both year 0 and 7 smoking status, low-density lipoprotein cholesterol, body mass index, systolic blood pressure, use of antihypertensive medication, use of lipid-lowering medication (both medication categories were rare by year 7: n = 50 antihypertensive medication users, n = 8 lipid-lowering medication users), and type 1 or 2 diabetes (also rare by year 7: n = 37). The prediction formula and observed CAC by deciles of the CAC prediction are presented in the eAppendix, eTable 4, and eTable 5 in the Supplement.
Discussion
We evaluated the association of CAC at ages 32 to 46 years with incident CHD, CVD, and total death during the next 12.5 years in a biracial US sample. We found that any measureable CAC was associated with a 5-fold increase in fatal and nonfatal CHD events, with a 3-fold increase in any CVD events. Even CAC scores between 1 and 19 increased the risk of CHD events by 2.6-fold compared with participants without CAC. A higher burden of atherosclerotic coronary artery disease, as measured by higher CAC scores, demonstrated increasing strength of association with incident CHD. Consistent with the CHD association was the 3.7-fold increase in all-cause death in those with a CAC score of 100 or more. In individuals aged 32 to 46 years, CAC appears to be specific for CHD during middle age. The exponential increase in CAC scores across 10 years is consistent with active coronary atherogenesis and is a plausible explanation for the association between even low CAC scores in early adult life and the observed CHD events and mortality during middle age in our cohort. The 28.4% prevalence of CAC at a mean cohort age of 50.1 years indicates a substantial burden of coronary artery disease and future risk of CHD events.
Coronary atherosclerosis is known to be present in early adult life (age, 18–34 years).13,14 Previous reports on CAC and CHD events in younger adults are limited and have been performed in individuals clinically referred for CAC screening or in members of the military.4,15,16 Our study addresses limitations associated with generalizability, self-referral bias, self-reported risk factors, lack of adjudicated CHD and CVD outcomes, and use of contemporary CT scan technology.
Calcification, Atherosclerosis, and Clinical Disease
Presence of CAC as confirmed by results of CT scan indicates that an individual has progressed beyond the early nonraised lesions to advanced coronary atheroma.17–20 We found exponential increases in CAC burden among adults aged 32 to 56 years. Previously, higher CAC scores (≥100) were associated with incidence of clinical CHD and CVD after adjustment for known covariates.1,21 The finding that even low CAC scores are associated with CHD and CVD events by middle age after full adjustment is new information. Studies using cardiac CT angiography and intravascular ultrasound have found that patterns of “spotty calcifications” in coronary arteries are associated with high-risk plaques and acute coronary syndrome.22,23 Considering this phenomenon and noting the exponential increase in CAC during the 5 and 10 years after it is first observed, it is unsurprising that CAC scores less than 100 and even less than 20 detected at ages 32 to 46 years have negative health consequences that manifest during the next 10 to 15 years.
Clinical Implications of CAC for Preventing CHD in Early- and Middle-Aged Adults
The finding that low CAC scores are associated with clinical events in young adults independent of the FRS and traditional risk factors for CVD has potential clinical implications. Any CAC present between ages 32 to 46 years in our study increased the risk of clinical CHD events by 5-fold after adjustment. Our findings in younger adults augment existing evidence that CAC adds information to risk factors and other biomarkers improving the classification of risk for CHD (Figure 2).1–3,24–26 The 2013 American College of Cardiology/American Heart Association guidelines27 include screening for CAC as an option for assessment of risk of CVD in individuals for whom uncertainty exists; recent reports further support this application.28,29 Coronary artery calcium score thresholds of 100, 300, and 400 or age-based percentiles have commonly guided recommendations; however, in light of our findings, these recommendations might be reconsidered in favor of lower thresholds in middle-aged and younger adults.21
Standardized reporting of CAC on conventional chest CT scans performed for another indication coupled with evidence-based interventions to reduce the risk of CVD have the potential to enhance prevention.30,31 Coronary artery calcium seen on screening chest CT scans for lung cancer has been found to be independently associated with CVD and all-cause mortality and demonstrates the viability of identifying CAC on such scans.32,33
The significantly elevated 10-year risk of CVD in CARDIA participants with CAC in middle age is consistent with an even more substantial lifetime risk of CVD.34,35 Previous models of the comparative efficacy and cost-effectiveness of CT scans for CAC were based largely on outcomes data in older adults.36,37 With regard to consideration of statin therapy, in the Multi-Ethnic Study of Atherosclerosis, participants with low-density lipoprotein cholesterol less than 130 mg/dL (to convert cholesterol to millimoles per liter, multiply by 0.0259) who were stratified by CAC score resulted in predicted numbers needed to treat of 24 for those with a CAC score more than 100 compared with 549 for those with a CAC score of zero.38 Our data provide robust estimates of the development of CAC and associated risk of CHD and CVD events occurring before age 58 years. This finding might allow more accurate estimates of attributable risk and number needed to screen and treat to avoid or delay a clinical event. Computed tomographic scans for CAC are quick (<10 minutes), can be performed with widely available CT scanners, require very low radiation exposure (≤1 mSv effective dose), and are well tolerated by healthy volunteers.8,39
Could the knowledge of an association of the presence of CAC in early adult life with CHD and premature death be used to improve prevention of CHD? Screening all individuals aged 32 to 46 years for CAC is not desirable since CAC is relatively rare by that age range (10.2% prevalence) and even by ages 42 to 56 (28.4% prevalence). In a strategy in which all individuals aged 32 to 46 years are screened, most (approximately 70%–90%) would be negative for CAC and thus experience the negative consequences of screening (incidental findings, associated cost and time, and low level exposure to radiation) with limited benefit. Depending on age at first measurement of CAC, many people would develop incident CAC during the next 10 to 15 years as its prevalence increases with age. A tiered screening strategy could combine measurement of risk factors for CVD and targeted CT scans for CAC to refine assessment of the risk for CHD. To illustrate, we extended a prior CARDIA publication5 and created a predicted CAC risk score using demographic and risk factors measured at mean ages of 25 and 32 years. Using the participant’s CAC risk score, we then divided the cohort into predicted low and high risk for developing CAC to evaluate how a screening strategy parallel to the CARDIA protocol in which a series of 3 examinations was offered across 10 years might perform in practice (Table 3). Compared with a strategy in which all individuals aged 32 to 46 years are screened, we found that an approach that uses ascertainment of risk factors in early adulthood as a gatekeeper to measurement of CAC has the potential to reduce the number of people targeted for CAC screening by 50% and reduce the number of people screened to find 1 individual with CAC from 3.5 to 2.2. Notably, 95.5% of the individuals observed in CARDIA with clinical CHD events would be targeted for CAC screening using this strategy. A more comprehensive evaluation of predictive models, positive and negative consequences, and a cost-effectiveness analysis of potential CHD screening strategies in early adult life is warranted.28,36,40,41 Individuals younger than than 59 years with CAC confirmed on results of CT scans performed for another indication are at significant risk of fatal and nonfatal CHD. In our opinion, these individuals do not need an additional CT scan to measure a CAC score; rather, they should be evaluated for modifiable risk factors for CVD by their health care professional with determination of appropriate strategies to reduce their risk of CVD.
Strengths and Limitations
Strengths of our study include the prospective longitudinal design across 30 years, community-based biracial population, widely available CT scanning systems, US Food and Drug Administration–approved software for measuring CAC, and established clinical measures of outcomes and covariates. Furthermore, results remained consistent after excluding events in which asymptomatic coronary revascularization was the only indication of CHD. A limitation of this study is the relatively small number of CHD events; however, additional follow-up is planned. The inclusion of more than 80% of the recruited and eligible cohort minimized potential nonresponse bias. Changes in CT scanning technology were actively managed through site selection, protocol, and quality control procedures to minimize the effect of equipment changes on the CAC measures.8 Our rigorous quality control and adjudication of results increases the precision and validity of our findings but may be less generalizable to current clinical practice without comparable standards. The findings of the CARDIA Study may not apply to individuals of a race/ethnicity other than white or black who are living in the United States. The use of CVD risk factors measured at multiple time points in early adult life to predict the development of CAC requires further refinement but may help guide future research efforts and debate. Finally, as noted in the 2013 American College of Cardiology/American Heart Association cardiovascular risk assessment guidelines, none of the risk assessment tools, including the FRS or novel risk markers, have been formally evaluated in a randomized clinical trial of the efficacy of screening for clinical events.27 This gap in knowledge, although regrettable, should not prevent progress in reducing the negative health consequences of CHD. Randomized trials for breast and lung cancer screening have been completed, yet significant concerns remain regarding implementation in clinical practice.42
Conclusions
The presence of any CAC by ages 32 to 46 years, including CAC scores less than 20, were associated with incident CHD during middle age in black and white men and women. Coronary artery calcium present by ages 32 to 46 years increased exponentially during the next decade of life. The 22.1% 10-year incidence of CAC observed in the cohort between mean ages of 40.3 years and 50.1 years indicates the development and progression of substantial coronary atherosclerosis in middle adult life.43 Coronary artery calcium was associated with all-cause mortality in those with CAC scores of 100 or more, who generally died of CHD. The association of CAC with CHD strengthened as the burden of calcified plaque increased. These findings support the potential use of CAC as a biomarker of risk of CHD and premature death in young adults. The presence of any CAC on conventional chest CT examinations in individuals 56 years of age or younger should be recognized as a biomarker of elevated CHD risk and trigger a review of the individual’s cardiovascular health status and intensified prevention efforts personalized to the patient. Whether any kind of general screening for CAC is warranted needs further study, although we suggest that a strategy in which all individuals aged 32 to 46 years are screened is not indicated. Rather, a more targeted approach based on measuring risk factors in early adult life to predict individuals at high risk for developing CAC in whom the CT scan would have the greatest value can be considered. The finding that CAC present by ages 32 to 46 years is associated with increased risk of premature CHD and death emphasizes the need for reduction of risk factors and primordial prevention beginning in early life.
Supplementary Material
Key Points.
Question
Is the presence of coronary artery disease, as indicated by coronary artery calcium (CAC), associated with the development of clinical coronary heart disease before age 60 years?
Finding
In the Coronary Artery Risk Development in Young Adults Study, black and white Americans of both sexes aged 32 to 46 years who had any CAC (Agatston score >0) as seen on computed tomographic scan had an elevated risk of clinical coronary heart disease during 12.5 years of follow-up. Individuals with a CAC score of 100 or more had an incidence density of 22.4 deaths per 100 people observed for 12.5 years.
Meaning
Any CAC in early adult life, even in those with very low scores, indicates significant risk of having and possibly dying of a myocardial infarction during the next decade beyond standard risk factors and identifies an individual at particularly elevated risk for coronary heart disease for whom aggressive prevention is likely warranted.
Acknowledgments
Funding/Support: This project was supported by grant R01-HL098445 from the National Heart, Lung, and Blood Institute (NHLBI) to Vanderbilt University and Wake Forest University. The Coronary Artery Risk Development in Young Adults Study (CARDIA) is supported by contracts HHSN268201300025C, HHSN268201300026C, HHSN268201300027C, HHSN268201300028C, HHSN268201300029C, and HHSN268200900041C from the NHLBI and the Intramural Research Program of the National Institute on Aging.
Role of the Funder/Sponsor: The NHLBI, through one or more members of its staff, participated in the design and conduct of the study; collection, management, analysis, and interpretation of the data; preparation, review, or approval of the manuscript; and decision to submit the manuscript for publication. A member of the NHLBI staff (Dr Reis) served as a coauthor and fully participated in preparation of the manuscript, as did the other coauthors. Although additional members of the NHLBI staff and CARDIA Study investigative team were able to view the manuscript prior to submission, they did not participate in the decision to submit the manuscript or approve it prior to publication.
Footnotes
Author Contributions: Drs Carr and Jacobs had full access to all the data in the study and take responsibility for the integrity of the data and the accuracy of the data analysis.
Study concept and design: Carr, Jacobs, Terry, Liu, Lewis, Goff.
Acquisition, analysis, or interpretation of data: Carr, Jacobs, Terry, Shay, Sidney, Schreiner, Lewis, Shikany, Reis, Goff.
Drafting of the manuscript: Carr, Jacobs, Terry.
Critical revision of the manuscript for important intellectual content: All authors.
Statistical analysis: Carr, Jacobs, Schreiner.
Obtained funding: Carr, Jacobs, Sidney, Liu, Schreiner, Lewis, Goff.
Administrative, technical, or material support: Carr, Jacobs, Terry, Shay, Lewis, Reis.
Study supervision: Jacobs, Terry, Sidney, Schreiner, Lewis, Reis.
Conflict of Interest Disclosures: All authors have completed and submitted the ICMJE Form for Disclosure of Potential Conflicts of Interest and none were reported.
Disclaimer: The views expressed in this manuscript are those of the authors and do not necessarily represent the views of the NHLBI; the National Institutes of Health, or the US Department of Health and Human Services.
Additional Contributions: The authors would like to thank the investigators, the staff, and the participants of the CARDIA Study for their dedication and highly valued contributions during the more than 30 years of the study.
References
- 1.Detrano R, Guerci AD, Carr JJ, et al. Coronary calcium as a predictor of coronary events in four racial or ethnic groups. N Engl J Med. 2008;358(13):1336–1345. doi: 10.1056/NEJMoa072100. [DOI] [PubMed] [Google Scholar]
- 2.Elias-Smale SE, Proença RV, Koller MT, et al. Coronary calcium score improves classification of coronary heart disease risk in the elderly: the Rotterdam study. J Am Coll Cardiol. 2010;56(17):1407–1414. doi: 10.1016/j.jacc.2010.06.029. [DOI] [PubMed] [Google Scholar]
- 3.Vliegenthart R, Oudkerk M, Hofman A, et al. Coronary calcification improves cardiovascular risk prediction in the elderly. Circulation. 2005;112(4):572–577. doi: 10.1161/CIRCULATIONAHA.104.488916. [DOI] [PubMed] [Google Scholar]
- 4.Tota-Maharaj R, Blaha MJ, McEvoy JW, et al. Coronary artery calcium for the prediction of mortality in young adults <45 years old and elderly adults >75 years old. Eur Heart J. 2012;33(23):2955–2962. doi: 10.1093/eurheartj/ehs230. [DOI] [PubMed] [Google Scholar]
- 5.Loria CM, Liu K, Lewis CE, et al. Early adult risk factor levels and subsequent coronary artery calcification: the CARDIA Study. J Am Coll Cardiol. 2007;49(20):2013–2020. doi: 10.1016/j.jacc.2007.03.009. [DOI] [PubMed] [Google Scholar]
- 6.Friedman GD, Cutter GR, Donahue RP, et al. CARDIA: study design, recruitment, and some characteristics of the examined subjects. J Clin Epidemiol. 1988;41(11):1105–1116. doi: 10.1016/0895-4356(88)90080-7. [DOI] [PubMed] [Google Scholar]
- 7.Hughes GH, Cutter G, Donahue R, et al. Recruitment in the Coronary Artery Disease Risk Development in Young Adults (CARDIA) Study. Control Clin Trials. 1987;8(4 suppl):68S–73S. doi: 10.1016/0197-2456(87)90008-0. [DOI] [PubMed] [Google Scholar]
- 8.Carr JJ, Nelson JC, Wong ND, et al. Calcified coronary artery plaque measurement with cardiac CT in population-based studies: standardized protocol of Multi-Ethnic Study of Atherosclerosis (MESA) and Coronary Artery Risk Development in Young Adults (CARDIA) Study. Radiology. 2005;234(1):35–43. doi: 10.1148/radiol.2341040439. [DOI] [PubMed] [Google Scholar]
- 9.Agatston AS, Janowitz WR, Hildner FJ, Zusmer NR, Viamonte M, Jr, Detrano R. Quantification of coronary artery calcium using ultrafast computed tomography. J Am Coll Cardiol. 1990;15(4):827–832. doi: 10.1016/0735-1097(90)90282-t. [DOI] [PubMed] [Google Scholar]
- 10.Budoff MJ, McClelland RL, Chung H, et al. Reproducibility of coronary artery calcified plaque with cardiac 64-MDCT: the Multi-Ethnic Study of Atherosclerosis. AJR Am J Roentgenol. 2009;192(3):613–617. doi: 10.2214/AJR.08.1242. [DOI] [PubMed] [Google Scholar]
- 11.Carr JJ, Crouse JR, III, Goff DC, Jr, D’Agostino RB, Jr, Peterson NP, Burke GL. Evaluation of subsecond gated helical CT for quantification of coronary artery calcium and comparison with electron beam CT. AJR Am J Roentgenol. 2000;174(4):915–921. doi: 10.2214/ajr.174.4.1740915. [DOI] [PubMed] [Google Scholar]
- 12.Detrano RC, Anderson M, Nelson J, et al. Coronary calcium measurements: effect of CT scanner type and calcium measure on rescan reproducibility—MESA study. Radiology. 2005;236(2):477–484. doi: 10.1148/radiol.2362040513. [DOI] [PubMed] [Google Scholar]
- 13.Strong JP, Malcom GT, McMahan CA, et al. Prevalence and extent of atherosclerosis in adolescents and young adults: implications for prevention from the Pathobiological Determinants of Atherosclerosis in Youth Study. JAMA. 1999;281(8):727–735. doi: 10.1001/jama.281.8.727. [DOI] [PubMed] [Google Scholar]
- 14.Mahoney LT, Burns TL, Stanford W, et al. Coronary risk factors measured in childhood and young adult life are associated with coronary artery calcification in young adults: the Muscatine Study. J Am Coll Cardiol. 1996;27(2):277–284. doi: 10.1016/0735-1097(95)00461-0. [DOI] [PubMed] [Google Scholar]
- 15.Taylor AJ, Bindeman J, Feuerstein I, Cao F, Brazaitis M, O’Malley PG. Coronary calcium independently predicts incident premature coronary heart disease over measured cardiovascular risk factors: mean three-year outcomes in the Prospective Army Coronary Calcium (PACC) project. J Am Coll Cardiol. 2005;46(5):807–814. doi: 10.1016/j.jacc.2005.05.049. [DOI] [PubMed] [Google Scholar]
- 16.Taylor AJ, Donovan M, Connor B, Cole GJ, Villines T. Long-term mortality in the PACC project cohort: does coronary artery calcium have actuarial significance in the young?. Poster presented at: American College of Cardiology 64th Annual Scientific Session; March 14, 2015; San Diego, CA. [Google Scholar]
- 17.Stary HC. The development of calcium deposits in atherosclerotic lesions and their persistence after lipid regression. Am J Cardiol. 2001;88(2A suppl):16E–19E. doi: 10.1016/s0002-9149(01)01713-1. [DOI] [PubMed] [Google Scholar]
- 18.Virmani R, Burke AP, Farb A, Kolodgie FD. Pathology of the vulnerable plaque. J Am Coll Cardiol. 2006;47(8 suppl):C13–C18. doi: 10.1016/j.jacc.2005.10.065. [DOI] [PubMed] [Google Scholar]
- 19.Stary HC, Chandler AB, Dinsmore RE, et al. A definition of advanced types of atherosclerotic lesions and a histological classification of atherosclerosis: a report from the Committee on Vascular Lesions of the Council on Arteriosclerosis, American Heart Association. Circulation. 1995;92(5):1355–1374. doi: 10.1161/01.cir.92.5.1355. [DOI] [PubMed] [Google Scholar]
- 20.Virmani R, Kolodgie FD, Burke AP, Farb A, Schwartz SM. Lessons from sudden coronary death: a comprehensive morphological classification scheme for atherosclerotic lesions. Arterioscler Thromb Vasc Biol. 2000;20(5):1262–1275. doi: 10.1161/01.atv.20.5.1262. [DOI] [PubMed] [Google Scholar]
- 21.Rumberger JA, Simons DB, Fitzpatrick LA, Sheedy PF, Schwartz RS. Coronary artery calcium area by electron-beam computed tomography and coronary atherosclerotic plaque area: a histopathologic correlative study. Circulation. 1995;92(8):2157–2162. doi: 10.1161/01.cir.92.8.2157. [DOI] [PubMed] [Google Scholar]
- 22.Ehara S, Kobayashi Y, Yoshiyama M, et al. Spotty calcification typifies the culprit plaque in patients with acute myocardial infarction: an intravascular ultrasound study. Circulation. 2004;110(22):3424–3429. doi: 10.1161/01.CIR.0000148131.41425.E9. [DOI] [PubMed] [Google Scholar]
- 23.Motoyama S, Sarai M, Harigaya H, et al. Computed tomographic angiography characteristics of atherosclerotic plaques subsequently resulting in acute coronary syndrome. J Am Coll Cardiol. 2009;54(1):49–57. doi: 10.1016/j.jacc.2009.02.068. [DOI] [PubMed] [Google Scholar]
- 24.Erbel R, Möhlenkamp S, Moebus S, et al. Heinz Nixdorf Recall Study Investigative Group Coronary risk stratification, discrimination, and reclassification improvement based on quantification of subclinical coronary atherosclerosis: the Heinz Nixdorf Recall Study. J Am Coll Cardiol. 2010;56(17):1397–1406. doi: 10.1016/j.jacc.2010.06.030. [DOI] [PubMed] [Google Scholar]
- 25.Shaw LJ, Giambrone AE, Blaha MJ, et al. Long-term prognosis after coronary artery calcification testing in asymptomatic patients: a cohort study. Ann Intern Med. 2015;163(1):14–21. doi: 10.7326/M14-0612. [DOI] [PubMed] [Google Scholar]
- 26.Yeboah J, McClelland RL, Polonsky TS, et al. Comparison of novel risk markers for improvement in cardiovascular risk assessment in intermediate-risk individuals. JAMA. 2012;308(8):788–795. doi: 10.1001/jama.2012.9624. [DOI] [PMC free article] [PubMed] [Google Scholar]
- 27.Goff DC, Jr, Lloyd-Jones DM, Bennett G, et al. American College of Cardiology/American Heart Association Task Force on Practice Guidelines 2013 ACC/AHA guideline on the assessment of cardiovascular risk: a report of the American College of Cardiology/American Heart Association Task Force on Practice Guidelines. Circulation. 2014;129(25 suppl 2):S49–S73. doi: 10.1161/01.cir.0000437741.48606.98. [DOI] [PubMed] [Google Scholar]
- 28.Nasir K, Bittencourt MS, Blaha MJ, et al. Implications of coronary artery calcium testing among statin candidates according to American College of Cardiology/American Heart Association cholesterol management guidelines: MESA (Multi-Ethnic Study of Atherosclerosis) [published correction appears in J Am Coll Cardiol. 2015;66(23):2686] J Am Coll Cardiol. 2015;66(15):1657–1668. doi: 10.1016/j.jacc.2015.07.066. [DOI] [PubMed] [Google Scholar]
- 29.Stone NJ, Robinson JG, Lichtenstein AH, et al. American College of Cardiology/American Heart Association Task Force on Practice Guidelines 2013 ACC/AHA guideline on the treatment of blood cholesterol to reduce atherosclerotic cardiovascular risk in adults: a report of the American College of Cardiology/American Heart Association Task Force on Practice Guidelines. Circulation. 2014;129(25 suppl 2):S1–S45. doi: 10.1161/01.cir.0000437738.63853.7a. [DOI] [PubMed] [Google Scholar]
- 30.Berrington de González A, Mahesh M, Kim KP, et al. Projected cancer risks from computed tomographic scans performed in the United States in 2007. Arch Intern Med. 2009;169(22):2071–2077. doi: 10.1001/archinternmed.2009.440. [DOI] [PMC free article] [PubMed] [Google Scholar]
- 31.Shemesh J, Tenenbaum A, Kopecky KK, et al. Coronary calcium measurements by double helical computed tomography: using the average instead of peak density algorithm improves reproducibility. Invest Radiol. 1997;32(9):503–506. doi: 10.1097/00004424-199709000-00001. [DOI] [PubMed] [Google Scholar]
- 32.Jacobs PC, Gondrie MJ, van der Graaf Y, et al. Coronary artery calcium can predict all-cause mortality and cardiovascular events on low-dose CT screening for lung cancer. AJR Am J Roentgenol. 2012;198(3):505–511. doi: 10.2214/AJR.10.5577. [DOI] [PubMed] [Google Scholar]
- 33.Jacobs PC, Isgum I, Gondrie MJ, et al. Coronary artery calcification scoring in low-dose ungated CT screening for lung cancer: interscan agreement. AJR Am J Roentgenol. 2010;194(5):1244–1249. doi: 10.2214/AJR.09.3047. [DOI] [PubMed] [Google Scholar]
- 34.Berry JD, Dyer A, Cai X, et al. Lifetime risks of cardiovascular disease. N Engl J Med. 2012;366(4):321–329. doi: 10.1056/NEJMoa1012848. [DOI] [PMC free article] [PubMed] [Google Scholar]
- 35.Berry JD, Liu K, Folsom AR, et al. Prevalence and progression of subclinical atherosclerosis in younger adults with low short-term but high lifetime estimated risk for cardiovascular disease: the Coronary Artery Risk Development in Young Adults Study and Multi-Ethnic Study of Atherosclerosis. Circulation. 2009;119(3):382–389. doi: 10.1161/CIRCULATIONAHA.108.800235. [DOI] [PMC free article] [PubMed] [Google Scholar]
- 36.Pletcher MJ, Pignone M, Earnshaw S, et al. Using the coronary artery calcium score to guide statin therapy: a cost-effectiveness analysis. Circ Cardiovasc Qual Outcomes. 2014;7(2):276–284. doi: 10.1161/CIRCOUTCOMES.113.000799. [DOI] [PMC free article] [PubMed] [Google Scholar]
- 37.van Kempen BJ, Spronk S, Koller MT, et al. Comparative effectiveness and cost-effectiveness of computed tomography screening for coronary artery calcium in asymptomatic individuals. J Am Coll Cardiol. 2011;58(16):1690–1701. doi: 10.1016/j.jacc.2011.05.056. [DOI] [PubMed] [Google Scholar]
- 38.Blaha MJ, Budoff MJ, DeFilippis AP, et al. Associations between C-reactive protein, coronary artery calcium, and cardiovascular events: implications for the JUPITER population from MESA, a population-based cohort study. Lancet. 2011;378(9792):684–692. doi: 10.1016/S0140-6736(11)60784-8. [DOI] [PMC free article] [PubMed] [Google Scholar]
- 39.Messenger B, Li D, Nasir K, Carr JJ, Blankstein R, Budoff MJ. Coronary calcium scans and radiation exposure in the Multi-Ethnic Study of Atherosclerosis. Int J Cardiovasc Imaging. 2016;32(3):525–529. doi: 10.1007/s10554-015-0799-3. [DOI] [PMC free article] [PubMed] [Google Scholar]
- 40.Yang S, Kersting K, Terry G, Carr J, Natarajan S. Modeling coronary artery calcification levels from behavioral data in a clinical study. Presented at: 15th Conference on Artificial Intelligence on Medicine; June 17–20, 2015; Pavia, Italy. [Google Scholar]
- 41.Pursnani A, Massaro JM, D’Agostino RB, Sr, O’Donnell CJ, Hoffmann U. Guideline-based statin eligibility, coronary artery calcification, and cardiovascular events. JAMA. 2015;314(2):134–141. doi: 10.1001/jama.2015.7515. [DOI] [PMC free article] [PubMed] [Google Scholar]
- 42.Aberle DR, Adams AM, Berg CD, et al. National Lung Screening Trial Research Team Reduced lung-cancer mortality with low-dose computed tomographic screening. N Engl J Med. 2011;365(5):395–409. doi: 10.1056/NEJMoa1102873. [DOI] [PMC free article] [PubMed] [Google Scholar]
- 43.Gross M, Steffes M, Jacobs DR, Jr, et al. Plasma F2-isoprostanes and coronary artery calcification: the CARDIA Study. Clin Chem. 2005;51(1):125–131. doi: 10.1373/clinchem.2004.037630. [DOI] [PubMed] [Google Scholar]
Associated Data
This section collects any data citations, data availability statements, or supplementary materials included in this article.