

Abstract
With the fast advance of connectome imaging techniques, we have the opportunity of mapping the human brain pathways in vivo at unprecedented resolution. In this article we review the current developments of diffusion MRI for the reconstruction of anatomical pathways in connectome studies. We first introduce the background of diffusion MRI with an emphasis on the technical advances and challenges in state-of-the-art multi-shell acquisition schemes used in the Human Connectome Project (HCP). Characterization of the microstructural environment in the human brain is discussed from the tensor model to the general fiber orientation distribution (FOD) models that can resolve crossing fibers in each voxel of the image. Using FOD-based tractography, we describe novel methods for fiber bundle reconstruction and graph-based connectivity analysis. Building upon these novel developments, there have already been successful applications of connectome imaging techniques in reconstructing challenging brain pathways. Examples including retinofugal and brainstem pathways will be reviewed. Finally, we discuss future directions in connectome imaging and its interaction with other aspects of brain imaging research.
1. Introduction
Mapping the connectivity of brain circuits is fundamentally important for our understanding of the functions of human brain. Various neurological and mental disorders have been linked to the disruption of brain connectivity in circuits such as the cortico-striato-thalamo-cortical (CSTC) network,1–3 reward circuits,4 and limbic system.5 Tracer injection studies have been historically utilized for this mapping and continue to be the most reliable way of inferring axonal connection in mammalian brains,3, 6 but their usability is limited to animal studies. For in vivo mapping of human brain connectivity, magnetic resonance imaging (MRI) is the most powerful modality with its non-invasive nature and versatility in examining both the structure and function of the brain.
There are two main modalities for studying brain connectivity with MRI: diffusion and functional MRI. Diffusion MRI (dMRI) collects signals that are sensitive to the diffusion of water molecules along different directions.7, 8 DMRI data can be used to compute the probabilistic distribution of axonal orientations, which are then concatenated to establish structural connectivity across brain regions with tractography techniques.9, 10 Functional MRI (fMRI) measures the fluctuation of BOLD signals and establishes connectivity as the synchronization of fMRI signals at different brain locations.11–13 Since the invention of both techniques two decades ago, tremendous progress has been made both technologically and scientifically, which culminated in the funding of the Human Connectome Project (HCP - http://www.humanconnectomeproject.org/) by NIH in 2009.14, 15 In particular, we have witnessed over the last few years the dramatic advances and maturation of multiband imaging techniques and their adoption in connectome imaging protocols.16–18 This has resulted in almost two orders of magnitude increase of imaging data with much improved resolution spanning the spatial, temporal, and angular dimensions.19–21
These rich resources in connectome imaging present great opportunities to map human brain pathways at unprecedented accuracy. On the other hand, this avalanche of BIG DATA22, 23 in connectomics24, 25 also poses challenges for existing image analysis algorithms. This has stimulated the development of novel analytic solutions for studying brain connectivity in various aspects of connectome imaging. In this article we focus on the review of recent progresses of connectome imaging with diffusion MRI methods. We first introduce the basic concepts of diffusion imaging and related techniques for modeling brain microstructure. We also discuss the tractography techniques and how they can be used to reconstruct fiber bundles and study network connectivity. Finally, future research directions in connectome imaging and their application in neuroscientific research are presented.
2. Background of Diffusion Imaging
Understanding the diffusion imaging signal
In a diffusion MRI (dMRI) experiment, the data we collect are a series of 3D volumes. Among these volumes, some of them, called B0 images, are generated without the application of diffusion gradients. The rest of the images are acquired with varying diffusion gradients that are useful for characterizing axons in different spatial arrangements. As summarized in Table 1, key parameters in dMRI experiments include diffusion time, gradient strength, and gradient directions.26, 27 In principle, the diffusion signal is from the dephasing of the spins due to their displacement during a dMRI experiment. The diffusion time determines probabilistically how far the distance the water molecules, or the spins, will travel in a dMRI experiment. With the increase of the diffusion time, the spins will likely travel farther away from their original location and thus result in more attenuation in the MR signal. Besides the diffusion time, the gradient strength also affects the diffusion signal. The stronger the gradient strength, the more attenuation we have in the dMRI image. The effect of both diffusion time and gradient strength are summarized in the quantity called b-value. In conventional dMRI experiments, the b-value is fixed and only the gradient directions were changed to acquire a series of 3D volumes. This is the so-called single-shell Q-ball acquisition28 in contrast to the multi-shell acquisition scheme (Figure 1(d)–(f)) used in the connectome imaging protocols.20 In multi-shell experiments, a small set of different b-values are used in addition to the change of gradient directions. This provides an opportunity of more sophisticated modeling of water diffusion in human brain. More generally, we can have a different b-value for each gradient direction. This is the acquisition scheme adopted in the diffusion spectrum imaging (DSI).29 By fully sampling the q-space, DSI can theoretically recover the diffusion profile at each voxel, but it faces the challenges of long scan time and low signal to noise (SNR) at high b-values.
Table 1.
Some key parameters in diffusion imaging.
| Diffusion time Δ | Longer Δ results in more attenuation in diffusion signal. | |
| Gradient strength G | Stronger G results in more attenuation in diffusion signal. | |
|
b-value
|
Summarizes the effect of gradient strength and diffusion time, where γ is the gyromagnetic ratio (a constant), and δ is the duration of gradient encoding. | |
| Single-shell dMRI | Varying gradient directions with a fixed b-value. | |
| Multi-shell dMRI | Varying gradient directions with a small set of b-values. Three different b-values were used in HCP protocol. |
Figure 1.
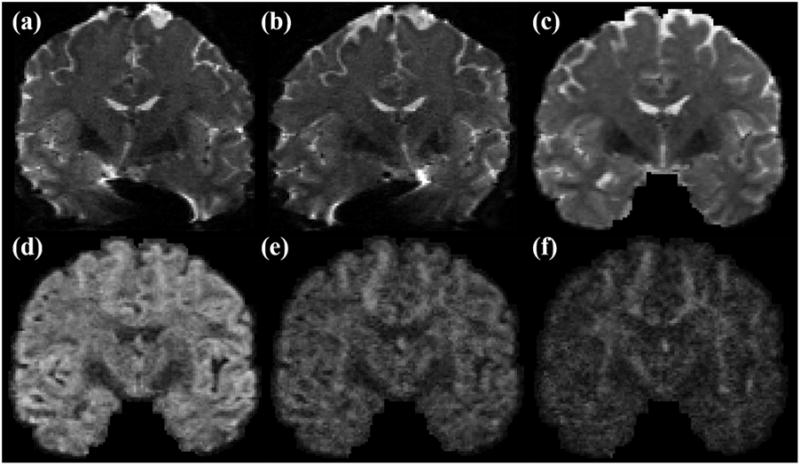
Multi-shell diffusion imaging from the Human Connectome Project. B0 images from L/R phase encoding (a) and R/L phase encoding (b) show the images were distorted in opposite phase encoding directions due to susceptibility in the magnetic field. (c) Corrected B0 image after removing susceptibility-induced distortion and merging the data from L/R and R/L phase encodings. Multi-shell diffusion imaging acquires data from several b-values. For the gradient directions along the x-axis, the images from b=1000, 2000, 3000 s/mm2 are shown in (d), (e), and (f), respectively. Note greater attenuation in the image intensity with an increased b-value.
Artifacts in diffusion imaging
The main artifacts in diffusion imaging include head motion, eddy currents,30 and susceptibility-induced distortion.31 Head motion and eddy currents lead to misalignment of brain regions across image volumes acquired with different gradient directions. These two types of artifacts are global in nature, so they are typically corrected in the same framework with image registration methods.32 The challenge, however, is the dramatic change of image signals with the variation of gradient directions. Early works relied on registration to the B0 images by modeling the head motion and eddy currents as affine transformations.30 With the availability of data from densely sampled gradient direction, more sophisticated models that rely on the prediction of the signals from neighboring gradient directions were developed.33 Under this framework, polynomial transformations can be applied to achieve improved performance in correcting distortions from eddy currents.34
Susceptibility-induced distortion is due to the inhomogeneity in the magnetic field. It is subject dependent, so every brain scan can have varying degrees of distortion. It is most severe in regions with a tissue-air boundary such as the orbital-frontal cortex or brainstem, so the distortion field is inherently local. Susceptibility-induced distortion not only distorts the brain image, but also results in the loss of signals. This is caused by the piling up of signals from multiple voxels into a single voxel. To correct for susceptibility-induced distortion, early work relied on the measurement of a field map and used that to correct for the geometric distortion,35 but this method is time consuming and cannot reverse the signal loss due to piling up of signals. More recently, methods based on collecting two copies of dMRI data with opposite phase encodings were developed (Figure 1(a)–(c)).36–38 This approach is based on the observation that the distortions from opposite phase encodings mirror each other. Technically this is also feasible with the dramatic increase of acquisition speed in the connectome imaging protocol. Compared with corrections based on field maps, better correction has been achieved with data from opposite phase encodings.37
Besides the artifacts mentioned above, other subtler artifacts such as bulk motion from cardiac pulsation are receiving more attention.39 The bulk motion from pulsation can cause the loss of diffusion signal in regions such as the brainstem. Cardiac gating has been proposed,40, 41 but it leads to a reduction of acquisition speed. For connectome imaging data, automated algorithms have been proposed recently to identify voxels with such artifacts and alter their numbers with predicted values from uncorrupted signals.42
3. Microstructural Models
Besides the MRI parameters such as diffusion time and gradient strength, the local microstructure of the brain also affects the diffusion imaging signal. For spins inside the myelinated axons, their diffusion is restricted in the transverse direction. For spins outside the axons, their diffusion is hindered by the surrounding cellular environment which includes the walls of the axons.43 With diffusion MRI data, our goal is to quantitatively characterize the microstructure of brain tissues and detect changes due to pathology.
Tensor models
To model the distribution of spins using the dMRI data, the Gaussian distribution was first proposed.7, 8 The tensor matrix in the Gaussian model is symmetric and contains six parameters. This model only needs six diffusion-weighted images, so the data acquisition can be conducted fairly efficiently on 1.5T MRI scanners, which was highly desirable in the early stages of diffusion MRI. For the robust estimation of the tensor, data from more gradient directions are typically acquired that range from 12 to 30 directions. Various numerical algorithms have been developed to estimate the tensor from dMRI data that ranges from direct least square fitting44 to more sophisticated approaches that ensure the non-negativity of the tensor matrix.45 Since its emergence, the tensor model has been used widely in various brain imaging studies. Presently, the term diffusion tensor imaging (DTI) is almost synonymous with diffusion imaging even though the field has advanced dramatically beyond the tensor models.
The eigen-structure of the tensor model provides some of the most popular features in connectivity studies.46 Since the tensor is a 3×3 matrix, it has three eigen-values and associated eigen-vectors. The largest eigen-value is called the axial diffusivity (AD), the mean value of the other two eigen-values defines the radial diffusivities (MD). These definitions reflect our desire to model the diffusion of spins along axons as elongated ellipsoids. Using these three eigenvalues, the fractional anisotropy (FA) is defined to characterize the anisotropy of the underlying diffusion. The FA can take values between 0 and 1. The FA is zero when the tensor is purely isotropic, i.e., the three eigen-values are equal. The FA increases when the tensor becomes more elongated, i.e., the water diffusion is more anisotropic. It reaches the value 1 when the tensor is a stick model with zero radial diffusivity.
The diffusivity measures are highly sensitive measures for the detection of microstructural changes. They have been applied in studying various neurological47–49 and mental disorders.50, 51 Extra-caution must be taken when interpreting these measures because multiple pathological events can lead to very similar changes in the diffusivity. This lack of specificity is one of the well-known limitations of diffusion imaging. While there were efforts that tried to separate the contributions of demyelination, axonal transection and edema,52, 53 significant research still needs to be done to translate such research into human studies.
High order tensors and tensor mixtures
For the modeling of the anisotropy in water diffusion, the tensor model is most suitable for locations where there is only one fiber direction. When there are more complicated configurations including fanning and crossing of fibers, we need more advanced data acquisition schemes and mathematical models. From the data acquisition perspective, high angular resolution diffusion imaging (HARDI) that collects data from a large number (60~100) of gradient directions at the same b-value has been helpful.28, 54 This motivates the development of more sophisticated modeling algorithms to better characterize the water diffusion from a complicated fiber architecture.
Similar to the Gaussian mixture model in statistics, the mixture of the tensor models55, 56 is a natural extension of the tensor to characterize the HARDI signal. There are several challenges, however, in this approach. First is the need to select the number of the components. If very few components are selected, we might miss important fiber directions and fail to properly characterize the dMRI signal. On the other hand, numerical problems can arise if too many components are used since the extra components might be forced to fit the noise in the dMRI signal. Because the complexity of the fiber architecture varies across different brain regions, it is impractical to fix the number of the components. The second challenge of the tensor mixture model is the nonlinearity of the optimization problem. In contrast to the tensor model, the optimization of the tensor mixture model is highly nonlinear, which means we might encounter local optima frequently. This is especially challenging given the possibility that the extra-tensor components can fit the noise. To alleviate this difficulty, Monte Carlo sampling and information-theoretic model selection were adopted.55
Fiber Orientation Distribution
Fiber orientation distribution (FOD)57, 58 is a non-negative function defined on the unit sphere with its values representing the probability of fiber tracts along each direction (Figure 2(a)). It is related but different from orientation distribution function (ODF), which is computed with a series of approximation steps in q-ball imaging.59 Compared with tensor mixture models, FOD has the flexibility in representing arbitrary fiber configurations without the need of specifying the number of fiber crossings a priori. The numerical solution of FOD is also more tractable as it typically consists of de-convolution steps that are quadratic or convex. 57, 58, 60–63 For these reasons, FOD is becoming increasingly popular and emerging as a standard representation of fiber connectivity.
Figure 2.

An illustration of fiber orientation distribution (FOD) reconstructed from HCP data with the method we developed recently.66 (a) FOD is a function on the unit sphere (top) and can be visualized as a 3D shape (bottom) by modulating the radius of the shape according to the magnitude of the FOD function. For an ROI shown as the red box in (b), the FODs are visualized in (c). With FOD-based tractography, a more complete representation of the corpus callosum can be reconstructed. Note the lateral projections of the corpus callosum were successfully captured. As shown in (e), a volume rendering can be created with 3 million fiber tracts to visualize the connectome of the human brain
Numerically the FOD is represented as a linear combination of spherical harmonics (SPHARM).64 Most existing tools for computing FODs were developed for single-shell diffusion MRI data. The multi-shell imaging data from HCP has motivated the development of novel FOD reconstruction algorithms.65–70 With the multi-shell and high angular resolution data from HCP, we can estimate FODs with high order SPHARMs.66 This generates very sharp FODs that will improve the resolution of crossing fibers at each voxel, which will no doubt assist the tractography algorithms for brain connectivity modeling (Figure 2). Besides FOD estimation, the multi-shell HCP data has enabled the incorporation of compartment modeling43, 71 into the estimation of FODs.66 These compartment parameters provide novel measures about the integrity of WM microstructure. The compartment models also improve the robustness of FOD estimation in regions with complicated tissue compositions such as the thalamus and GM/WM boundaries.
4. Tractography-based Mapping of Brain Pathways
Tractography methods
While there are many exciting advances in sophisticated tractography algorithms,72–74 the streamline approach is still the most widely applied method for fiber tractography using tensor or FODs.9, 10, 75 Intuitively, we can imagine this tractography algorithm is simulating the movement of a water molecule along the axons. The starting position of this tracking process is called a seed point. At each point of the tracking process, we utilize the FOD or tensor at the current location to generate the next direction to extend the tract. The water molecule is then moved along this direction for a specific distance, which is called the step size. The process is repeated until a stopping criterion is satisfied. The tract is accepted if it meets certain anatomical requirements that are typically problem specific.
There are several key factors that affect the results of fiber tractography. The first factor is the anatomical protocol that we prescribe to determine if a fiber tract is valid. This represents the anatomical knowledge we have about the specific circuits under study. Practically they are represented as the regions of interest (ROIs) that a fiber tract needs to pass or avoid. The second factor is the overall shape of the fiber tract has to be biologically plausible. Overall a smooth trajectory is expected. This is controlled by a combination of several parameters including the step size and maximum turning angle at each step. The third factor is how we generate the movement direction at each step. This is where the deterministic and probabilistic tractography deviate from each other.55, 75 For deterministic tractography, the peak direction of the tensor or FOD is selected. Since FODs have multiple peaks, one of them, typically the direction with the smallest angle with the incoming direction, will be selected. For probabilistic tractography, we view the FOD or tensor as mathematical representations of the probabilistic distribution of fiber directions. To obtain the next direction to move the water molecule, a stochastic procedure is run to draw a sample direction from this distribution. For each direction, the chance of it being selected is in proportion to its magnitude in the probabilistic distribution. This direction is accepted if it satisfies the shape constraints.
Fiber bundle reconstruction
One main application of tractography is reconstructing a digital representation of major white matter bundles (Figure 3). This is achieved via a carefully designed anatomical protocol including a set of AND ROIs that a fiber tract should pass and a set of NOT ROIs that the fiber tract should not touch.76–78 Because the number of AND ROIs is typically small (2~3), we need the NOT ROIs to add more control over the trajectory of the fiber bundle. In early studies, the ROIs were manually drawn on anatomical MRI images. This approach is time consuming and can only be conducted in studies with small sample sizes. For large scale studies such as the HCP, we need to develop automated algorithms that can leverage the recent development in brain image analysis algorithms. Using software tools such as FreeSurfer79 and FSL,80 we can extract a set of generic cortical and sub-cortical ROIs, but this is usually not enough. For additional ROIs that are needed for specific bundles, the label fusion framework81–83 provides a general strategy for automated volumetric ROI segmentation, which we have also extended to surface ROIs.84 This entails the manual delineation of the necessary ROIs on a set of representative subjects. After that, these masks are warped to the image space of new subjects with a nonlinear registration software tool.85 The ROIs of the new subjects are finally formed via the fusion of these warped ROIs based on a weighted voting process. The general workflow can be applied to both gray matter and white matter regions. For challenging situations where there is a lack of visible contrast in available MRIs for manual segmentation, innovative strategies must be developed. For example, a combination of contextual information from surrounding nuclei and the continuity of the retinofugal tracts in the digital space were proposed to automatically define the lateral geniculate nuclei (LGN) for the reconstruction of the optical radiation.86
Figure 3.

With connectome imaging data, we can more accurately reconstruct human brain pathways using FOD-based tractography and anatomical ROIs. (a) ROIs in the medulla and thalamus were used to reconstruct the spinothalamic pathway. (b) For the reconstruction of the fornix bundle, we use multiple ROIs including the hippocampus, a fornix ROI, mammillary body, and basal forebrain. Here two of the ROIs were plotted: red: fornix; green: mammillary body. (c) The reconstructed fornix bundle is overlaid with the hippocampal surfaces. Note that two branches to the mammillary body (posterior branch) and the basal forebrain (anterior branch) have been successfully reconstructed. (d) Surface-based ROIs were used for the reconstruction of the uncinated fasciculus. Green: orbital-frontal cortex; Red: anterior temporal cortex. (e) The reconstructed uncinated fasciculi on both hemispheres are overlaid with the cortical surfaces. (f) Corpus callosum bundle connecting the precentral gyrus (motor cortex) of both hemispheres have been reconstructed with ROIs including the precentral gyrus and the middle sagittal corpus callosum ROI. Both ROIs are rendered as 3D surfaces in this plot.
Even with the constraint of multiple ROIs, it is common for the reconstructed fiber bundle to contain outlier tracts. Possible causes include the complexity of the anatomy, too much freedom in probabilistic tractography, or noise in the estimated FODs. For small scale studies, manual editing can be applied to remove the outliers in the bundles. For large scale studies, various automated filtering strategies have been developed. Intuitively we have two ways to identify outlier tracts. The first approach is based on the observation that outlier tracts tend to be far away from the “main” bundle. Mathematically this can be captured as distance measures between fiber tracts differential geometry. Using the pairwise distances between tracts, a spectral clustering technique can be applied to divide the fiber tracts into clusters of tracts.87 After that, small clusters can be removed as outliers. This has been successfully applied in various fiber bundle clustering projects.88 The difficulty with this approach is the lack of intuition in tuning the parameters for the spectral clustering. For individual bundles, a fine tuning process is needed to find the optimal parameters for large scale application. The second possible approach for identifying outliers is based on the density of fiber tracts. This assumes that outliers are more scattered in space and they have lower density than the main bundle. To implement this idea numerically, we can convert the fiber tracts into a tract density image (TDI)89 and then remove the outliers following thresholding the TDI image. Based on the TDI representation of fiber bundles, topological analysis strategies can also be developed to remove the outliers.90 For large scale brain imaging studies, a successful reconstruction of fiber bundles might need a combination of multiple tract filtering approaches since each of them captures a somewhat different aspect of outlier tracts.
Graph-based modeling
Using fiber tractography, we can also build network models of brain connectomes91 and apply graph-based measures to study connectivity.92, 93 There are two main steps in conducting network studies in brain imaging. The first step is graph construction and the second step is the calculation of various network measures.
A graph is composed of a set of nodes and edges. Two nodes are connected if there is an edge between them. To define the nodes for brain connectomes, various approaches have been proposed to parcellate the brain into many smaller regions. A popular choice is to use cortical labels produced from software tools such as FreeSurfer,79 or warping an atlas with cortical labels, such as the LPBA40 atlas,94 to the subject space. More fine-grained parcellation can be obtained by further dividing these regions.91 These parcellations, based on structural MRIs, can be further improved with multimodal information. Recent results from HCP suggest that a detailed parcellation can be obtained using functional connectivity patterns,95 but it relies on manual interaction. Overall the definition of nodes in connectome studies is still an open question that needs further technical and scientific investigations. Once we have a set of nodes, we can define the edges using fiber tractography, which could be weighted or unweighted. If there are fiber tracts connecting two ROIs, we can define the connectivity using quantities such as the number of tracts, mean values of diffusivity and fractional anisotropy (FA). By thresholding the weights on the edges, we can also obtain a binary graph where the weight on an edge is either 1 (connected) or 0 (unconnected).
Once the graph construction is completed, a matrix representation can be generated where each entry records the edge weight of corresponding node pairs denoted by the row and column index of the matrix. Basic measures such as the degree of nodes and shortest path can be computed easily from the matrix representation. More advanced measures such as characteristic path length and clustering coefficients can then be derived from these basic measures.25, 96 Based on these measures, small-worldness can be defined,92 which compares the clustering of nodes and their distances to random graphs. More recently, quantitative measures for hubs and rich clubs were proposed and successfully applied to imaging studies of psychiatry studies.97 Together with fiber bundles for specific circuits, network measures are valuable to provide complementary, global characterizations about the connectivity of brain networks.
5. Application of Connectome Imaging in Mapping Brain Pathways
With the high resolution data from connectome imaging, we have the opportunity to extend the reconstruction of human brain pathways with increased completeness and capturing more fine-grained details. While these high quality connectome imaging data of HCP are only available recently, there have already been active research efforts in utilizing them to reconstruct pathways that were difficult to achieve with conventional diffusion imaging techniques. Here we review progress of these early studies in the reconstruction of visual pathways, brainstem pathways, and language pathways. Because the application of the HCP connectome imaging protocol in psychiatry studies has been limited to date, we provide these examples to demonstrate the utility of brain pathway reconstruction with cutting-edge MRI methods. This hopefully will motivate rapid adoption of the connectome imaging protocol in future psychiatry studies.
Visual pathways
The retinofugal pathways include the optic nerves, optic chiasm, optic tracts, lateral geniculate nuclei (LGN), and the optic radiation. While various methods were proposed to reconstruct these important pathways with diffusion MRI, the unique complexities of the visual pathway have impeded the development of a robust and automated reconstruction method with tractography. The difficulties include the crossing fibers at the chiasm, the tortuous course of Meyer’s loop, proximity to multiple neighboring fiber bundles, and limited contrast of the LGN in structural MRIs. We have developed an automated system for the reconstruction of the retinofugal visual pathway from optic chiasm (OC) to the primary visual cortex 98 and the corpus callosum. With HCP data, our group has developed an automated system to overcome these challenges. The ultra-sharp FODs computed by our method from HCP data greatly enhance our ability to capture Meyer’s loop in the temporal stem where multiple major fiber bundles cross 99. Our system also automatically identifies related anatomical ROIs including the Lateral Geniculate Nucleus (LGN) and primary visual cortex (V1), and reconstructs anatomically faithful representations of the visual pathway. As shown in Figure 4, the sharp FODs from our method are able to generate highly organized fiber tracts that follow the retinotopic organization of the visual pathway. Quantitative measurements also show that our results achieve excellent agreement with post-mortem dissection studies100 and the Contrack method101, a DTI study based on manual intervention. Using reconstructed bundles of the 215 HCP subjects, we also found a statistically significant leftward asymmetry of the optic radiation volume that is consistent with post-mortem studies.102
Figure 4.

Retinofugal visual pathway reconstruction results. (a) Top: FODs at the optic chiasm; Bottom: the ipsilateral and contralateral branches of the optic tracts were reconstructed from the FODs. Reconstructed fiber bundles from an HCP subject. (b) Post-mortem dissection result 100 shows the retinotopic organization of the optic radiation. (c) Retinotopic parcellation of the left optic radiation fiber bundle reconstructed by our method as shown in (a). Red, blue, green represent fiber projecting to the foveal, superior and inferior quadrant of the peripheral visual field, respectively. (d) The reconstructed retinofugal pathways including the optic tract and optic radiation of both hemispheres. (e) Using the cortical projection of the visual pathway, detailed retinotopic coordinates (eccentricity, angle) can be assigned to each fiber tract. Here the eccentricity map on the cortex. (f) A cross-section of the optic radiation bundle with tracts colored by the eccentricity as defined through their projection onto V1.
Brainstem pathways
The brainstem regulates vital and autonomic functions, relays motor and sensory information between the brain and peripheral nervous system, and modulates cognition, mood, and emotions.103, 104 Fiber pathways from brainstem nuclei innervate extensive cortical and sub-cortical regions and play important modulatory roles in various cognitive and behavioral functions.105 Due to the complexity of brainstem anatomy and limited resolution of conventional diffusion MRI, it has been a challenge to reliably map the brainstem pathways. With the much improved resolution from connectome imaging techniques, there has been growing interest in studying the brainstem related pathways. Using an averaged dataset created from 488 HCP subjects, a comprehensive set of brainstem pathways were reconstructed.106 The validity of the trajectories of the reconstruction results were compared with histology images of five postmortem brains at various sections of the brainstem. A probabilistic atlas of cerebellar peduncles was also developed recently with data from 90 HCP subjects.107 The inferior, middle, and superior cerebellar peduncles were reconstructed from each brain and aligned to create the probabilistic atlas. For the in vivo reconstruction of the pathways in the homeostatic network of human brains,108 high resolution DSI data were collected with the MGH-USC Connectome scanner that has 300 mT/m maximum gradient strengths and a 64-channel coil. The 55 minute DSI protocol included 515 q-space samples, and its maximum b-value is 10,000 s/mm2. With this dataset, a central homeostatic network (CHN) between six Brainstem nuclei and seven forebrain regions were reconstructed. The connectivity matrix was formed by counting streamline probability between each pair of brainstem and forebrain regions. Detailed examination of the fiber tracts was conducted and branches of the medical forebrain bundles and a lateral forebrain bundle from brain stem to medial temporal lobe were identified.
Language pathways
The superior longitudinal fasciculus (SLF) and arcuate fasciculus (AF) are important components of the language networks. The exact pathways of these two fiber systems, however, are still under debate in previous DTI studies. While some DTI studies considered the AF as composed of the ventral and dorsal segments,109 others classified the most ventral segment of SLF (SLF III) as part of indirect segments of AF.110 By comparing the tractography reconstruction of HCP data with the dissection results of 25 post-mortem brains, the detailed pathways of the SLF and AF were examined by Yagmurlu et al.111 Three SLF segments (dorsal SLF I, middle SLF II, and ventral SLF III segments) and two AF segments (ventral and dorsal) were robustly reconstructed on both dissection and tractography reconstruction. In particular, the topographic relation of the AF pathways and the SLF3 segments were clearly identified.
These results provided a glimpse of the possibility with connectome imaging data for improving the state-of-the-art in fiber pathway reconstruction. Overall we can see more faithful characterization of brain anatomy could be achieved with careful application of the connectome image techniques. With the wider application of these methods to other under-explored brain regions, it is anticipated more exciting progress will be made in the coming years.
6. Future Directions
The connectome imaging techniques represent a leap in brain imaging capabilities that provide a whole new paradigm for studying human brains in vivo. While great advances have been achieved in the last decade, this is a fast moving field and we anticipate major advances in the following areas.
Continued improvement in imaging technology
Current connectome imaging protocols have already achieved more than one order of magnitude speed up in acquiring diffusion and functional MRI data. However, the relative long acquisition time of the full HCP protocol poses serious challenges for their adoption in disease studies. Even with the state-of-the-art 3T MRI scanners, only a portion of the HCP protocol can be included in disease studies. There is thus a great need to further optimize imaging protocols for multiple time frames suitable for imaging research and clinical applications. Continued research in multiband and parallel imaging techniques will no doubt help in this aspect. Optimization of existing connectome protocols for a given time frame should also be investigated, where the challenge is the definition of a gold standard for the trade-off between spatial resolution, number of gradient directions, and distribution of b-values. In our current research, we find that the retinotopic organization of the visual pathway provides an ideal testbed for the in vivo validation of tractography techniques.112 There are other brain regions that also have well-characterized anatomy such as the cortical-striatum connections.3 These can serve as valuable resources for quantification of the performance of different acquisition schemes. The extension of connectome imaging to 7T MRI is another exciting direction.113 Major advances have been achieved for 7T diffusion and function MRI acquisition in HCP. In principal 7T MRI will provide higher SNR and improved resolution, thus there is a great opportunity for more fine-grained mapping of brain pathways. Besides advances in image acquisition, we will witness continued research and improvement in image processing algorithms. Novel pre-processing methods will help the correction of imaging artifacts such as eddy current and susceptibility distortion and signal dropout due to bulk movement. The fusion of data from multiple phase encodings also needs more dedicated research to improve signal quality for connectome modeling. Innovations in post-processing algorithms will lead to better tractography algorithms that can more faithfully represent brain anatomy such as the topographic organization fiber bundles.112 Compartment modeling has the potential of separating intra- and extra-axonal changes in tissue microstructure.43, 114–116 More sophisticated algorithms in compartment modeling, such as the NODDI model,117 could provide novel opportunities for improving the specificity in the characterization of connectivity changes.
Validation of microstructure and tractography methods
One fundamental question in connectome imaging is the validation of the digital connectivity from MRI data. While it is generally difficult to obtain ground truth about human brain connections, detailed anatomical knowledge is available for certain pathways that can be used to quantitatively evaluate the performance of tractography methods. One particular example is the topographic organization of sensory pathways such as the retinotopic organization of the visual pathway118 and the somatotopic organization of the somatosensory pathway.119 Such topographic organization provides an ideal opportunity for examining the pathway integrity at specific locations when the topographic location of atrophy is known from separate measurements such as retinal imaging. More generally, animal tracing studies provide the ground truth about brain connectivity, but the number of injection sites were usually limited.120–122 For mouse brain tracing studies, tremendous progress has been made with the creation of detailed connectomes with whole brain coverage.6, 123 These are highly valuable resources for examining the performance of tractography algorithms.124, 125 Such validation experiments will improve our understanding about the impact of model selection and various parameters in tractography. For postmortem tissues, immunohistochemistry-based staining will provide valuable information for the validation of compartment models.126 By measuring myelin content and the volume of extra-axonal cellular structures, we can quantify the agreement between compartment models and tissue compositions. Overall there is a great need to validate the cutting-edge connectome imaging methods and we believe this need will be met with additional validation studies using biological ground truth. While these validation experiments using postmortem samples are critical, their translation to in vivo studies should also be carefully investigated. This could be achieved with carefully designed and streamlined experiments that include in vivo MRI, tracer injections and post-mortem MRI and measurement from immune-histology. To carry out these sophisticated experiments and data analysis, it is important to foster the collaboration between multi-disciplinary teams with complimentary expertise.
Multimodal connectivity fusion
The functional connectivity from resting fMRI is mainly derived from the correlation of the BOLD signal in gray matter regions. Tractography methods are capable of mapping pathways across white matter regions. In principle these two modalities provide complimentary information. The challenges, however, are to develop effective methods to fuse the connectivity information from these two approaches.127 Existing methods are mostly limited to post-hoc analysis that either tests the functional connectivity between the two ends of a fiber bundle or the structural connectivity between functional ROIs, such as the nodes of default mode networks. For future development, more focus will be devoted to improving the structural connectomes with functional connectivity, or vice versa. For example, one key question is the enhancement of the predictive power of functional connectivity with structural connectivity. The focus will be on tractography methods with reduced false positives and negatives such as the novel methods that aim to preserving the topographic regularity of fiber tracts.112 Dynamic functional connectivity is another promising direction that holds the potential for detecting transient connectivity between brain regions.128, 129 This could boost the anatomical priors for computing structural connectivity. Besides function MRI, other imaging modalities can also improve the computation of structural connectivity. The myelin content from quantitative T2 can potentially be combined with the compartment modeling from multi-shell dMRI.130, 131
Deep connectome phenotyping for brain imaging studies
With conventional DTI technology, major cortical bundles have been successfully reconstructed and widely used in various imaging studies. The high resolution connectome imaging methods will no doubt improve the reliability and accuracy for these major bundles. Furthermore, the FOD-based tractography from connectome imaging data will enable the reconstruction of more detailed fascicles and allow us to generate a more complete description of systems such as the cortico-striato-thalamo-cortical (CSTC) network and the limbic system. Using connectome imaging, we have the opportunity to develop robust algorithms and software tools to systematically characterize the integrity of these circuits. In addition to in-depth modeling and quantification of these brain circuits, connectome-based parcellation95, 132, 133 will produce whole brain network models at much finer resolution than existing works. Together with multimodal fusion strategies, these connectome features will form a set of deep phenotypes for mining with genetic and behavioral data. This matches perfectly with current developments in Big Data and deep learning methods.134
Acknowledgments
This work was in part supported by NIH Grants R01EB022744, K01EB013633, P41EB015922, U54EB020406, R01MH094343.
References
- 1.Ahmari SE, Spellman T, Douglass NL, Kheirbek MA, Simpson HB, Deisseroth K, et al. Repeated Cortico-Striatal Stimulation Generates Persistent OCD-Like Behavior. Science. 2013;340(6137):1234–1239. doi: 10.1126/science.1234733. [DOI] [PMC free article] [PubMed] [Google Scholar]
- 2.Burguière E, Monteiro P, Feng G, Graybiel AM. Optogenetic Stimulation of Lateral Orbitofronto-Striatal Pathway Suppresses Compulsive Behaviors. Science. 2013;340(6137):1243–1246. doi: 10.1126/science.1232380. [DOI] [PMC free article] [PubMed] [Google Scholar]
- 3.Haber SN. Corticostriatal circuitry. Dialogues Clin Neurosci. 2016;18(1):7–21. doi: 10.31887/DCNS.2016.18.1/shaber. [DOI] [PMC free article] [PubMed] [Google Scholar]
- 4.Haber SN, Knutson B. The reward circuit: linking primate anatomy and human imaging. Neuropsychopharmacology. 2010;35(1):4–26. doi: 10.1038/npp.2009.129. [DOI] [PMC free article] [PubMed] [Google Scholar]
- 5.Rolls ET. Limbic systems for emotion and for memory, but no single limbic system. Cortex. 2015;62:119–157. doi: 10.1016/j.cortex.2013.12.005. [DOI] [PubMed] [Google Scholar]
- 6.Zingg B, Hintiryan H, Gou L, Song MY, Bay M, Bienkowski MS, et al. Neural networks of the mouse neocortex. Cell. 2014;156(5):1096–1111. doi: 10.1016/j.cell.2014.02.023. [DOI] [PMC free article] [PubMed] [Google Scholar]
- 7.Basser PJ, Mattiello J, LeBihan D. MR diffusion tensor spectroscopy and imaging. Biophysical Journal. 1994;66(1):259–267. doi: 10.1016/S0006-3495(94)80775-1. [DOI] [PMC free article] [PubMed] [Google Scholar]
- 8.Basser PJ, Jones DK. Diffusion-tensor MRI: theory, experimental design and data analysis - a technical review. NMR in Biomedicine. 2002;15(7–8):456–467. doi: 10.1002/nbm.783. [DOI] [PubMed] [Google Scholar]
- 9.Mori S, Crain BJ, Chacko VP, Van Zijl PCM. Three-dimensional tracking of axonal projections in the brain by magnetic resonance imaging. Annals of Neurology. 1999;45(2):265–269. doi: 10.1002/1531-8249(199902)45:2<265::aid-ana21>3.0.co;2-3. [DOI] [PubMed] [Google Scholar]
- 10.Basser PJ, Pajevic S, Pierpaoli C, Duda J, Aldroubi A. In vivo fiber tractography using DT-MRI data. Magnetic Resonance in Medicine. 2000;44(4):625–632. doi: 10.1002/1522-2594(200010)44:4<625::aid-mrm17>3.0.co;2-o. [DOI] [PubMed] [Google Scholar]
- 11.van den Heuvel MP, Hulshoff Pol HE. Exploring the brain network: a review on resting-state fMRI functional connectivity. Eur Neuropsychopharmacol. 2010;20(8):519–534. doi: 10.1016/j.euroneuro.2010.03.008. [DOI] [PubMed] [Google Scholar]
- 12.Van Dijk KRA, Hedden T, Venkataraman A, Evans KC, Lazar SW, Buckner RL. Intrinsic Functional Connectivity As a Tool For Human Connectomics: Theory, Properties, and Optimization. Journal of Neurophysiology. 2010;103(1):297–321. doi: 10.1152/jn.00783.2009. [DOI] [PMC free article] [PubMed] [Google Scholar]
- 13.Biswal B, Yetkin FZ, Haughton VM, Hyde JS. Functional connectivity in the motor cortex of resting human brain using echo-planar MRI. Magn Reson Med. 1995;34(4):537–541. doi: 10.1002/mrm.1910340409. [DOI] [PubMed] [Google Scholar]
- 14.Toga AW, Clark KA, Thompson PM, Shattuck DW, Van Horn JD. Mapping the Human Connectome. Neurosurgery. 2012;71(1):1–5. doi: 10.1227/NEU.0b013e318258e9ff. [DOI] [PMC free article] [PubMed] [Google Scholar]
- 15.Van Essen DC, Smith SM, Barch DM, Behrens TE, Yacoub E, Ugurbil K, et al. The WU-Minn Human Connectome Project: an overview. Neuroimage. 2013;80:62–79. doi: 10.1016/j.neuroimage.2013.05.041. [DOI] [PMC free article] [PubMed] [Google Scholar]
- 16.Feinberg DA, Moeller S, Smith SM, Auerbach E, Ramanna S, Gunther M, et al. Multiplexed echo planar imaging for sub-second whole brain FMRI and fast diffusion imaging. PLoS One. 2010;5(12):e15710. doi: 10.1371/journal.pone.0015710. [DOI] [PMC free article] [PubMed] [Google Scholar]
- 17.Moeller S, Yacoub E, Olman CA, Auerbach E, Strupp J, Harel N, et al. Multiband multislice GE-EPI at 7 tesla, with 16-fold acceleration using partial parallel imaging with application to high spatial and temporal whole-brain fMRI. Magn Reson Med. 2010;63(5):1144–1153. doi: 10.1002/mrm.22361. [DOI] [PMC free article] [PubMed] [Google Scholar]
- 18.Setsompop K, Gagoski BA, Polimeni JR, Witzel T, Wedeen VJ, Wald LL. Blipped-controlled aliasing in parallel imaging for simultaneous multislice echo planar imaging with reduced g-factor penalty. Magn Reson Med. 2012;67(5):1210–1224. doi: 10.1002/mrm.23097. [DOI] [PMC free article] [PubMed] [Google Scholar]
- 19.Setsompop K, Kimmlingen R, Eberlein E, Witzel T, Cohen-Adad J, McNab JA, et al. Pushing the limits of in vivo diffusion MRI for the Human Connectome Project. Neuroimage. 2013;80:220–233. doi: 10.1016/j.neuroimage.2013.05.078. [DOI] [PMC free article] [PubMed] [Google Scholar]
- 20.Sotiropoulos SN, Jbabdi S, Xu J, Andersson JL, Moeller S, Auerbach EJ, et al. Advances in diffusion MRI acquisition and processing in the Human Connectome Project. Neuroimage. 2013;80:125–143. doi: 10.1016/j.neuroimage.2013.05.057. [DOI] [PMC free article] [PubMed] [Google Scholar]
- 21.Ugurbil K, Xu J, Auerbach EJ, Moeller S, Vu AT, Duarte-Carvajalino JM, et al. Pushing spatial and temporal resolution for functional and diffusion MRI in the Human Connectome Project. Neuroimage. 2013;80:80–104. doi: 10.1016/j.neuroimage.2013.05.012. [DOI] [PMC free article] [PubMed] [Google Scholar]
- 22.Toga AW, Foster I, Kesselman C, Madduri R, Chard K, Deutsch EW, et al. Big biomedical data as the key resource for discovery science. J Am Med Inform Assoc. 2015;22(6):1126–1131. doi: 10.1093/jamia/ocv077. [DOI] [PMC free article] [PubMed] [Google Scholar]
- 23.Van Horn JD, Toga AW. Human neuroimaging as a “Big Data” science. Brain Imaging Behav. 2014;8(2):323–331. doi: 10.1007/s11682-013-9255-y. [DOI] [PMC free article] [PubMed] [Google Scholar]
- 24.Behrens TE, Sporns O. Human connectomics. Curr Opin Neurobiol. 2012;22(1):144–153. doi: 10.1016/j.conb.2011.08.005. [DOI] [PMC free article] [PubMed] [Google Scholar]
- 25.Bullmore E, Sporns O. Complex brain networks: graph theoretical analysis of structural and functional systems. Nature Reviews Neuroscience. 2009;10(3):186–198. doi: 10.1038/nrn2575. [DOI] [PubMed] [Google Scholar]
- 26.Basser PJ, Özarslan E. Diffusion MRI. 2. Academic Press; San Diego: 2014. Chapter 1 - Introduction to Diffusion MR; pp. 3–9. [Google Scholar]
- 27.Pipe J. Diffusion MRI. 2. Academic Press; San Diego: 2014. Chapter 2 - Pulse Sequences for Diffusion-Weighted MRI; pp. 11–34. [Google Scholar]
- 28.Tuch DS. Q-ball imaging. Magnetic Resonance in Medicine. 2004;52(6):1358–1372. doi: 10.1002/mrm.20279. [DOI] [PubMed] [Google Scholar]
- 29.Wedeen VJ, Hagmann P, Tseng W-YI, Reese TG, Weisskoff RM. Mapping complex tissue architecture with diffusion spectrum magnetic resonance imaging. Magnetic Resonance in Medicine. 2005;54(6):1377–1386. doi: 10.1002/mrm.20642. [DOI] [PubMed] [Google Scholar]
- 30.Jezzard P, Barnett AS, Pierpaoli C. Characterization of and correction for eddy current artifacts in echo planar diffusion imaging. Magn Reson Med. 1998;39(5):801–812. doi: 10.1002/mrm.1910390518. [DOI] [PubMed] [Google Scholar]
- 31.Jezzard P, Clare S. Sources of distortion in functional MRI data. Hum Brain Mapp. 1999;8(2–3):80–85. doi: 10.1002/(SICI)1097-0193(1999)8:2/3<80::AID-HBM2>3.0.CO;2-C. [DOI] [PMC free article] [PubMed] [Google Scholar]
- 32.Rohde GK, Barnett AS, Basser PJ, Marenco S, Pierpaoli C. Comprehensive approach for correction of motion and distortion in diffusion-weighted MRI. Magn Reson Med. 2004;51(1):103–114. doi: 10.1002/mrm.10677. [DOI] [PubMed] [Google Scholar]
- 33.Andersson JL, Sotiropoulos SN. Non-parametric representation and prediction of single- and multi-shell diffusion-weighted MRI data using Gaussian processes. Neuroimage. 2015;122:166–176. doi: 10.1016/j.neuroimage.2015.07.067. [DOI] [PMC free article] [PubMed] [Google Scholar]
- 34.Andersson JL, Sotiropoulos SN. An integrated approach to correction for off-resonance effects and subject movement in diffusion MR imaging. Neuroimage. 2016;125:1063–1078. doi: 10.1016/j.neuroimage.2015.10.019. [DOI] [PMC free article] [PubMed] [Google Scholar]
- 35.Jezzard P, Balaban RS. Correction for geometric distortion in echo planar images from B0 field variations. Magn Reson Med. 1995;34(1):65–73. doi: 10.1002/mrm.1910340111. [DOI] [PubMed] [Google Scholar]
- 36.Andersson JLR, Skare S, Ashburner J. How to correct susceptibility distortions in spin-echo echo-planar images: application to diffusion tensor imaging. NeuroImage. 2003;20(2):870–888. doi: 10.1016/S1053-8119(03)00336-7. [DOI] [PubMed] [Google Scholar]
- 37.Holland D, Kuperman JM, Dale AM. Efficient correction of inhomogeneous static magnetic field-induced distortion in Echo Planar Imaging. Neuroimage. 2010;50(1):175–183. doi: 10.1016/j.neuroimage.2009.11.044. [DOI] [PMC free article] [PubMed] [Google Scholar]
- 38.Irfanoglu MO, Modi P, Nayak A, Hutchinson EB, Sarlls J, Pierpaoli C. DR-BUDDI (Diffeomorphic Registration for Blip-Up blip-Down Diffusion Imaging) method for correcting echo planar imaging distortions. Neuroimage. 2015;106:284–299. doi: 10.1016/j.neuroimage.2014.11.042. [DOI] [PMC free article] [PubMed] [Google Scholar]
- 39.Norris DG. Implications of bulk motion for diffusion-weighted imaging experiments: effects, mechanisms, and solutions. J Magn Reson Imaging. 2001;13(4):486–495. doi: 10.1002/jmri.1072. [DOI] [PubMed] [Google Scholar]
- 40.Skare S, Andersson JL. On the effects of gating in diffusion imaging of the brain using single shot EPI. Magn Reson Imaging. 2001;19(8):1125–1128. doi: 10.1016/s0730-725x(01)00415-5. [DOI] [PubMed] [Google Scholar]
- 41.Nunes RG, Jezzard P, Clare S. Investigations on the efficiency of cardiac-gated methods for the acquisition of diffusion-weighted images. J Magn Reson. 2005;177(1):102–110. doi: 10.1016/j.jmr.2005.07.005. [DOI] [PubMed] [Google Scholar]
- 42.Andersson JL, Graham MS, Zsoldos E, Sotiropoulos SN. Incorporating outlier detection and replacement into a non-parametric framework for movement and distortion correction of diffusion MR images. Neuroimage. 2016 doi: 10.1016/j.neuroimage.2016.06.058. [DOI] [PubMed] [Google Scholar]
- 43.Assaf Y, Basser PJ. Composite hindered and restricted model of diffusion (CHARMED) MR imaging of the human brain. NeuroImage. 2005;27(1):48–58. doi: 10.1016/j.neuroimage.2005.03.042. [DOI] [PubMed] [Google Scholar]
- 44.Basser PJ, Mattiello J, LeBihan D. Estimation of the effective self-diffusion tensor from the NMR spin echo. J Magn Reson B. 1994;103(3):247–254. doi: 10.1006/jmrb.1994.1037. [DOI] [PubMed] [Google Scholar]
- 45.Koay CG, Chang LC, Carew JD, Pierpaoli C, Basser PJ. A unifying theoretical and algorithmic framework for least squares methods of estimation in diffusion tensor imaging. J Magn Reson. 2006;182(1):115–125. doi: 10.1016/j.jmr.2006.06.020. [DOI] [PubMed] [Google Scholar]
- 46.Basser PJ, Pierpaoli C. Microstructural and physiological features of tissues elucidated by quantitative-diffusion-tensor MRI. J Magn Reson B. 1996;111(3):209–219. doi: 10.1006/jmrb.1996.0086. [DOI] [PubMed] [Google Scholar]
- 47.Nir TM, Jahanshad N, Villalon-Reina JE, Toga AW, Jack CR, Weiner MW, et al. Effectiveness of regional DTI measures in distinguishing Alzheimer’s disease, MCI, and normal aging. Neuroimage Clin. 2013;3:180–195. doi: 10.1016/j.nicl.2013.07.006. [DOI] [PMC free article] [PubMed] [Google Scholar]
- 48.Ringman JM, O’Neill J, Geschwind D, Medina L, Apostolova LG, Rodriguez Y, et al. Diffusion tensor imaging in preclinical and presymptomatic carriers of familial Alzheimer’s disease mutations. Brain. 2007;130(7):1767–1776. doi: 10.1093/brain/awm102. [DOI] [PubMed] [Google Scholar]
- 49.Yassa MA, Muftuler LT, Stark CE. Ultrahigh-resolution microstructural diffusion tensor imaging reveals perforant path degradation in aged humans in vivo. Proc Natl Acad Sci U S A. 2010;107(28):12687–12691. doi: 10.1073/pnas.1002113107. [DOI] [PMC free article] [PubMed] [Google Scholar]
- 50.Koch K, Reess TJ, Rus OG, Zimmer C, Zaudig M. Diffusion tensor imaging (DTI) studies in patients with obsessive-compulsive disorder (OCD): a review. J Psychiatr Res. 2014;54:26–35. doi: 10.1016/j.jpsychires.2014.03.006. [DOI] [PubMed] [Google Scholar]
- 51.Kubicki M, Westin C-F, Maier SE, Frumin M, Nestor PG, Salisbury DF, et al. Uncinate Fasciculus Findings in Schizophrenia: A Magnetic Resonance Diffusion Tensor Imaging Study. American Journal of Psychiatry. 2002;159(5):813–820. doi: 10.1176/appi.ajp.159.5.813. [DOI] [PMC free article] [PubMed] [Google Scholar]
- 52.Song SK, Sun SW, Ju WK, Lin SJ, Cross AH, Neufeld AH. Diffusion tensor imaging detects and differentiates axon and myelin degeneration in mouse optic nerve after retinal ischemia. Neuroimage. 2003;20(3):1714–1722. doi: 10.1016/j.neuroimage.2003.07.005. [DOI] [PubMed] [Google Scholar]
- 53.Sun SW, Liang HF, Trinkaus K, Cross AH, Armstrong RC, Song SK. Noninvasive detection of cuprizone induced axonal damage and demyelination in the mouse corpus callosum. Magn Reson Med. 2006;55(2):302–308. doi: 10.1002/mrm.20774. [DOI] [PubMed] [Google Scholar]
- 54.Tuch DS, Reese TG, Wiegell MR, Makris N, Belliveau JW, Wedeen VJ. High angular resolution diffusion imaging reveals intravoxel white matter fiber heterogeneity. Magnetic Resonance in Medicine. 2002;48(4):577–582. doi: 10.1002/mrm.10268. [DOI] [PubMed] [Google Scholar]
- 55.Behrens TEJ, Berg HJ, Jbabdi S, Rushworth MFS, Woolrich MW. Probabilistic diffusion tractography with multiple fibre orientations: What can we gain? NeuroImage. 2007;34(1):144–155. doi: 10.1016/j.neuroimage.2006.09.018. [DOI] [PMC free article] [PubMed] [Google Scholar]
- 56.Peled S, Friman O, Jolesz F, Westin C-F. Geometrically constrained two-tensor model for crossing tracts in DWI. Magnetic Resonance Imaging. 2006;24(9):1263–1270. doi: 10.1016/j.mri.2006.07.009. [DOI] [PMC free article] [PubMed] [Google Scholar]
- 57.Anderson AW. Measurement of fiber orientation distributions using high angular resolution diffusion imaging. Magnetic Resonance in Medicine. 2005;54(5):1194–1206. doi: 10.1002/mrm.20667. [DOI] [PubMed] [Google Scholar]
- 58.Tournier JD, Calamante F, Gadian DG, Connelly A. Direct estimation of the fiber orientation density function from diffusion-weighted MRI data using spherical deconvolution. Neuroimage. 2004;23(3):1176–1185. doi: 10.1016/j.neuroimage.2004.07.037. [DOI] [PubMed] [Google Scholar]
- 59.Descoteaux M, Angelino E, Fitzgibbons S, Deriche R. Regularized, fast, and robust analytical Q-ball imaging. Magn Reson Med. 2007;58(3):497–510. doi: 10.1002/mrm.21277. [DOI] [PubMed] [Google Scholar]
- 60.Dell’Acqua F, Scifo P, Rizzo G, Catani M, Simmons A, Scotti G, et al. A modified damped Richardson–Lucy algorithm to reduce isotropic background effects in spherical deconvolution. NeuroImage. 2010;49(2):1446–1458. doi: 10.1016/j.neuroimage.2009.09.033. [DOI] [PubMed] [Google Scholar]
- 61.Jian B, Vemuri BC. A Unified Computational Framework for Deconvolution to Reconstruct Multiple Fibers From Diffusion Weighted MRI. IEEE Transactions on Medical Imaging. 2007;26(11):1464–1471. doi: 10.1109/TMI.2007.907552. [DOI] [PMC free article] [PubMed] [Google Scholar]
- 62.Descoteaux M, Deriche R, Knosche TR, Anwander A. Deterministic and Probabilistic Tractography Based on Complex Fibre Orientation Distributions. IEEE Transactions on Medical Imaging. 2009;28(2):269–286. doi: 10.1109/TMI.2008.2004424. [DOI] [PubMed] [Google Scholar]
- 63.Patel V, Shi Y, Thompson PM, Toga AW. Mesh-based spherical deconvolution: a flexible approach to reconstruction of non-negative fiber orientation distributions. Neuroimage. 2010;51(3):1071–1081. doi: 10.1016/j.neuroimage.2010.02.060. [DOI] [PMC free article] [PubMed] [Google Scholar]
- 64.Tournier JD, Calamante F, Connelly A. Robust determination of the fibre orientation distribution in diffusion MRI: Non-negativity constrained super-resolved spherical deconvolution. NeuroImage. 2007;35(4):1459–1472. doi: 10.1016/j.neuroimage.2007.02.016. [DOI] [PubMed] [Google Scholar]
- 65.Tran G, Shi Y. Adaptively constrained convex optimization for accurate fiber orientation estimation with high order spherical harmonics. Med Image Comput Comput Assist Interv. 2013;16(Pt 3):485–492. doi: 10.1007/978-3-642-40760-4_61. [DOI] [PMC free article] [PubMed] [Google Scholar]
- 66.Tran G, Shi Y. Fiber Orientation and Compartment Parameter Estimation from Multi-Shell Diffusion Imaging. IEEE Trans Med Imaging. 2015;34(11):2320–2332. doi: 10.1109/TMI.2015.2430850. [DOI] [PMC free article] [PubMed] [Google Scholar]
- 67.Cheng J, Deriche R, Jiang T, Shen D, Yap P-T. Non-Negative Spherical Deconvolution (NNSD) for estimation of fiber Orientation Distribution Function in single-/multi-shell diffusion MRI. NeuroImage. 2014;101:750–764. doi: 10.1016/j.neuroimage.2014.07.062. [DOI] [PMC free article] [PubMed] [Google Scholar]
- 68.Yeh F-C, Wedeen VJ, Tseng W-YI. Estimation of fiber orientation and spin density distribution by diffusion deconvolution. NeuroImage. 2011;55(3):1054–1062. doi: 10.1016/j.neuroimage.2010.11.087. [DOI] [PubMed] [Google Scholar]
- 69.Jbabdi S, Sotiropoulos SN, Savio AM, Grana M, Behrens TE. Model-based analysis of multishell diffusion MR data for tractography: how to get over fitting problems. Magn Reson Med. 2012;68(6):1846–1855. doi: 10.1002/mrm.24204. [DOI] [PMC free article] [PubMed] [Google Scholar]
- 70.Jeurissen B, Tournier J-D, Dhollander T, Connelly A, Sijbers J. Multi-tissue constrained spherical deconvolution for improved analysis of multi-shell diffusion MRI data. NeuroImage. 2014;103:411–426. doi: 10.1016/j.neuroimage.2014.07.061. [DOI] [PubMed] [Google Scholar]
- 71.Panagiotaki E, Schneider T, Siow B, Hall MG, Lythgoe MF, Alexander DC. Compartment models of the diffusion MR signal in brain white matter: A taxonomy and comparison. NeuroImage. 2012;59(3):2241–2254. doi: 10.1016/j.neuroimage.2011.09.081. [DOI] [PubMed] [Google Scholar]
- 72.Christiaens D, Reisert M, Dhollander T, Sunaert S, Suetens P, Maes F. Global tractography of multi-shell diffusion-weighted imaging data using a multi-tissue model. Neuroimage. 2015;123:89–101. doi: 10.1016/j.neuroimage.2015.08.008. [DOI] [PubMed] [Google Scholar]
- 73.Reisert M, Mader I, Anastasopoulos C, Weigel M, Schnell S, Kiselev V. Global fiber reconstruction becomes practical. Neuroimage. 2011;54(2):955–962. doi: 10.1016/j.neuroimage.2010.09.016. [DOI] [PubMed] [Google Scholar]
- 74.Mangin JF, Fillard P, Cointepas Y, Le Bihan D, Frouin V, Poupon C. Toward global tractography. Neuroimage. 2013;80:290–296. doi: 10.1016/j.neuroimage.2013.04.009. [DOI] [PubMed] [Google Scholar]
- 75.Tournier JD, Calamante F, Connelly A. MRtrix: Diffusion tractography in crossing fiber regions. Int J Imaging Syst Technol. 2012;22(1):53–66. [Google Scholar]
- 76.Mori S, Kaufmann WE, Davatzikos C, Stieltjes B, Amodei L, Fredericksen K, et al. Imaging cortical association tracts in the human brain using diffusion-tensor-based axonal tracking. Magn Reson Med. 2002;47(2):215–223. doi: 10.1002/mrm.10074. [DOI] [PubMed] [Google Scholar]
- 77.Catani M, Howard RJ, Pajevic S, Jones DK. Virtual in vivo interactive dissection of white matter fasciculi in the human brain. Neuroimage. 2002;17(1):77–94. doi: 10.1006/nimg.2002.1136. [DOI] [PubMed] [Google Scholar]
- 78.Wakana S, Jiang H, Nagae-Poetscher LM, van Zijl PC, Mori S. Fiber tract-based atlas of human white matter anatomy. Radiology. 2004;230(1):77–87. doi: 10.1148/radiol.2301021640. [DOI] [PubMed] [Google Scholar]
- 79.Fischl B, Sereno MI, Dale AM. Cortical surface-based analysis. II: Inflation, flattening, and a surface-based coordinate system. Neuroimage. 1999;9(2):195–207. doi: 10.1006/nimg.1998.0396. [DOI] [PubMed] [Google Scholar]
- 80.Patenaude B, Smith SM, Kennedy DN, Jenkinson M. A Bayesian model of shape and appearance for subcortical brain segmentation. NeuroImage. 2011;56(3):907–922. doi: 10.1016/j.neuroimage.2011.02.046. [DOI] [PMC free article] [PubMed] [Google Scholar]
- 81.Rohlfing T, Brandt R, Menzel R, Maurer CR. Evaluation of atlas selection strategies for atlas-based image segmentation with application to confocal microscopy images of bee brains. NeuroImage. 2004;21(4):1428–1442. doi: 10.1016/j.neuroimage.2003.11.010. [DOI] [PubMed] [Google Scholar]
- 82.Sabuncu MR, Yeo BTT, Van Leemput K, Fischl B, Golland P. A Generative Model for Image Segmentation Based on Label Fusion. IEEE Transactions on Medical Imaging. 2010;29(10):1714–1729. doi: 10.1109/TMI.2010.2050897. [DOI] [PMC free article] [PubMed] [Google Scholar]
- 83.Hongzhi W, Suh JW, Das SR, Pluta JB, Craige C, Yushkevich PA. Multi-Atlas Segmentation with Joint Label Fusion. IEEE Trans Pattern Anal Mach Intell. 2013;35(3):611–623. doi: 10.1109/TPAMI.2012.143. [DOI] [PMC free article] [PubMed] [Google Scholar]
- 84.Shi Y, Lai R, Wang DJ, Pelletier D, Mohr D, Sicotte N, et al. Metric optimization for surface analysis in the Laplace-Beltrami embedding space. IEEE Trans Med Imaging. 2014;33(7):1447–1463. doi: 10.1109/TMI.2014.2313812. [DOI] [PMC free article] [PubMed] [Google Scholar]
- 85.Avants BB, Epstein CL, Grossman M, Gee JC. Symmetric diffeomorphic image registration with cross-correlation: evaluating automated labeling of elderly and neurodegenerative brain. Med Image Anal. 2008;12(1):26–41. doi: 10.1016/j.media.2007.06.004. [DOI] [PMC free article] [PubMed] [Google Scholar]
- 86.Kammen A, Law M, Tjan BS, Toga AW, Shi Y. Automated retinofugal visual pathway reconstruction with multi-shell HARDI and FOD-based analysis. Neuroimage. 2016;125:767–779. doi: 10.1016/j.neuroimage.2015.11.005. [DOI] [PMC free article] [PubMed] [Google Scholar]
- 87.O’Donnell LJ, Westin CF. Automatic Tractography Segmentation Using a High-Dimensional White Matter Atlas. IEEE Transactions on Medical Imaging. 2007;26(11):1562–1575. doi: 10.1109/TMI.2007.906785. [DOI] [PubMed] [Google Scholar]
- 88.Jin Y, Shi Y, Zhan L, Gutman BA, de Zubicaray GI, McMahon KL, et al. Automatic clustering of white matter fibers in brain diffusion MRI with an application to genetics. Neuroimage. 2014;100:75–90. doi: 10.1016/j.neuroimage.2014.04.048. [DOI] [PMC free article] [PubMed] [Google Scholar]
- 89.Calamante F, Tournier J-D, Jackson GD, Connelly A. Track-density imaging (TDI): Super-resolution white matter imaging using whole-brain track-density mapping. NeuroImage. 2010;53(4):1233–1243. doi: 10.1016/j.neuroimage.2010.07.024. [DOI] [PubMed] [Google Scholar]
- 90.Aydogan D, Shi Y. Track Filtering via Iterative Correction of TDI Topology. In: Navab N, Hornegger J, Wells W, Frangi A, editors. Medical Image Computing and Computer-Assisted Intervention – MICCAI 2015. Vol. 9349. Springer International Publishing; 2015. pp. 20–27. [DOI] [PMC free article] [PubMed] [Google Scholar]
- 91.Hagmann P, Kurant M, Gigandet X, Thiran P, Wedeen VJ, Meuli R, et al. Mapping human whole-brain structural networks with diffusion MRI. PLoS One. 2007;2(7):e597. doi: 10.1371/journal.pone.0000597. [DOI] [PMC free article] [PubMed] [Google Scholar]
- 92.Sporns O. Small-world connectivity, motif composition, and complexity of fractal neuronal connections. Biosystems. 2006;85(1):55–64. doi: 10.1016/j.biosystems.2006.02.008. [DOI] [PubMed] [Google Scholar]
- 93.Sporns O. The human connectome: a complex network. Ann N Y Acad Sci. 2011;1224:109–125. doi: 10.1111/j.1749-6632.2010.05888.x. [DOI] [PubMed] [Google Scholar]
- 94.Shattuck DW, Mirza M, Adisetiyo V, Hojatkashani C, Salamon G, Narr KL, et al. Construction of a 3D probabilistic atlas of human cortical structures. NeuroImage. 2008;39(3):1064–1080. doi: 10.1016/j.neuroimage.2007.09.031. [DOI] [PMC free article] [PubMed] [Google Scholar]
- 95.Glasser MF, Coalson TS, Robinson EC, Hacker CD, Harwell J, Yacoub E, et al. A multi-modal parcellation of human cerebral cortex. Nature. 2016;536(7615):171–178. doi: 10.1038/nature18933. [DOI] [PMC free article] [PubMed] [Google Scholar]
- 96.Rubinov M, Sporns O. Complex network measures of brain connectivity: uses and interpretations. Neuroimage. 2010;52(3):1059–1069. doi: 10.1016/j.neuroimage.2009.10.003. [DOI] [PubMed] [Google Scholar]
- 97.van den Heuvel MP, Sporns O. Rich-club organization of the human connectome. J Neurosci. 2011;31(44):15775–15786. doi: 10.1523/JNEUROSCI.3539-11.2011. [DOI] [PMC free article] [PubMed] [Google Scholar]
- 98.Kammen A, Law M, Tjan BS, Toga A, Shi Y. Automated retinofugal visual pathway reconstruction with multi-shell HARDI and FOD-based analysis. 2015 doi: 10.1016/j.neuroimage.2015.11.005. Submitted. [DOI] [PMC free article] [PubMed] [Google Scholar]
- 99.Yogarajah M, Focke NK, Bonelli S, Cercignani M, Acheson J, Parker GJM, et al. Defining Meyer’s loop-temporal lobe resections, visual field deficits and diffusion tensor tractography. Brain. 2009;132(6):1656–1668. doi: 10.1093/brain/awp114. [DOI] [PMC free article] [PubMed] [Google Scholar]
- 100.Ebeling U, Reulen HJ. Neurosurgical topography of the optic radiation in the temporal lobe. Acta neurochir. 1988;92(1–4):29–36. doi: 10.1007/BF01401969. [DOI] [PubMed] [Google Scholar]
- 101.Sherbondy AJ, Dougherty RF, Napel S, Wandell BA. Identifying the human optic radiation using diffusion imaging and fiber tractography. Journal of Vision. 2008;8(10):12–12. doi: 10.1167/8.10.12. [DOI] [PMC free article] [PubMed] [Google Scholar]
- 102.Dreessen de Gervai P, Sboto-Frankenstein UN, Bolster RB, Thind S, Gruwel MLH, Smith SD, et al. Tractography of Meyer’s Loop asymmetries. Epilepsy Research. 2014;108(5):872–882. doi: 10.1016/j.eplepsyres.2014.03.006. [DOI] [PubMed] [Google Scholar]
- 103.Nieuwenhuys R, Voogd J, Huijzen Cv. The human central nervous system. 4. Springer; New York: 2008. p. xiv.p. 967. [Google Scholar]
- 104.Paxinos G, Huang X, Sengul G, Watson C. The Human Nervous System. 3. Elsevier Academic Press; 2012. Organization of brainstem nuclei; pp. 260–327. [Google Scholar]
- 105.Trillo L, Das D, Hsieh W, Medina B, Moghadam S, Lin B, et al. Ascending monoaminergic systems alterations in Alzheimer’s disease. Translating basic science into clinical care. Neuroscience & Biobehavioral Reviews. 2013;37(8):1363–1379. doi: 10.1016/j.neubiorev.2013.05.008. [DOI] [PubMed] [Google Scholar]
- 106.Meola A, Yeh FC, Fellows-Mayle W, Weed J, Fernandez-Miranda JC. Human Connectome-Based Tractographic Atlas of the Brainstem Connections and Surgical Approaches. Neurosurgery. 2016;79(3):437–455. doi: 10.1227/NEU.0000000000001224. [DOI] [PubMed] [Google Scholar]
- 107.van Baarsen KM, Kleinnijenhuis M, Jbabdi S, Sotiropoulos SN, Grotenhuis JA, van Cappellen van Walsum AM. A probabilistic atlas of the cerebellar white matter. Neuroimage. 2016;124(Pt A):724–732. doi: 10.1016/j.neuroimage.2015.09.014. [DOI] [PubMed] [Google Scholar]
- 108.Edlow BL, McNab JA, Witzel T, Kinney HC. The Structural Connectome of the Human Central Homeostatic Network. Brain Connect. 2015 doi: 10.1089/brain.2015.0378. [DOI] [PMC free article] [PubMed] [Google Scholar]
- 109.Glasser MF, Rilling JK. DTI tractography of the human brain’s language pathways. Cereb Cortex. 2008;18(11):2471–2482. doi: 10.1093/cercor/bhn011. [DOI] [PubMed] [Google Scholar]
- 110.Catani M, Jones DK, ffytche DH. Perisylvian language networks of the human brain. Ann Neurol. 2005;57(1):8–16. doi: 10.1002/ana.20319. [DOI] [PubMed] [Google Scholar]
- 111.Yagmurlu K, Middlebrooks EH, Tanriover N, ALR Fiber tracts of the dorsal language stream in the human brain. Journal of Neurosurgery. 2016;124(5):1396–1405. doi: 10.3171/2015.5.JNS15455. [DOI] [PubMed] [Google Scholar]
- 112.Aydogan DB, Shi Y. Probabilistic Tractography for Topographically Organized Connectomes. Medical Image Computing and Computer-Assisted Intervention – MICCAI 2016: 19th International Conference; Athens, Greece. October 17–21, 2016; 2016. pp. 201–209. Proceedings, Part I. [DOI] [PMC free article] [PubMed] [Google Scholar]
- 113.Vu AT, Auerbach E, Lenglet C, Moeller S, Sotiropoulos SN, Jbabdi S, et al. High resolution whole brain diffusion imaging at 7 T for the Human Connectome Project. NeuroImage. 2015;122:318–331. doi: 10.1016/j.neuroimage.2015.08.004. [DOI] [PMC free article] [PubMed] [Google Scholar]
- 114.Stanisz GJ, Wright GA, Henkelman RM, Szafer A. An analytical model of restricted diffusion in bovine optic nerve. Magnetic Resonance in Medicine. 1997;37(1):103–111. doi: 10.1002/mrm.1910370115. [DOI] [PubMed] [Google Scholar]
- 115.Assaf Y, Blumenfeld-Katzir T, Yovel Y, Basser PJ. Axcaliber: A method for measuring axon diameter distribution from diffusion MRI. Magnetic Resonance in Medicine. 2008;59(6):1347–1354. doi: 10.1002/mrm.21577. [DOI] [PMC free article] [PubMed] [Google Scholar]
- 116.Alexander DC, Hubbard PL, Hall MG, Moore EA, Ptito M, Parker GJM, et al. Orientationally invariant indices of axon diameter and density from diffusion MRI. NeuroImage. 2010;52(4):1374–1389. doi: 10.1016/j.neuroimage.2010.05.043. [DOI] [PubMed] [Google Scholar]
- 117.Zhang H, Schneider T, Wheeler-Kingshott CA, Alexander DC. NODDI: Practical in vivo neurite orientation dispersion and density imaging of the human brain. NeuroImage. 2012;61(4):1000–1016. doi: 10.1016/j.neuroimage.2012.03.072. [DOI] [PubMed] [Google Scholar]
- 118.Engel SA, Glover GH, Wandell BA. Retinotopic organization in human visual cortex and the spatial precision of functional MRI. Cereb Cortex. 1997;7(2):181–192. doi: 10.1093/cercor/7.2.181. [DOI] [PubMed] [Google Scholar]
- 119.Ruben J, Schwiemann J, Deuchert M, Meyer R, Krause T, Curio G, et al. Somatotopic organization of human secondary somatosensory cortex. Cereb Cortex. 2001;11(5):463–473. doi: 10.1093/cercor/11.5.463. [DOI] [PubMed] [Google Scholar]
- 120.Schmahmann JD, Pandya DN, Wang R, Dai G, D’Arceuil HE, de Crespigny AJ, et al. Association fibre pathways of the brain: parallel observations from diffusion spectrum imaging and autoradiography. Brain. 2007;130(Pt 3):630–653. doi: 10.1093/brain/awl359. [DOI] [PubMed] [Google Scholar]
- 121.Jbabdi S, Lehman JF, Haber SN, Behrens TE. Human and monkey ventral prefrontal fibers use the same organizational principles to reach their targets: tracing versus tractography. J Neurosci. 2013;33(7):3190–3201. doi: 10.1523/JNEUROSCI.2457-12.2013. [DOI] [PMC free article] [PubMed] [Google Scholar]
- 122.Donahue CJ, Sotiropoulos SN, Jbabdi S, Hernandez-Fernandez M, Behrens TE, Dyrby TB, et al. Using Diffusion Tractography to Predict Cortical Connection Strength and Distance: A Quantitative Comparison with Tracers in the Monkey. J Neurosci. 2016;36(25):6758–6770. doi: 10.1523/JNEUROSCI.0493-16.2016. [DOI] [PMC free article] [PubMed] [Google Scholar]
- 123.Oh SW, Harris JA, Ng L, Winslow B, Cain N, Mihalas S, et al. A mesoscale connectome of the mouse brain. Nature. 2014;508(7495):207–214. doi: 10.1038/nature13186. [DOI] [PMC free article] [PubMed] [Google Scholar]
- 124.Calabrese E, Badea A, Cofer G, Qi Y, Johnson GA. A Diffusion MRI Tractography Connectome of the Mouse Brain and Comparison with Neuronal Tracer Data. Cerebral Cortex. 2015 doi: 10.1093/cercor/bhv121. [DOI] [PMC free article] [PubMed] [Google Scholar]
- 125.Chen H, Liu T, Zhao Y, Zhang T, Li Y, Li M, et al. Optimization of large-scale mouse brain connectome via joint evaluation of DTI and neuron tracing data. NeuroImage. 2015;115:202–213. doi: 10.1016/j.neuroimage.2015.04.050. [DOI] [PMC free article] [PubMed] [Google Scholar]
- 126.Wang Y, Wang Q, Haldar JP, Yeh FC, Xie M, Sun P, et al. Quantification of increased cellularity during inflammatory demyelination. Brain. 2011;134(Pt 12):3590–3601. doi: 10.1093/brain/awr307. [DOI] [PMC free article] [PubMed] [Google Scholar]
- 127.Zhu D, Zhang T, Jiang X, Hu X, Chen H, Yang N, et al. Fusing DTI and fMRI data: A survey of methods and applications. NeuroImage. 2014;102(Part 1):184–191. doi: 10.1016/j.neuroimage.2013.09.071. [DOI] [PMC free article] [PubMed] [Google Scholar]
- 128.Calhoun Vince D, Miller R, Pearlson G, Adalı T. The Chronnectome: Time-Varying Connectivity Networks as the Next Frontier in fMRI Data Discovery. Neuron. 2014;84(2):262–274. doi: 10.1016/j.neuron.2014.10.015. [DOI] [PMC free article] [PubMed] [Google Scholar]
- 129.Hindriks R, Adhikari MH, Murayama Y, Ganzetti M, Mantini D, Logothetis NK, et al. Can sliding-window correlations reveal dynamic functional connectivity in resting-state fMRI? NeuroImage. 2016;127:242–256. doi: 10.1016/j.neuroimage.2015.11.055. [DOI] [PMC free article] [PubMed] [Google Scholar]
- 130.MacKay A, Laule C, Vavasour I, Bjarnason T, Kolind S, Mädler B. Insights into brain microstructure from the T2 distribution. Magnetic Resonance Imaging. 2006;24(4):515–525. doi: 10.1016/j.mri.2005.12.037. [DOI] [PubMed] [Google Scholar]
- 131.Deoni SC, Mercure E, Blasi A, Gasston D, Thomson A, Johnson M, et al. Mapping infant brain myelination with magnetic resonance imaging. J Neurosci. 2011;31(2):784–791. doi: 10.1523/JNEUROSCI.2106-10.2011. [DOI] [PMC free article] [PubMed] [Google Scholar]
- 132.Behrens TE, Johansen-Berg H, Woolrich MW, Smith SM, Wheeler-Kingshott CA, Boulby PA, et al. Non-invasive mapping of connections between human thalamus and cortex using diffusion imaging. Nat Neurosci. 2003;6(7):750–757. doi: 10.1038/nn1075. [DOI] [PubMed] [Google Scholar]
- 133.Mars RB, Jbabdi S, Sallet J, O’Reilly JX, Croxson PL, Olivier E, et al. Diffusion-Weighted Imaging Tractography-Based Parcellation of the Human Parietal Cortex and Comparison with Human and Macaque Resting-State Functional Connectivity. Journal of Neuroscience. 2011;31(11):4087–4100. doi: 10.1523/JNEUROSCI.5102-10.2011. [DOI] [PMC free article] [PubMed] [Google Scholar]
- 134.LeCun Y, Bengio Y, Hinton G. Deep learning. Nature. 2015;521(7553):436–444. doi: 10.1038/nature14539. [DOI] [PubMed] [Google Scholar]