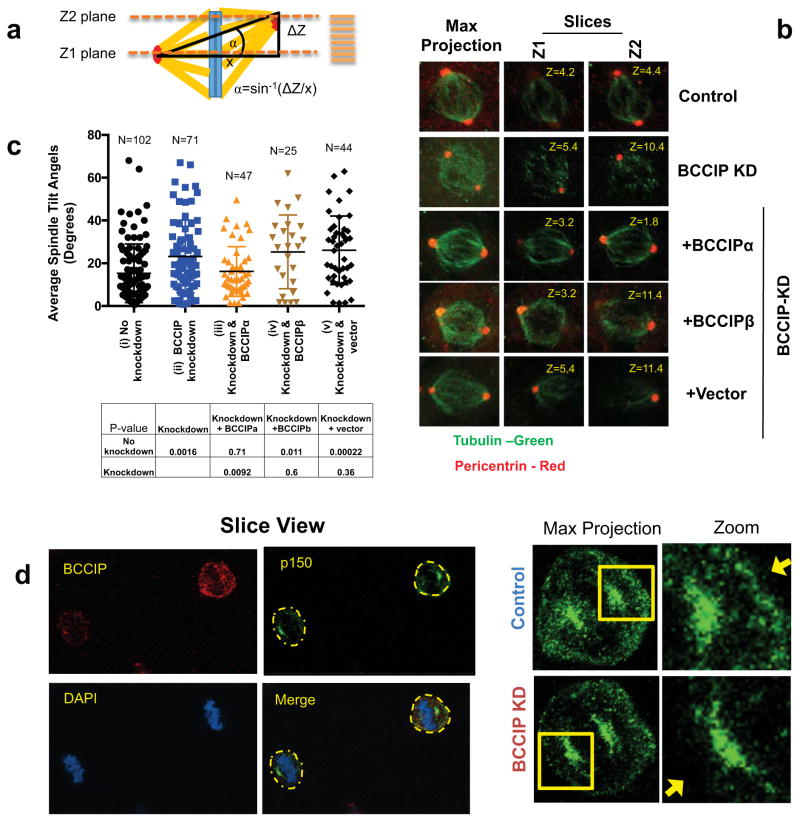
Figure 7. BCCIP loss induces spindle orientation defects.
A: Measurement of spindle angles. Image stacks of mitotic HeLa cells grown parallel to the culture surface were obtained by confocal imaging. The Z-planes containing maximal spindle pole intensities were recorded as Z1 and Z2 and the Z-distance between Z1 and Z2 was used to measure the depth (or the vertical distance) between the spindle poles (ΔZ shown in illustration). Maximal projections were utilized to determine the horizontal distance between the spindle poles (x-value as illustrated). Consequently, the spindle angles relative to the culture surface can be determined as α=Sin−1(ΔZ/x).
B: Representative images of spindle pole planes (Z1 & Z2). Spindle poles (pericentrin foci) reside in the same Z-planes in control cells but often reside two different confocal planes (Z1 or Z2) for BCCIP deficient cells, reflecting an increase in the spindle angle.
C: The distribution of spindle angles is increased by BCCIP depletion. The spindle angles from control (i), BCCIP knockdown (ii), and knockdown cells expressing RNAi resistant BCCIPα (iii) or BCCIPβ (iv) or control vector (v) were assessed. Plotted are the distributions of the spindle angles among indicated cells. The p-values of t-test between the two indicated pairs are shown in the table.
D: reduced levels of cortical dynactin in BCCIP deficient cells. Control and BCCIP deficient HeLa cells were co-seeded to coverslips, arrested in metaphase with MG-132, and co-stained with p150 glued (green) and BCCIP (red). Shown are the representative images of BCCIP normal (up right corner) and BCCIP knockdown (lower left corner) cells on the same staining field, and the zoomed images demonstrating the p150 staining at the spindle pole and the cortex. Yellow arrows indicate the presence (control) or lack (BCCIP-knockdown) of cortex p150 staining in the control and BCCIP deficient cells.

