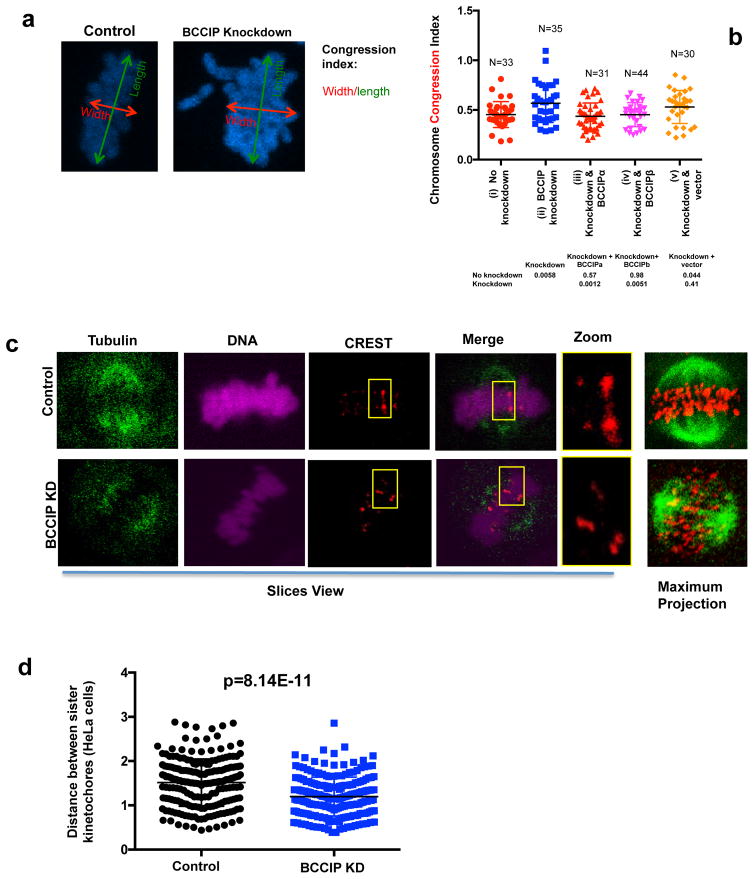
Figure 8. The forces required for chromosome movement are defective in BCCIP deficient cells.
A & B: Abnormal congression of metaphase chromosomes in BCCIP deficient cells. Metaphase chromosome width (parallel to the spindle poles) and length (perpendicular to the spindle poles) was obtained as illustrated. The ratio between the width and length was utilized to calculate the chromosome congression index (W/L) and plotted in (8B) for control (i), BCCIP knockdown (ii), and knockdown cells that express RNAi resistant BCCIPα (iii) or BCCIPβ (iv) or control vector (v). The p-values of t-test between selected cells are shown in the table bellow the graphic.
C & D: Reduced intra-kinetochore distance in BCCIP deficient cells. Cells were stained with CREST (red) and α-tubulin (Green). Unambiguous kinetochore CREST pairs were identified, and the distance between CREST foci (representing the distance between sister-chromatid kinetochores) was measured. (8C) shows the representative slice views of control and BCCIP knockdown HeLa cells, a pair of identified sister bivalents (boxed and zoomed), and the maximum projections depicting accumulation of α-tubulin and CREST stacks of the confocal slice views. (8D) illustrates the distance distribution based on measurement of more than 200 pairs. Results using U2OS cells can be found in Supplement S7.

