

Abstract
The way in which normal variations in human neuroanatomy relate to brain function remains largely uninvestigated. This study addresses the question by relating anatomical measurements of Heschl’s gyrus (HG), the structure containing human primary auditory cortex, to how this region processes temporal and spectral acoustic information. In this study, subjects’ right and left HG were identified and manually indicated on anatomical MRI scans. Volumes of gray matter, white matter and total gyrus were recorded, and asymmetry indices were calculated. Additionally, cortical auditory activity in response to noise stimuli varying orthogonally in temporal and spectral dimensions was assessed and related to the volumetric measurements. A high degree of anatomical variability was seen, consistent with other reports in the literature. The auditory cortical responses showed the expected leftward lateralization to varying rates of stimulus change and rightward lateralization of increasing spectral information. However, the present data are the first to explicitly link anatomical variability of auditory cortex to individual differences in the way that cortex processes acoustic information. Specifically, larger volumes of left HG were associated with larger extents of rate-related cortex on the left, and larger volumes of right HG related to larger extents of spectral-related cortex on the right. This finding is discussed in relation to known microanatomical asymmetries of HG, including increased myelination of its fibers, and implications for language learning are considered.
Keywords: Asymmetry, Acoustic rate, Individual variability, Auditory, Auditory cortex, fMRI, Lateralization, Morphometry, Structure, Spectral
Introduction
The question of how normal variation in brain anatomy relates to differences in brain function is fundamental in the field of neuroscience and intrigues neuroscientists, psychologists and philosophers alike. Human auditory cortex provides an excellent model system in which to investigate these relationships because there are established interhemispheric differences in both structure and function, but direct relationships have been elusive (but see Schneider et al., 2002 and 2005). This study examines the structure/function question in the context of basic building blocks of language (rapid acoustic changes) and music (complex frequency information). While both speech and music recruit neural systems distributed throughout the brain (Tervaniemi and Hugdahl, 2003; Hickok and Poeppel, 2007), the spectrotemporal trade-off model of acoustic processing states that functional lateralization of acoustic encoding contributes to the leftward-lateralizing elements of language and the rightward-lateralizing elements of music (Zatorre et al., 2002). This model is based on studies showing enhanced sensitivity to rapid acoustic changes in left auditory cortex (Liégeois-Chauvel et al., 1999; Zatorre and Belin, 2001; Schönwiesner et al., 2005; Jamison et al., 2006), and preferential processing of complex spectral information in right auditory cortex (Zatorre, 1988; Johnsrude et al., 2000; Liégeois-Chauvel et al., 2001; Patterson et al., 2002).
Structurally, a number of studies have shown leftward asymmetries in the volume of Heschl’s gyrus, the location of human primary auditory cortex (Morosan et al., 2001). This asymmetry is largely due to greater white matter volumes, likely related to a greater number of fibres and/or increased myelination (Penhune et al., 1996; Anderson et al., 1999; Chance et al., 2006). The spectrotemporal trade-off model proposes that microstructural properties may underlie observed hemispheric differences in auditory processing, in that greater myelination and connectivity in left auditory cortex may underlie that region’s specialization for handling fast temporal information. Conversely, denser, more interconnected columnar structure in right auditory cortex appears more conducive to evaluating fine frequency distinctions (Seldon, 1981, 1982; Anderson et al., 1999; Sigalovsky et al., 2006). However, a relationship between cortical structure and acoustic processing has never been directly established.
Here, we used structural and functional MRI to assess the relationship between the volume of auditory cortex and its functional response to spectrally and temporally varying auditory stimuli. We used a well-established protocol to label and measure HG volumes from structural MRI scans and adapted a well-controlled stimulus set consisting of amplitude-modulated noise bands varying orthogonally in their temporal modulation rate and number of spectral components to assess auditory cortical responses (Schönwiesner et al., 2005). We tested the hypotheses that variance in left HG asymmetry and/or volume across individuals would predict the response to increasing rate of temporal change, and variance in right HG asymmetry and/or volume would relate to the response to increasing spectral density.
Methods
Twelve normal right-handed adults with no history of neurological problems participated in this study (7 female, 5 male, average age 27). Handedness was verified with the Edinburgh Handedness Inventory (Oldfield, 1971). Normal and symmetric hearing was verified through an audiologic exam. After preprocessing the functional data, it was noted that one subject’s data had severe motion artifact, and another dataset had an unacceptably low signal to noise ratio, leaving ten useable datasets. All scanning was performed on a 3T Siemens Trio scanner fitted with an 8-channel headcoil.
Anatomy
Acquisition
Anatomical scans were collected as T1 weighted whole-brain 3D volumes (MPRAGE) with a TR/TE of 2100ms/2.4ms, flip angle of 15°, and a TI of 1100 ms. Matrix size was 256×256, FOV 22 cm, slice thickness 1 mm, with a resolution of 0.86 × 0.86 × 1.0 mm. Sequence parameters were optimized for the 3T Trio system.
Preprocessing
The Brain Imaging Software Toolbox (BIST) was used for all processing of the anatomical data (McConnell Brain Imaging Center at the Montreal Neurological Institute). T1 volumes were preprocessed to maintain any morphological distinctions between participants and across hemispheres within individual brains. They were normalized to a right/left symmetric template of standard stereotaxic space using only linear transformations in order to avoid warping of pertinent brain structures (Collins et al., 1994). All volumes were then corrected for intensity non-uniformities (Sled et al., 1998). The T1 volumes were randomly flipped in the left/right dimension before labeling by someone not involved in brain labeling so that labelers were blind to hemisphere and could not be biased by this knowledge.
Analysis
Right and left HG were identified and manually indicated on each subject’s T1 volume as described in our previous work (Penhune et al., 1996; Penhune et al., 2003; Wong et al., 2008). This system of landmarks and guidelines used for delineating HG on MRI scans was developed to give the best estimate of the location of primary auditory cortex from gross morphological features (Penhune et al., 1996). This definition was based on a post-mortem study in which the location of primary auditory cortex was determined cytoarchitectonically and related to the gross morphology of the temporal lobe (Rademacher et al., 1993). The results of that study have been confirmed by a subsequent post-mortem investigation that integrated cytoarchitectonic data and gross morphology in standardized stereotactic space (Morosan et al., 2001). Most importantly, the location of primary auditory cortex identified from gross anatomical landmarks in the Penhune study overlapped almost entirely with the average location of primary auditory cortex as identified by cytoarchitecture in the Morosan study (Hall et al., 2002). Briefly, this definition includes the gyral region bounded anteriorly by the first transverse sulcus, and posteriorly by Heschl’s sulcus. In the cases when a sulcus intermedius was present, if that sulcus extended at least half the length of the gyrus, it was considered a gyral duplication. In this case, the sulcus intermedius was extended in a straight line to the gyral base, and the gyrus anterior to the sulcus intermedius was taken as HG. If the sulcus intermedius extended less than half the length of the gyrus, it was not considered a gyral duplication, and Heschl’s sulcus formed the posterior boundary. For common-stem duplications (one instance in this dataset) we painted two labels. In one label, we extended Heschl’s sulcus in a straight line to the base of the stem and painted HG anterior to that line. For the second label, we included all of the first label plus the entire stem common to both gyri by extending a line perpendicular to Heschl’s sulcus across the posterior gyrus and painting medially from that line to the base of the stem. We ran all statistics with gyral volumes from both of these labels, and the results did not differ. Values from the second label are shown. The software Display allowed for simultaneous viewing of all three planes of section, a crucial advantage to performing these measurements accurately (Rademacher et al., 1993; MacDonald et al., 1994). This manual identification method allows us to capture individual variations in HG anatomy more fully than automatic methods permit. Labeled structures were automatically segmented into gray and white matter volumes (Collins et al., 1995). Gray and white matter and total gyral volumes were recorded, and asymmetry indices were calculated using the standard formula: Asymmetry index (AI) = (L_volume − R_volume)/(L_volume + R_volume). Therefore, positive values indicate larger left volume. To illustrate this technique, Figure 1 shows left and right HG manually outlined on a representative T1 volume.
Figure 1.
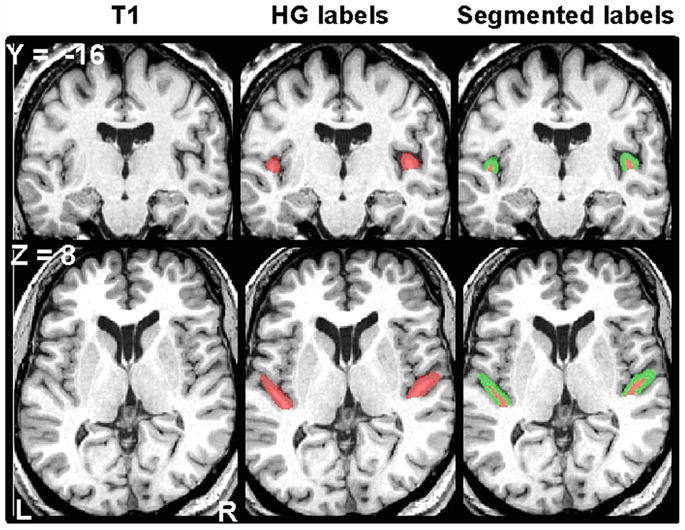
A representative T1 volume is shown in coronal (top, y = −16) and axial (bottom, z = 8) sections. Left column shows original unmarked scan. Middle column shows location of manual HG labels in red. Right column shows those same HG labels segmented into gray and white matter, shown in green and red respectively.
Function
Acquisition
Functional T2* images were obtained using Echo Planar Imaging, with each scan collecting 20 3 mm thick slice images oriented parallel to the Sylvian Fissure, covering the temporal lobes and surrounding area with a resolution of 3.44 × 3.44 × 3 mm (TE = 30 ms, FA = 90°, matrix size = 64 × 64, FOV 220 with 100% phase, TA 1.2 seconds, EPI factor = 64). A sparse sampling technique with clustered image acquisition was employed to ensure that any BOLD response related to loud scanning noises had diminished before the next scan took place (Belin et al., 1999; Hall et al., 1999; Wong et al., 2007). A TR of 8 seconds was used, with a delay of 6.8 seconds. Therefore, each trial’s 1.2 seconds of scanning began 0.2 seconds before the end of the stimulus. Because the BOLD response corresponds to neural activity occurring seconds before the scan, this overlap did not affect the results. Scanner and stimulus presentation computers synchronized each trial via a trigger. All subjects wore custom headphones made out of ear defenders modified to allow auditory stimuli in through a hollow tube while decreasing the amount of scanner noise reaching the listener’s ears by 30 dB. An acoustic blanket constructed of loaded vinyl and fiberglass matting (Singer Safety Company, Chicago, IL) was also placed firmly along the inside wall of the scanner’s bore, further attenuating the scanner noise without any alteration of the MR signal. During a recent scanner upgrade, noise-reducing foam was inserted into the magnet case itself, substantially reducing the amount of noise output by the scanner during data acquisition.
Stimuli
Stimuli based on M Schönwiesner’s Random Spectrogram Stimuli (Schönwiesner et al., 2005) were created in Matlab (The Mathworks, Natick, Massachusetts) by orthogonally manipulating temporal and spectral parameters of a 7-second noise stimulus spanning 200–6000 Hz. This stimulus paradigm was carefully chosen for its ability to orthogonally vary temporal and spectral stimulus characteristics during a single fMRI trial. Stimuli were created by constructing a two-dimensional (time and frequency) random field spectrogram and converting it into sound. To create this spectrogram, the time window is divided into a specified number of bins of equal duration. Similarly, the frequency axis is divided into a specified number of bins of equal size based on the equivalent rectangular bandwidth (Moore and Glasberg, 1983). A random field is applied to the resulting time/frequency grid, with one number per spectrotemporal bin indicating intensity level. 980 sine waves are then fit to cover the spectrogram, with the level of each wave following the contour of the random field (See Figure 2 for a schematic). By combining temporal and spectral bins into a single stimulus, the spectrogram appears as a checkerboard pattern, with blocks of various intensities. All stimuli have 5 ms on and off ramps, and are ramped 10 ms between intensity changes.
Figure 2.

Schematic of stimulus composition (adapted with permission from M Schönwiesner, 2005). Stimuli of 1-second duration are depicted with time on the x-axis and spectrum on the y-axis. Actual stimuli were 7 seconds. Shades of gray denote signal intensity. A) Depiction of a Base stimulus (far left) and its three orthogonal manipulations. Note that the three upper stimuli maintain three temporal bins but increase the number of spectral components. Similarly, the lower three stimuli maintain three frequency bins but increase the number of temporal bins. B) A sound with a spectrogram equal to the random field is constructed by modulating the amplitude of the sine tone components (six tones in this example, actual stimuli used 980 tones) with the random field values. The sine tones are then added to create the time-domain stimulus that is then converted to sound.
A Base stimulus served as an anchor for both acoustic manipulations, with three large frequency bins of approximately 1 1/2 octaves that change intensity at a rate of 3 Hz. The temporal manipulations produced three additional stimuli, each with increasing rates of change (5 Hz: Rate1, 10 Hz: Rate2, 33 Hz: Rate3), maintaining the frequency information in the Base stimulus. The spectral manipulations also produced three additional stimuli, each with decreasing sizes of frequency bins (6 bins of approx 981 cents each: Spect1, 30 bins of approx 196 cents each: Spect2, and 294 bins of approx 20 cents each: Spect3), maintaining the temporal information in the Base stimulus. A silent condition was included in which no stimulus was presented. Thirty tokens of each stimulus were created so that no exact stimulus was heard more than once. Level v2.0 software was used to normalize all stimuli to equal dB RMS (Bob Tice and Tom Carrell at University of Nebraska). Stimuli were presented binaurally through headphones at 90dB SPL at a sampling rate of 22050 Hz. Thirty trials of each of the eight conditions were presented in a pseudo-random order (same order for each subject, 240 total trials). Presentation order was calculated by OptSeq such that the same condition was not presented more than three times in a row (one occurrence) and each condition’s stimulus trials are spread across the testing session. Subjects were requested to press a button each time they heard a stimulus in order to maintain alertness.
Preprocessing
SPM2 software was used for all preprocessing and analyses of fMRI data (Wellcome Department of Imaging Neuroscience, University College, London). Typical preprocessing steps were followed (motion correction, coregistration to T1, resampling into standardized space using the Montreal Neurological Institute (MNI) EPI template, smoothed to FWHM = 6mm). Additionally, for each functional volume, signal to noise ratio (SNR) was computed for each voxel (Parrish et al., 2000).
The spectral density of the Spect3 condition (200–6000Hz divided into 294 bins) was intended to challenge the spectral processing capabilities of the auditory system. However, the spectral bins of this condition appear to have been too dense to be processed discretely. The highest spectral condition used in the Schoenwiesner study on which the stimuli were modeled divided 200Hz to 16kHz into 16 bins. Within our Spect3 condition, the spectral density ranged from approximately 17 to 25 bins per critical band (Zwicker, 1961). For comparison, the spectral density of the Spect2 condition ranged from approximately 1.5 to 2.5 critical bands per spectral bin, and those of the Spect1 and Base conditions spanned critical bands, from approximately 2.5 to 6.5 critical bands per spectral bin. Additionally, the Spect3 stimulus was processed in a manner distinct from the responses to the other experimental conditions. It evoked a response considerably weaker than the Base condition, yet stronger than silence in all subjects. This response pattern is consistent with what one would expect from a noise stimulus containing a single spectral bin spanning the entire frequency range, e.g. white noise, and can be seen online in Supplementary Figure 1. For these reasons, the Spect3 condition was not included in the analyses reported below.
Analysis
Covariation analyses identified voxels that increased activity with increasing rate of stimulus change or increasing spectral complexity. The BOLD response for each subject covarying with acoustic rate or spectral information was assessed using parameter number as a covariate: (1=Base, 2=Rate1, 3=Rate2, 4=Rate3) or (1=Base, 2=Spect1, 3=Spect2). The resulting t-statistic maps identify voxels in which the slope of the regression is significantly different from zero, meaning that those regions covary with rate of stimulus change or spectral complexity. A second level analysis was performed on the individual covariation results to observe the effects at the group level.
In an ROI analysis, individual activity levels were extracted for each condition within an ROI determined by the manually marked HG labels described above (right and left), providing a description of activity originating in auditory cortex including primary regions. For this analysis, an FIR-based model including all conditions was created in SPM to determine the amount of BOLD activity associated with each condition for each subject. Marsbar software extracted ROI activity levels from this model (Brett et al., 2002).
Results
Anatomy
The literature on the anatomy of Heschl’s Gyrus indicates a highly variable morphology (Leonard et al., 1998; Morosan et al., 2001), and our dataset bore this out. Of the twenty gyri assessed in this study, nine gyral duplications were noted, with nearly equal incidence on right and left (five on left), a proportion of duplicate gyri consistent with previous reports (summarized in Penhune et al., 1994). All duplications on the right and one on the left were complete, indicated by a sulcus intermedius extending the length of the gyrus. Of the remaining left duplications, two were formed by a sulcus intermedius extending from the gyral base, leaving the lateral gyral ends fused, one had a sulcus intermedius that did not quite extend fully either medially or laterally, and one was formed by a sulcus intermedius that started at the lateral end of the gyri but did not extend to the gyral base, leaving the anterior and posterior gyri with a common stem. One rater labeled all gyri and a second rater labeled 70% of them as a reliability check. Inter-rater reliability, calculated by correlating total HG volume across raters, was high (Pearson’s r = 0.937). In order to directly compare our measurements to those published previously, we calculated normative ranges of volumes and asymmetry indices from a composite of all Penhune et al.’s published normal data (1996, exps 1 and 2: n=40; 2003, hearing subjects only: n=10). No differences were found between our data and the Penhune data for left HG volume, right HG volume or asymmetry index (independent sample t-tests, p > 0.1 all comparisons), indicating our measurements are consistent with previously published reports. We found the typical HG asymmetry distribution with leftward asymmetry more common (Penhune et al., 1996; Chance et al., 2006). Of our 10 subjects, 5 were leftward asymmetric (AI > 0.1), 3 were rightward asymmetric (AI < −0.1), and 2 were symmetric (0.1 > AI > −0.1) (See Table 1). Asymmetry of gray and white matter, which always went in the same direction within subjects, were strongly correlated (r = 0.922, p < 0.001), though strength of asymmetry (absolute value of AI) was stronger for white than gray matter (paired t = 4.217, p < 0.005).
Table 1.
Volumetric measurements in mm3 of left (L) and right (R) white, gray and total Heschl’s gyrus, and the asymmetry index (AI) of total HG volume. Data are ordered by strength of total HG volume AI.
| Subject | L White | L Gray | R White | R Gray | L Total | R Total | AI |
|---|---|---|---|---|---|---|---|
| 1 | 596 | 2173 | 169 | 997 | 2769 | 1166 | 0.41 |
| 2 | 896 | 3154 | 419 | 1731 | 4050 | 2150 | 0.31 |
| 3 | 362 | 1211 | 109 | 850 | 1573 | 959 | 0.24 |
| 4 | 819 | 2071 | 328 | 1584 | 2890 | 1912 | 0.20 |
| 5 | 244 | 1212 | 121 | 855 | 1456 | 976 | 0.20 |
| 6 | 550 | 1696 | 513 | 1671 | 2246 | 2184 | 0.01 |
| 7 | 598 | 2316 | 717 | 2374 | 2914 | 3091 | −0.03 |
| 8 | 299 | 974 | 499 | 1094 | 1273 | 1593 | −0.11 |
| 9 | 288 | 1201 | 499 | 1804 | 1489 | 2303 | −0.21 |
| 10 | 213 | 1106 | 373 | 1748 | 1319 | 2121 | −0.23 |
Function
Covariation analyses
Both temporal and spectral covariation analyses revealed bilateral regions along the length of HG and onto planum temporale, including core and belt regions, showing increased BOLD activity in response to increasing rate of stimulus change and spectral complexity respectively. The cortical areas covarying with rate of stimulus change overlapped areas seen in similar studies addressing functional lateralization of temporal auditory processing (Zatorre and Belin, 2001; Schönwiesner et al., 2005; Jamison et al., 2006) and included core and belt regions centered on HG (Sweet et al., 2005). In the temporal analysis, a larger region of significance was seen on the left, located more posteriorly than that on the right (7965 mm3 on left vs. 5184 mm3 on right, See Figure 3A, Table 2). The region covarying with temporal information extended more posteriorly and surrounded HG slightly more than the region covarying with spectral information on the left. On the right, the temporally covarying region extended more anterolaterally along the STG, and posterolaterally onto the middle temporal gyrus than the spectral covariations. The spectral analysis revealed larger regions of significance than the temporal analysis bilaterally, with a larger region of significance on the right than on the left (16767 mm3 on right vs. 16119 mm3 on left; See Figure 3B and Table 2). The spectral region of covariation extended substantially more anteriorly and posteriorly along the STG, and covered more planum temporale bilaterally than the temporal region of covariation.
Figure 3.

Cortical regions with BOLD activity significantly covarying with temporal (A) and spectral (B) information. Results from individual subjects are overlaid on their own structural scans. Transverse slices tilted at a 35° angle allow visualization of results along the superior temporal plane. Data are ordered by asymmetry index descending in a clockwise direction; subject with highest leftward HG asymmetry is shown in top left corner. Therefore, the top row shows the leftward asymmetric group, the bottom row shows the non-leftward asymmetric group. Group average covariation maps are shown to the right of individual data. Color bars indicate significance (t). Activation values from HG ROIs are plotted in arbitrary units for temporal (C) and spectral (D) conditions. Error bars indicate standard error (C,D).
Table 2.
Significance peaks and values: x,y,z coordinates in MNI space, peak t and Z values, FDR-corrected p values, and extent of hemispheric cluster size in mm3.
| Temporal Covariation | Spectral Covariation | ||||||||||||
|---|---|---|---|---|---|---|---|---|---|---|---|---|---|
| (x | y | z) | t | Z | FDR-corr p | cluster size | (x | y | z) | t | Z | FDR-corr p | cluster size |
| −39 | −30 | 15 | 13.64 | 5.15 | 0.007 | 7965 | 60 | −18 | 6 | 18.01 | 5.59 | 0.001 | 16767 |
| −39 | −30 | 3 | 8.97 | 4.44 | 0.033 | .. | 57 | −36 | 15 | 12.34 | 4.99 | 0.002 | .. |
| −60 | −15 | 6 | 6.16 | 3.77 | 0.047 | .. | 63 | −9 | 3 | 11.53 | 4.89 | 0.002 | .. |
| 60 | −12 | 9 | 8.05 | 4.25 | 0.033 | 5184 | −42 | −30 | 12 | 12.12 | 4.96 | 0.002 | 16119 |
| 63 | −3 | 6 | 7.50 | 4.13 | 0.033 | .. | −60 | −27 | 12 | 11.44 | 4.86 | 0.002 | .. |
| 48 | −12 | 6 | 7.25 | 4.06 | 0.036 | .. | −54 | −21 | 6 | 10.89 | 4.78 | 0.002 | .. |
We overlaid our covariation significance maps with Morosan’s probability maps of three HG subdivisions thresholded at 50% probability. These subdivisions divide HG into three cytoarchitectonically distinct regions in the posteromedial to anterolateral direction. The center region, Te1.0 is thought to correspond with the auditory koniocortical core field, with Te1.1 positioned posteromedially, and Te1.2 anterolaterally. In the temporal covariation analysis, significant regions on the left included most of Te1.0 and all of Te1.1. It did not extend to Te1.2 on the left. On the right, significant regions included portions of all three regions. In the spectral covariation analysis, significant regions on the left included all of areas Te1.0 and Te1.1, and a slight amount of Te1.2. On the right, significant regions included all of Te1.0, most of Te1.1, and a portion of Te1.2. Activity in core auditory regions is not always found to covary with acoustic parameters, but this result was seen in the Schönwiesner study with similar stimuli (Schönwiesner et al., 2005).
Temporal ROI analysis
Activation strength in response to each temporal condition was extracted from individual HG ROIs (See Figure 3C). A 2×4 ANOVA of side (Left vs Right) by rate (Base, Rate1, Rate2, Rate3) was performed. A main effect of Rate was found (F = 5.4, df = 3,27, p = 0.005), with no main effect of Side (F = 0.20, df = 1,9, p > 0.6). A significant Rate by Side interaction was found (F = 4.5, df = 3,27, p = 0.01). Planned comparison one-way paired t-tests between Left and Right activity within each temporal condition helped inform the interaction result. Significant differences between sides were found for the Base condition, with Right more active than Left (t = 2.38, df = 9, p < 0.05), and the Rate 3 condition, with Left more active than Right (t = 1.9, df = 9, p < 0.05). Left and Right responses did not differ in Rate1 and Rate2 conditions (p > 0.05 both comparisons). Posthoc Wilcoxon signed rank tests compared activity levels between conditions within sides. Setting the alpha at 0.01 to account for multiple comparisons, activity on the Left was significantly greater in the Rate3 condition than either Base or Rate1 (Z = 2.6, p < 0.01 both comparisons). No differences between conditions were detected on the Right (p > 0.01 all comparisons).
Spectral ROI analysis
Activation strength in response to each spectral condition was also extracted from individually marked HG ROIs and submitted to a 2×3 ANOVA of Side (Left vs. Right) by spectral condition (Base, Spec1, Spec2; See Figure 3D). A main effect of condition was found (F = 12.9, df = 2,18, p < 0.0005), with no main effect of Side (F = 2.4, df = 1,9, p > 0.1). No interaction was found (F = 1.4, df = 2,18, p > 0.2). To investigate the main effect of condition, posthoc Wilcoxon signed rank tests compared activity between conditions collapsed across sides. The Base condition had significantly lower activity levels than either Spec1 (Z = 2.8, p = 0.005) or Spec2 (Z = 2.7, p = 0.007). Planned comparison one-way paired t-tests between Left and Right activity were also performed. Aside from the Right/Left difference reported above for the Base condition, neither spectral condition significantly differed (p > 0.05 both comparisons).
Relating structure to function
The chief goal of this study was to relate structural HG measurements to degree of lateralization of HG activity in response to acoustically manipulated sounds. We wanted to test the prediction that normal variations in HG volumes would be related to normal variations in acoustic processing. Our analyses support this claim. ANATOMY: Subjects were divided into groups based on their pattern of anatomical HG asymmetry. The leftward asymmetric group (LHG>RHG) included five subjects with larger left than right HG, and the non-leftward asymmetric group (LHG≤RHG) included five subjects with either symmetric or rightward asymmetric HG. FUNCTION: Two ROI pairs in left and right auditory cortex were constructed, based on the regions showing significant covariation with the temporal and spectral manipulations described above (See Figure 3A and 3B). To control for differences in left and right HG volumes, we made each ROI pair symmetric by adding its right/left mirror image to itself, thus equating the size of search areas in the right and left hemispheres. Hence, the symmetric ROIs are maximally sensitive to all voxels that show a response to the stimulus, but are unbiased with respect to the question of interest, right vs. left degree of response. This method also avoids unnecessarily penalizing those with atypical HG patterns, e.g. right larger than left HG. The extent of activity significantly covarying with stimulus change within right and left ROIs was compared using two 2×2 Group by Side ANOVAs. These were followed by planned within-group Wilcoxon signed ranks tests comparing extent of acoustically covarying activity within the left vs. right ROIs. In addition, the correlation between HG volume in each hemisphere and the number of voxels that covaried with the acoustic manipulation was assessed.
Temporal Structure/Function analysis
A main effect of Side was seen (F = 18.2, df = 1,8, p < 0.005). No main effect of Group or Side by Group interaction was found. Due to the small number of subjects in each group, we also performed planned Wilcoxon signed ranks tests within each group examining extent of rate-related activity within the left vs. right ROI. This analysis revealed a significantly larger cortical extent of rate-related activity in the left ROI of the LHG>RHG group (Wilcoxon Z = 2.02, p < 0.05), but not the LHG≤RHG group (Wilcoxon Z = 1.48, p > 0.1; See Figure 4A). To further understand the relationship between left and right HG volume and the extent of rate-related activity within right and left HG, we combined the data from both groups and performed Spearman’s correlational analyses relating total HG volume to extent of rate-related activity within the ROI on each side. This analysis revealed a continuous structure/function relationship between left HG volume and the extent of cortex showing rate-related activity within the left ROI (Figure 4B: rho = 0.65, p < 0.05). A similar effect was not seen on the right (Figure 4C: rho = 0.03, p > 0.9) suggesting a vital role of cortical rate processing in this structure/function relationship, as opposed to the idea that a larger amount of cortex will simply activate more voxels. Mean effect size of the cortical region significantly covarying with rate within the left and right ROIs was also extracted for each subject and subjected to the same 2×2 Group by Side ANOVA as the extent data. No significant effects were found.
Figure 4.

Structure/function relationship: Temporal. A: Extent of rate-related cortex in subjects with (LHG>RHG) and without (LHG≤RHG) larger left than right HG. Mean left and right cortical extents are indicated, with significantly larger leftward extents in LHG>RHG group. Bars indicate standard error. B: Significant correlation between LHG volume and extent of rate-related activity within left ROI (rho = 0.65). C: RHG volume by extent of rate-related activity within right ROI; not significantly correlated. Spectral. D: Extent of spectral-related cortex in subjects with (LHG>RHG) and without (LHG≤RHG) larger left than right HG. Mean left and right cortical extents are indicated, with a trend toward larger rightward extents in LHG>RHG group. Bars indicate standard error. E: Correlation between LHG volume and extent of spectral-related activity within left ROI not significant. F: Significant correlation between RHG volume and extent of spectral-related activity within right ROI (rho = 0.66).
Spectral Structure/Function analysis
No main effect of either Side or Group was found (F < 1, df = 1,8, p > 0.3 both analyses), but the Side by Group interaction effect was significant (F = 5.6, df = 1,8, p < 0.05). Within-group Wilcoxon signed ranks tests comparing extents in left and right ROIs informed this interaction effect. In the LHG>RHG group, a trend towards larger extents in the right ROI was found (Z = 1.75, p = 0.08; See Figure 5A). No right/left difference was seen in the LHG≤RHG group (Z = 0.81, p > 0.4). As in the temporal analysis, strength of covariation between HG volume and extent of spectrally related cortex within the corresponding ROI was assessed using Spearman correlations. An opposite pattern to that seen in the temporal analysis was found. Left HG volumes did not significantly correlate with the extent of spectrally-related cortex in the Left ROI (rho = 0.16, p > 0.6; See Figure 5B). In contrast, Right HG volumes significantly correlated with extent of spectrally-related cortex in the Right ROI (rho = 0.66, p < 0.05; See Figure 5C). Mean effect size of the cortical region significantly covarying with spectral complexity within the left and right ROIs was also extracted for each subject and subjected to the same 2×2 Group by Side ANOVA as the extent data. No significant effects were found.
Discussion
This paper investigated how normal variations in cortical anatomy are reflected in cortical function. We predicted that the relationship between auditory cortical structure and function would differ between temporal and spectral acoustic parameters in a manner consistent with the spectrotemporal model of acoustic processing. These data provide a direct link between normal variations in auditory cortical anatomy and variations in auditory processing of spectral and temporal cues. Specifically, statistical mapping of BOLD activity analyzed with covariation and ROI techniques indicated leftward lateralization for processing of rapidly changing stimuli, and rightward lateralization for processing of spectrally complex stimuli. These data are consistent with the spectro-temporal model of lateralization (Zatorre et al., 2002), and corroborate previous studies (Schwartz and Tallal, 1980; Robin et al., 1990; Belin et al., 1998; Zatorre and Belin, 2001; Schönwiesner et al., 2005; Jamison et al., 2006). These data also support the theory of asymmetric sampling in time, which posits that left auditory cortex integrates over relatively short periods of time, and the right integrates over relatively long periods (Poeppel, 2003). Accordingly, our data showed lateralization of the slowest rate (3 Hz) to the right and the fastest rate (33 Hz) to the left. Anatomical variability of HG measured here is also consistent with other reports (Penhune et al., 1996; Leonard et al., 1998; Morosan et al., 2001; Penhune et al., 2003; Wong et al., 2008). However, the present data are the first explicitly linking anatomical variability to individual differences in both temporal and spectral acoustic processing.
Individual anatomical variation of HG relates to acoustic processing
People with the typical pattern of leftward HG asymmetry showed opposite patterns of functional activity in response to temporal vs. spectral acoustic changes. Consistent with the spectrotemporal trade-off model of acoustic processing, they had larger extents of rate-related cortex in LHG and tended towards larger extents of spectral-related cortex in RHG. We also saw larger LHG associate with temporal processing and larger RHG associate with spectral processing when looking at absolute HG volumes, regardless of typical or atypical HG asymmetry. The specificity of the temporal and spectral structure/function relationships to single and opposite HG supports the notion that the relationships are founded on the response to acoustic manipulations, and are not simply due to larger cortical regions necessarily producing more activity. Indeed, HG volume did not predict response strength. This indicates that a bigger left HG may recruit a larger cortical region for rate-related processing, but the active region will not show increased activity levels over those with a smaller gyrus. The finding that functional responses from those with the typical HG asymmetry pattern was consistent with much of the functional spectro-temporal literature makes sense in that subject samples from those studies likely include more people with larger left than right HG.
The idea that more cortical area is required for increased resolution or specialization may be a central property of the sensorimotor system. Penfield’s classic studies revealed that larger sensorimotor cortex regions are devoted to the hand than to other similarly-sized body parts, such as the knee, to support the increased hand sensitivity and control finer movements necessary for hand use (Penfield and Boldrey, 1937). Additionally, more cortex in the primary visual area is devoted to the fovea, the retinal region responsible for our high-resolution central vision, than the surrounding area which processes peripheral vision at a lower resolution (Holmes, 1918). Therefore, the larger cortical auditory region recruited in some of the subjects in the present study may reflect an increased sensitivity to rapid auditory input in those subjects. This increased cortical representation might be associated with a larger number of neurons or more fibers.
White matter volume did not selectively relate to lateralization of auditory temporal or spectral processing. However, consistent with previous work, volumetric asymmetries were larger in white than gray matter, lending support to the importance of white matter structural characteristics in processing temporal acoustic features (Penhune et al., 1996). Although we suspect microstructural white matter differences between left and right HG may be driving the lateralization of rapid auditory processing, volumetric asymmetry of white matter may be too gross a measure to see this effect. In our sample, white, gray, and total volume asymmetries were highly correlated. Uncovering the distinct influence of white matter on auditory lateralization may require direct assessment of its microstructure with techniques such as diffusion tensor imaging.
The results described in this paper were found with a small number of subjects, necessarily reducing statistical power. However, our anatomical and functional analyses were consistent with previous reports. Additionally, the structure/function relationships found were specific both to side of HG and acoustical property, and were consistent with predictions based on the spectrotemporal model of acoustic processing. The coherent patterns in our results therefore give us confidence in their validity.
HG anatomy and language learning
Left HG structure has recently been implicated in language learning. Wong, Warrier and others (2008) found that subjects who successfully learned to associate foreign (Mandarin-like) pitch patterns with word meaning had larger left HG volume than those who had difficulty learning these associations. Although spectral changes determined the semantic pitch patterns, the learning task required subjects to attend moment-to-moment pitch changes, a temporally demanding task. Additionally, Golestani and others showed that people who quickly learned to discriminate foreign speech sounds (Hindi-like retroflex consonants differing in 40 ms formant transitions) had greater concentration of white matter in left HG and parietal areas than those who learned more slowly (Golestani et al., 2002; Golestani et al., 2007). The present results suggest that a larger left HG, associated with a larger extent of rate-responsive cortex, could be associated with more efficient processing of speech-related cues which could facilitate learning and perceiving new speech sounds. We might therefore predict that subjects in this study with leftward asymmetric HGs would be better at learning these linguistic tasks. In contrast to our findings, a previous study found no clear relationship between HG volume and language lateralization, as measured with the intracarotid sodium amytal test (Dorsaint-Pierre et al., 2006), but did find that gray matter density in Broca’s area predicted lateralization. This finding likely relates to the speech production task used to elicit lateralization in that study, while the present study used a purely perceptual paradigm. It is also possible that HG volume may only relate to speech perception when learning new speech sounds, a time when acoustic fidelity impacts perception more strongly than once linguistic proficiency has been reached (Takata and Nabelek, 1990; Garcia Lecumberri and Cooke, 2006).
HG volume, musicianship and tonal processing
Two comprehensive studies link volumetric HG measures to tonal processing and musicianship (Schneider et al., 2002; Schneider et al., 2005). In the 2002 study, musicians showed larger HG gray matter than nonmusicans across hemispheres. Additionally, subjects with more HG gray matter had higher musical aptitude scores and larger early cortical responses to tonal stimuli. In the 2005 study, relative left and right volumes of lateral HG gray matter determined how subjects perceived ambiguous tones. Those relying on spectral cues showed a rightward asymmetry, and those relying on fundamental frequency showed a leftward asymmetry. Interestingly, lateralization of early cortical responses to these same tones mimicked the anatomical asymmetries. Together, these studies relate the absolute size of HG gray matter volume to musical aptitude, and its relative size to perceptual strategy. The present study specifically relates absolute size of right HG to the extent of right auditory cortex sensitive to increasing spectral information. The extent of this spectral-related cortex could affect the strength of early cortical responses measured by Schneider and colleagues. While the manner of volumetric measurement differs substantially between these studies, it appears clear that anatomical variations in HG affect the way spectral information is processed at both a basic acoustic processing level and in forming a perceptual strategy.
Microanatomical asymmetries of auditory cortex
A number of microanatomical differences between left and right HG provide some insight into potential mechanisms by which auditory cortical structure may affect the way it processes acoustic information. Fast temporal processing requires a maximally efficient organization coupled with optimized transfer times, while processing fine spectral differences requires a denser, more interconnected neural network. Primary auditory cortex is organized in columns of neuronal clusters, with cells within a neuronal column sharing functional properties. Neuronal columns in left HG are wider in diameter and spaced further apart (Seldon, 1981). Additionally, inter-column connections are less tangled and more highly myelinated on the left, allowing faster more efficiently routed transmission of information (Seldon, 1982; Anderson et al., 1999; Sigalovsky et al., 2006). Columns in right HG are closer together and more interconnected, possibly allowing finer spectral distinctions to be coded. Left HG also appears to have a higher density of neurons, with a larger proportion of large pyramidal cells (Hutsler and Gazzaniga, 1996; Morand et al., 2001). Differences between the way cells in left and right auditory cortex connect to other cells have also been found. Larger pyramidal cells have longer axons, giving the left HG more neurons with a longer reach (Hutsler and Gazzaniga, 1996). Within auditory association cortex on the left posterior superior temporal gyrus, neuronal columns are spaced further apart with longer interconnecting axons than those in the same region on the right or HG on either side (Galuske et al., 2000). Additionally, more minicolumns in left HG are associated with more fibers in the posterior midbody of the corpus callosum, where primary auditory cortex is known to project interhemispherically (Chance et al., 2006). All of these features likely contribute in yet poorly understood ways to the functional differences between left and right auditory cortices observed here and in previous studies.
Conclusion
This study describes a relationship between HG volumetric asymmetry and acoustic processing. The literature concerning cortical structure-function relationships at this level of detail is still sparse. Our data address how normal variations in the structure of sensory cortices may affect the way people process and perceive sensory information.
Supplementary Material
Supplemental Figure 1. Activation values collapsed across right and left ROIs for all spectral conditions, including Spec3 and Silence, are plotted in arbitrary units. Dotted lines indicate the region corresponding to that shown in Figure 3D. Error bars indicate standard error.
Acknowledgments
The authors would like to thank M Schönwiesner for his support and for generously donating his stimulus-generating Matlab code. Thanks also go to Patrick Bermudez, Darren Gitelman, Nondas Leloudas, Robert Risley and Trent Nicol for their assistance in completing this project. This work was supported by the following agencies: The National Institutes of Health (NIH-NIDCD), The American Hearing Research Foundation, The National Organization for Hearing Research Foundation, The Hugh Knowles Foundation and the Canadian Institutes of Health Research. All grants were awarded to the first author, excepting the last which was awarded to the fourth author.
Contributor Information
Catherine Warrier, Northwestern University, Institute for Neuroscience, Department of Communication Sciences.
Patrick Wong, Northwestern University, Communication Sciences & Disorders.
Virginia Penhune, Concordia University, Dept of Psychology.
Robert Zatorre, Montreal Neurological Institute, McGill University, Cognitive Neuroscience.
Todd Parrish, Northwestern University Feinberg Medical School, Radiology.
Daniel Abrams, Northwestern University, Communication Sciences.
Nina Kraus, Northwestern University, Communication Sciences, Neurobiology and Physiology, Otolaryngology.
Literature Cited
- Anderson B, Southern B, Powers R. Anatomic asymmetries of the posterior superior temporal lobes: A postmortem study. Neuropsychiatric, Neuropsychological, and Behavioral Neurology. 1999;12:247–254. [PubMed] [Google Scholar]
- Belin P, Zatorre RJ, Hoge R, Evans AC, Pike B. Event-related fMRI of the auditory cortex. Neuroimage. 1999;10:417–429. doi: 10.1006/nimg.1999.0480. [DOI] [PubMed] [Google Scholar]
- Belin P, Zilbovicius M, Crozier S, Thivard L, Fontaine A, Masure MC, Samson Y. Lateralization of speech and auditory temporal processing. Journal of Cognitive Neuroscience. 1998;10:536–540. doi: 10.1162/089892998562834. [DOI] [PubMed] [Google Scholar]
- Brett M, Anton J-L, Valabregue R, Poline J-B. Region of interest analysis using an SPM toolbox. 8th International Conference on Functional Mapping of the Human Brain; Sendai, Japan. 2002. [Google Scholar]
- Chance SA, Casanova MF, Switala AE, Crow TJ. Minicolumnar structure in Heschl’s gyrus and planum temporale: Asymmetries in relation to sex and callosal fiber number. Neuroscience. 2006;143:1041–1050. doi: 10.1016/j.neuroscience.2006.08.057. [DOI] [PubMed] [Google Scholar]
- Collins DL, Neelin P, Peters TM, Evans AC. Automatic 3D intersubject registration of MR volumetric data in standardized Talairach space. Journal of Computer Assisted Tomography. 1994;18:192–205. [PubMed] [Google Scholar]
- Collins DL, Holmes C, Peters TM, Evans AC. Automatic 3D model-based neuroanatomical segmentation. Human Brain Mapping. 1995:190–208. [Google Scholar]
- Dorsaint-Pierre R, Penhune VB, Watkins KE, Neelin P, Lerch JP, Bouffard M, Zatorre RJ. Asymmetries of the planum temporale and Heschl’s gyrus: relationship to language lateralization. Brain. 2006;129:1164–1176. doi: 10.1093/brain/awl055. [DOI] [PubMed] [Google Scholar]
- Galuske RAW, Schlote W, Bratzke H, Singer W. Interhemispheric Asymmetries of the Modular Structure in Human Temporal Cortex. Science. 2000;289:1946–1949. doi: 10.1126/science.289.5486.1946. [DOI] [PubMed] [Google Scholar]
- Garcia Lecumberri ML, Cooke M. Effect of masker type on native and non-native consonant perception in noise. J Acoust Soc Am. 2006;119:2445–2454. doi: 10.1121/1.2180210. [DOI] [PubMed] [Google Scholar]
- Golestani N, Paus T, Zatorre RJ. Anatomical correlates of learning novel speech sounds. Neuron. 2002;35:997–1010. doi: 10.1016/s0896-6273(02)00862-0. [DOI] [PubMed] [Google Scholar]
- Golestani N, Molko N, Dehaene S, LeBihan D, Pallier C. Brain structure predicts the learning of foreign speech sounds. Cereb Cortex. 2007;17:575–582. doi: 10.1093/cercor/bhk001. [DOI] [PubMed] [Google Scholar]
- Hall DA, Johnsrude IS, Haggard MP, Palmer AR, Akeroyd MA, Summerfield AQ. Spectral and temporal processing in human auditory cortex. Cereb Cortex. 2002;12:140–149. doi: 10.1093/cercor/12.2.140. [DOI] [PubMed] [Google Scholar]
- Hall DA, Haggard MP, Akeroyd MA, Palmer AR, Summerfield AQ, Elliott MR, Gurney EM, Bowtell RW. “Sparse” temporal sampling in auditory fMRI. Human Brain Mapping. 1999;7:213–223. doi: 10.1002/(SICI)1097-0193(1999)7:3<213::AID-HBM5>3.0.CO;2-N. [DOI] [PMC free article] [PubMed] [Google Scholar]
- Hickok G, Poeppel D. The cortical organization of speech processing. Nat Rev Neurosci. 2007;8:393–402. doi: 10.1038/nrn2113. [DOI] [PubMed] [Google Scholar]
- Holmes G. Disturbances of vision by cerebral lesions. Br J Ophthalmol. 1918;2:353–384. doi: 10.1136/bjo.2.7.353. [DOI] [PMC free article] [PubMed] [Google Scholar]
- Hutsler JJ, Gazzaniga MS. Acetylcholinesterase staining in human auditory and language cortices: regional variation of structural features. Cereb Cortex. 1996;6:260–270. doi: 10.1093/cercor/6.2.260. [DOI] [PubMed] [Google Scholar]
- Jamison HL, Watkins KE, Bishop DVM, Matthews PM. Hemispheric Specialization for Processing Auditory Nonspeech Stimuli. Cerebral Cortex. 2006;16:1266–1275. doi: 10.1093/cercor/bhj068. [DOI] [PubMed] [Google Scholar]
- Johnsrude IS, Penhune VB, Zatorre RJ. Functional specificity in the right human auditory cortex for perceiving pitch direction. Brain. 2000:123. doi: 10.1093/brain/123.1.155. [DOI] [PubMed] [Google Scholar]
- Leonard CM, Puranik C, Kuldau JM, Lombardino LJ. Normal variation in the frequency and location of human auditory cortex landmarks. Heschl’s gyrus: where is it? Cerebral Cortex. 1998;8:397–406. doi: 10.1093/cercor/8.5.397. [DOI] [PubMed] [Google Scholar]
- Liégeois-Chauvel C, de Graaf JB, Laguitton V, Chauvel P. Specialization of left auditory cortex for speech perception in man depends on temporal coding. Cerebral Cortex. 1999;9:484–496. doi: 10.1093/cercor/9.5.484. [DOI] [PubMed] [Google Scholar]
- Liégeois-Chauvel C, Giraud K, Badier J-M, Marquis P, Chauvel P. Intracerebral evoked potentials in pitch perception reveal a functional asymmetry of human auditory cortex. Annals of the New York Academy of Sciences. 2001;930:117–132. doi: 10.1111/j.1749-6632.2001.tb05728.x. [DOI] [PubMed] [Google Scholar]
- MacDonald J, Avis D, Evans AC. Multiple surface identification and matching in magnetic resonance images. Proceedings of the Society for Visual Biomedical Computing. 1994:160–169. [Google Scholar]
- Moore BC, Glasberg BR. Suggested formulae for calculating auditory-filter bandwidths and excitation patterns. Journal of the Acoustical Society of America. 1983;74:750–753. doi: 10.1121/1.389861. [DOI] [PubMed] [Google Scholar]
- Morand N, Bouvard S, Ryvlin P, Mauguiere F, Fischer C, Collet L, Veuillet E. Asymmetrical localization of benzodiazepine receptors in the human auditory cortex. Acta Otolaryngol. 2001;121:293–296. doi: 10.1080/000164801300043901. [DOI] [PubMed] [Google Scholar]
- Morosan P, Rademacher J, Schleicher A, Amunts K, Schormann T, Zilles K. Human primary auditory cortex: cytoarchitectonic subdivisions and mapping into a spatial reference system. Neuroimage. 2001;13:684–701. doi: 10.1006/nimg.2000.0715. [DOI] [PubMed] [Google Scholar]
- Oldfield RC. The assessment and analysis of handedness: The Edinburgh inventory. Neuropsychologia. 1971;9:97–113. doi: 10.1016/0028-3932(71)90067-4. [DOI] [PubMed] [Google Scholar]
- Parrish TB, Gitelman DR, LaBar KS, Mesulam MM. Impact of signal-to-noise on functional MRI. Magnetic Resonance in Medicine. 2000;44:925–932. doi: 10.1002/1522-2594(200012)44:6<925::aid-mrm14>3.0.co;2-m. [DOI] [PubMed] [Google Scholar]
- Patterson RD, Uppenkamp S, Johnsrude IS, Griffiths TD. The processing of temporal pitch and melody information in auditory cortex. Neuron. 2002;36:767–776. doi: 10.1016/s0896-6273(02)01060-7. [DOI] [PubMed] [Google Scholar]
- Penfield W, Boldrey E. Somatic motor and sensory representation in the cerebral cortex of man as studied by electrical stimulation. Brain. 1937;60:389–443. [Google Scholar]
- Penhune VB, Zatorre RJ, MacDonald JD, Evans AC. Interhemispheric anatomical differences in human primary auditory cortex: Probabilistic mapping and volume measurement from magnetic resonance scans. Cerebral Cortex. 1996;6:661–672. doi: 10.1093/cercor/6.5.661. [DOI] [PubMed] [Google Scholar]
- Penhune VB, Cismaru R, Dorsaint-Pierre R, Petitto LA, Zatorre RJ. The morphometry of auditory cortex in the congenitally deaf measured using MRI. Neuroimage. 2003;20:1215–1225. doi: 10.1016/S1053-8119(03)00373-2. [DOI] [PubMed] [Google Scholar]
- Poeppel D. The analysis of speech in different temporal integration windows: cerebral lateralization as ‘asymmetric sampling in time’. Speech Communication. 2003;41:245–255. [Google Scholar]
- Rademacher J, Caviness VS, Jr, Steinmetz H, Galaburda AM. Topographical variation of the human primary cortices: implications for neuroimaging, brain mapping, and neurobiology. Cereb Cortex. 1993;3:313–329. doi: 10.1093/cercor/3.4.313. [DOI] [PubMed] [Google Scholar]
- Robin DA, Tranel D, Damasio H. Auditory perception of temporal and spectral events in patients with focal left and right cerebral lesions. Brain and Language. 1990;39:539–555. doi: 10.1016/0093-934x(90)90161-9. [DOI] [PubMed] [Google Scholar]
- Schneider P, Scherg M, Dosch HG, Specht HJ, Gutschalk A, Rupp A. Morphology of Heschl’s gyrus reflects enhanced activation in the auditory cortex of musicians. Nat Neurosci. 2002;5:688–694. doi: 10.1038/nn871. [DOI] [PubMed] [Google Scholar]
- Schneider P, Sluming V, Roberts N, Scherg M, Goebel R, Specht HJ, Dosch HG, Bleeck S, Stippich C, Rupp A. Structural and functional asymmetry of lateral Heschl’s gyrus reflects pitch perception preference. Nature neuroscience. 2005;8:1241–1247. doi: 10.1038/nn1530. [DOI] [PubMed] [Google Scholar]
- Schönwiesner M, Rubsamen R, von Cramon DY. Hemispheric asymmetry for spectral and temporal processing in the human antero-lateral auditory belt cortex. European Journal of Neuroscience. 2005;22:1521–1528. doi: 10.1111/j.1460-9568.2005.04315.x. [DOI] [PubMed] [Google Scholar]
- Schwartz J, Tallal P. Rate of acoustic change may underlie hemispheric specialization for speech perception. Science. 1980;207:1380–1381. doi: 10.1126/science.7355297. [DOI] [PubMed] [Google Scholar]
- Seldon HL. Structure of human auditory cortex. I. Cytoarchitectonics and dendritic distributions. Brain Research. 1981;229:277–294. doi: 10.1016/0006-8993(81)90994-x. [DOI] [PubMed] [Google Scholar]
- Seldon HL. Structure of human auditory cortex. III. Statistical analysis of dendritic trees. Brain Research. 1982;249:211–221. doi: 10.1016/0006-8993(82)90055-5. [DOI] [PubMed] [Google Scholar]
- Sigalovsky IS, Fischl B, Melcher JR. Mapping an intrinsic MR property of gray matter in auditory cortex of living humans: A possible marker for primary cortex and hemispheric differences. NeuroImage. 2006;32:1524–1537. doi: 10.1016/j.neuroimage.2006.05.023. [DOI] [PMC free article] [PubMed] [Google Scholar]
- Sled JG, Zijdenbos AP, Evans AC. A nonparametric method for automatic correction of intensity nonuniformity in MRI data. IEEE Transactions in Medical Imaging. 1998;17:87–97. doi: 10.1109/42.668698. [DOI] [PubMed] [Google Scholar]
- Sweet RA, Dorph-Petersen K-A, Lewis DA. Mapping auditory core, lateral belt, and parabelt cortices in the human superior temporal gyrus. The Journal of Comparative Neurology. 2005;491:270–289. doi: 10.1002/cne.20702. [DOI] [PubMed] [Google Scholar]
- Takata Y, Nabelek AK. English consonant recognition in noise and in reverberation by Japanese and American listeners. J Acoust Soc Am. 1990;88:663–666. doi: 10.1121/1.399769. [DOI] [PubMed] [Google Scholar]
- Tervaniemi M, Hugdahl K. Lateralization of auditory-cortex functions. Brain Research Brain Research Reviews. 2003;43:231–246. doi: 10.1016/j.brainresrev.2003.08.004. [DOI] [PubMed] [Google Scholar]
- Wong PC, Warrier CM, Penhune VB, Roy AK, Sadehh A, Parrish TB, Zatorre RJ. Volume of left Heschl’s Gyrus and linguistic pitch learning. Cereb Cortex. 2008;18:828–836. doi: 10.1093/cercor/bhm115. [DOI] [PMC free article] [PubMed] [Google Scholar]
- Wong PCM, Warrier CM, Penhune VB, Roy A, Sadehh A, Parrish TB, Zatorre RJ. Morphology of Heschl’s Gyrus and Linguistic Pitch Learning. Cereb Cortex. 2007 doi: 10.1093/cercor/bhm115. Advance online publication. [DOI] [PMC free article] [PubMed] [Google Scholar]
- Zatorre R, Belin P. Spectral and temporal processing in human auditory cortex. Cerebral Cortex. 2001;11:946– 953. doi: 10.1093/cercor/11.10.946. [DOI] [PubMed] [Google Scholar]
- Zatorre RJ. Pitch perception of complex tones and human temporal-lobe function. Journal of the Acoustical Society of America. 1988;84:566–572. doi: 10.1121/1.396834. [DOI] [PubMed] [Google Scholar]
- Zatorre RJ, Belin P, Penhune VB. Structure and function of auditory cortex: music and speech. Trends in Cognitive Sciences. 2002;6:37–46. doi: 10.1016/s1364-6613(00)01816-7. [DOI] [PubMed] [Google Scholar]
- Zwicker E. Subdivision of the Audible Frequency Range into Critical Bands (Frequenzgruppen) The Journal of the Acoustical Society of America. 1961;33:248. [Google Scholar]
Associated Data
This section collects any data citations, data availability statements, or supplementary materials included in this article.
Supplementary Materials
Supplemental Figure 1. Activation values collapsed across right and left ROIs for all spectral conditions, including Spec3 and Silence, are plotted in arbitrary units. Dotted lines indicate the region corresponding to that shown in Figure 3D. Error bars indicate standard error.