

Abstract
Release of mitochondrial cytochrome c resulting in downstream activation of cell death pathways has been suggested to play a role in neurologic diseases featuring cell death. However, the specific biologic importance of cytochrome c release has not been demonstrated in Huntington’s disease (HD). To evaluate the role of cytochrome c release, we screened a drug library to identify new inhibitors of cytochrome c release from mitochondria. Drugs effective at the level of purified mitochondria were evaluated in a cellular model of HD. As proof of principle, one drug was chosen for in depth evaluation in vitro and a transgenic mouse model of HD. Our findings demonstrate the utility of mitochondrial screening to identify inhibitors of cell death and provide further support for the important functional role of cytochrome c release in HD. Given that many of these compounds have been approved by the Food and Drug Administration for clinical usage and cross the blood– brain barrier, these drugs may lead to trials in patients.
Keywords: drug screen, inhibitors of cytochrome c release, methazolamide, Huntington’s disease, R6/2 mice, mutant-htt ST14A cells
Introduction
Release of cytochrome c from the mitochondria into the cytoplasm has been clearly demonstrated to result in downstream caspase activation leading to cell death. A common feature in the progression toward cell death is mitochondrial dysfunction that is associated with the release of cytochrome c from the mitochondria into the cytoplasm (Beal, 1999; Bernardi et al., 1999; Zhu et al., 2002; Friedlander, 2003; Wang et al., 2003; Zhang et al., 2003; Chan, 2004). The presence of cytochrome c in the cytoplasm is often detected after a broad range of insults to the CNS during acute and chronic neurodegeneration (Hengartner, 2000; Rigamonti et al., 2001; Zhu et al., 2002; Friedlander, 2003; Wang et al., 2003). Cytochrome c associates with Apaf-1 to form the “apoptosome.” This molecular assembly also includes procaspase-9, a protein that undergoes autocatalytic proteolysis to mature caspase-9. This enzyme activates caspase-3, which in turn plays an important role in cell death (Li et al., 1997; Zou et al., 1997). However, whether inhibiting release of cytochrome c would result in neuroprotection in vivo has not been definitively demonstrated.
In previous work, we have demonstrated that minocycline directly inhibits the release of cytochrome c from mitochondria (Zhu et al., 2002). Presumably, this molecular property may explain the broad range of neuroprotective effects of the drug: it is beneficial in experimental models of stroke, traumatic brain and spinal cord injury, Huntington’s disease (HD), amyotrophic lateral sclerosis (ALS), Parkinson disease, and multiple sclerosis (Yrjänheikki et al., 1998; Chen et al., 2000; Brundula et al., 2002; Wu et al., 2002; Zhu et al., 2002; Friedlander, 2003; Wang et al., 2003). However, a challenge in determining that it is this function (i.e., inhibition of cytochrome c release) that mediates its neuroprotective action, is that minocycline has a number of additional functions that potentially explain its protective properties. In addition to inhibiting cytochrome c release, minocycline either directly or indirectly inhibits reactive microgliosis, p38MAPK, and poly(ADP-ribose) polymerase (Tikka et al., 2001; Wu et al., 2002; Alano et al., 2006). Therefore, to provide further evidence for the physiologic role of cytochrome c release in HD, we searched for additional drugs that could inhibit cytochrome c release, and thereafter would evaluate them in models of HD. The first step in our goal to search for cytochrome c release inhibitors is to develop a cell-free screening assay to identify drugs that inhibit mitochondrial cytochrome c release. The battery of potential agents is the library of the Neurodegeneration Drug Screening Consortium of 1040 compounds assembled by the National Institute of Neurological Disorders and Stroke (NINDS). Drugs in this library are mainly chosen from those approved for clinical usage by the Food and Drug Administration (FDA). In addition, many of them are known to cross the blood–brain barrier. The effectiveness of screening this particular library has been demonstrated by several publications by a number of independent laboratories identifying potential new neuroprotective drugs (Aiken et al., 2004; Stavrovskaya et al., 2004; Rothstein et al., 2005; W. Wang et al., 2005).
In this study, we present findings from the in vitro screen, using isolated mitochondria, of this 1040 compound library for inhibitors of cytochrome c release. Drugs effective in the cell-free assay were used in a secondary screen to identify those that are protective in neuronal cell lines. Promising hits were evaluated in mutant-huntingtin (htt) striatal ST14A cells. One of the effective drugs, methazolamide, was selected for further in depth evaluation. During trials in a transgenic mouse model, methazolamide proved to delay disease onset and mortality, as well as histologic markers of neurodegeneration of a chronic neurodegenerative syndrome resembling HD. Our results demonstrate that techniques of mitochondrial-based screening are useful in the identification of agents that are neuroprotective and provide further in vivo evidence for the functional role of cytochrome c release in HD.
Materials and Methods
Drugs
The drugs were obtained from the 1040 compounds National Institute of Neurological Disorders and Stroke library by Custom Collection of Microsource Discovery Systems or were obtained from Sigma-Aldrich.
Mitochondrial screen
Mouse liver mitochondria were purified after the previously described method (Zhu et al., 2002). An aliquot of 100 μl (0.1 mg/ml) mouse liver mitochondrial preparation was preincubated with compounds from the NINDS drug library at a final concentration of 20 μM (diluted with assay medium by 500× from the 10 mM stock solution in DMSO) for 5 min in a buffer containing 250 mM sucrose, 10 mM Hepes, pH 7.5, 1 mM ATP, 5 mM sodium succinate, 0.08 mM ADP, and 2 mM K2HPO4. Mitochondria were then incubated with 20 μM CaCl2 at 30°C for 30 min. Mixtures were centrifuged at 10,000 × g at 4°C for 10 min and the supernatant evaluated using a Cytochrome c ELISA kit (R&D systems).
ELISA
The NINDS library was obtained as 13 kits with 80 compounds in each. A single 96-well ELISA plate was dedicated to each kit of 80 compounds. Drugs were assayed with a separate mitochondrial preparation for each kit. For each sample within a given 96-well plate, the absorbance at 450 nm (a measure of cytochrome c concentration) was corrected by subtracting the background reading at 540 nm. Cytochrome c concentration was calculated by interpolating these values on a standard curve constructed for each plate.
Cell lines and stimulation of cell death
The cell line ST14A are striatal cells conditionally immortalized by transfection with a temperature-sensitive form of the SV40 large T-antigen. ST14A cells stably expressing a mutant huntingtin fragment [N548mu (nt1955-128), mutant-htt ST14A] cells were cultured as described previously (Rigamonti et al., 2000). Mutant-htt ST14A cells were kindly provided by Dr. Elena Cattaneo (University of Milan, Milan, Italy). Cells were shifted to the nonpermissive temperature of 37°C in serum-deprived medium (SDM) for the indicated times (Wang et al., 2003). All experiments used 2 h of preincubation with test drugs. Cell death was determined by the 3-(4,5-dimethylthiazol-2-yl)-2,5-diphenyl tetrazolium bromide (MTS) and the trypan blue dye exclusion assays.
MTS assay
The assay was performed according to the manufacturer’s instructions (Promega). Cell viability was assessed on mutant-htt ST14A cells using the MTS assay, a measure of mitochondrial function and thus cell survival.
Trypan blue dye exclusion assay
Mutant-htt ST14A cells shifted to the nonpermissive temperature of 37°C in SDM with or without test drugs, were stained in 0.4% trypan blue in PBS (Sigma-Aldrich) for 30 min, and dead cells were counted as the numbers of blue cells as described previously (Wang et al., 2004a,b).
Western blot
Samples of mouse brain were lysed in radioimmunoprecipitation assay buffer with protease inhibitors (Zhu et al., 2002; Wang et al., 2003). Antibody to caspase-3 were purchased from Cell Signaling Technology, antibody to caspase-9 from Cell Signaling Technology, antibody to β-actin from Sigma-Aldrich, and secondary antibodies and ECL reagents from GE Healthcare.
Cellular and tissue fractionation
Mutant-htt ST14A cells and mouse brain cytosolic fractionations were performed as described previously (Zhu et al., 2002; Wang et al., 2003; Zhang et al., 2003). Released cytochrome c or Smac/Diablo was analyzed by Western blot. Antibody to cytochrome c was purchased from BD Pharmingen. Smac/Diablo antibody was purchased from Novus Biologicals.
Immunocytochemistry and mitotracker staining
Mutant-htt ST14A cells were treated as indicated on chamber slides. The cells were incubated with 1.5 μM Mitotracker Red CMXRos (Invitrogen), prepared in prewarmed culture media for 45 min, and fixed in 3.7% paraformaldehyde prepared in prewarmed culture media for 5 min, and then in ice-cold acetone for 5 min. Blocking was done in 5% BSA in PBS for 30 min. Cells then were incubated with antibodies to cytochrome c and incubated with FITC-conjugated secondary antibodies. Deconvoluted images were taken with a Nikon Eclipse TE200 fluorescence microscope and processed by using IPLab software (Spectra Services).
Caspase activity assays
Cell extracts and enzyme assays were performed with the ApoAlert caspase fluorescent assay kit as described previously (Wang et al., 2003, 2006). Caspase-3-like substrate Ac-DEVD-AFC (N-acetyl-DEVD-7-amino-4-trifluoromethyl coumarin) was from BD Pharmingen, caspase-9-like substrate Ac-LEHD-AFC (7-amino-4-trifluoromethylcoumarin) was from Calbiochem. Released AFC was quantified in a Bio-Rad Versa Fluorometer (excitation at 400 nm and emission at 505 nm).
Determination of membrane potential in living cells
Striatal cells were treated as indicated with or without methazolamide or gossypol-acetic acid complex. Mitoprobe JC-1 staining (Invitrogen) (5 μg/ml for 10–20 min) and rhodamine 123 (Rh 123) staining (Invitrogen) (2 μM for 5 min) was performed in living cells. Deconvoluted images were taken with a Nikon Eclipse TE200 fluorescence microscope and processed with IPLab software (Spectra Services).
Measurement of mitochondrial permeability transition in isolated rat liver mitochondria
Rat liver mitochondria were isolated from 4-month-old male Fisher 344 × Brown Norway F1 rats by differential centrifugation, as described previously (Zhu et al., 2002; Wang et al., 2003). The isolation buffer contained 0.3 M sucrose, 10 mM Hepes, 1 mM EGTA, and 0.5% BSA. The protein content was determined by the Lowry method with bovine serum albumin as a standard. Isolated mitochondria were then incubated in the buffer containing 250 mM sucrose, 10 mM Hepes, pH 7.4, 2.5 mM KH2PO4, and 5 mM K+-succinate or glutamate/malate, mitochondria 1 mg/ml. Mitochondria swelling was induced by Ca2+, tert-butylhydroperoxide (tBH), PhAsO, or diamide, and monitored in standard spectroscopic assay at 540 nm. Mitochondrial physiological parameters including membrane potential (ΔΨ), Ca2+ uptake capacity, redox state of pyridine nucleotides, and swelling was performed simultaneously on multichannel dye fluorimeter (C&L Instruments) (Baranov et al., 2008). Mitochondrial (ΔΨ was estimated using tetramethylrhodamine methyl ester (TMRM) (60 nM) (Invitrogen) fluorescence intensity changes at excitation and emission wavelengths 543 and 590 nm. Mitochondrial Ca2+ uptake and release capacity was measured as changes of extramitochondrial [Ca2+] followed by fluorescence intensity of CaGreen-5N (125 nM) (Invitrogen) at excitation and emission wavelengths 482 and 535 nm. Redox state of pyridine nucleotides was followed by measuring nicotinamide adenine dinucleotide (NADH) autofluorescence at excitation and emission wavelengths 350 and 450 nm. Mitochondrial swelling was measured as a function of light scattering at λ excitation and emission wavelengths 587 nm.
R6/2 mice and treatment regimen
R6/2 mice were originally obtained from Jackson ImmunoResearch Laboratories. Given that the mice longevity was longer than the standard R6/2 mice, we performed trinucleotide (CAG) length analysis. As may be expected, these mice had a shorter CAG repeat than other R6/2 mice (110–115 vs 150). The mice were randomly assigned to two groups. At 6 weeks of age, mice were treated with daily intraperitoneal injections of either saline or methazolamide (40 or 20 mg/kg; Sigma-Aldrich). For all experiments, each group had equal numbers of males and females. Muscle strength and coordination were evaluated weekly using a rotarod (Columbus Instruments). Disease onset was defined as the first day that the mouse failed to remain 7 min at 15 rpm. Mortality was defined as the age at death or when the mouse was unable to right itself within 30 s. Body weight was recorded weekly. At 25 weeks, groups (n = 6) of saline-treated and methazolamide-treated R6/2 and littermate wild-type (WT) control mice were deeply anesthetized and then transcardially perfused with 2% buffered paraformaldehyde, brains were cryoprotected and serially sectioned (50 μm), stained for Nissl substance using cresyl violet, and immunostained using antibodies for mutant Huntingtin and dopamine and cAMP-regulated phosphoprotein-32 (DARP-32). Sections were rinsed in tris-buffered saline with Tween 20 (TBS-T) containing 10% normal goat serum for 1 h. Sections were then incubated overnight in TBS-T with 0.1% sodium azide and mouse antihuntingtin (1:500; Millipore) and anti-DARP-32 (1:500; Santa Cruz Biotechnology). Sections were rinsed in TBS-T, followed by a 2–3 h incubation in secondary antibodies. Sections were then rinsed three times in TBS-T. Antibody complexes were visualized using diaminobenzidine. Preabsorbtion with excess target protein, or omission of either primary or secondary antibody, was used to demonstrate antibody specificity and background generated from the detection assay. Tissue sections were examined using a Nikon Eclipse E800 microscope with a Spot RT digital camera. At 25 weeks, groups (n = 3) of saline-treated and methazolamide-treated R6/2 and littermate wild-type control mice’s brains were removed and extracted for Western blot analysis.
Stereology/quantitation
Serial-cut coronal tissue-sections from the most rostral segment of the neostriatum to the level of the anterior commissure (interaural 5.34 mm/bregma 1.54 mm to interaural 3.7 mm/bregma −0.10 mm) were used for huntingtin aggregate analysis. Unbiased stereological counts of huntingtin-positive aggregates (>1.0 μm) were obtained from the neostriatum in six mice each from methazolamide-treated and saline-treated R6/2 mice at 25 weeks using Neurolucida Stereo Investigator software (Microbrightfield). The total areas of the rostral brain, ventricles, and neostriatum were defined in serial sections. Counting frames were randomly sampled within the neostriatum for huntintin aggregate counts. The optical dissector method was used estimating the number of huntingtin-positive aggregates. Striatal neuron areas were analyzed by microscopic videocapture using a Windows-based image analysis system for area measurement (Optimas; BioScan). The software automatically identifies and measures profiles. All computer identified cell profiles were manually verified as neurons and exported to Microsoft Excel. Experiments were in accordance with protocols approved by the Harvard Medical School Animal Care Committee.
Statistical analysis
Densitometric quantification was performed with the Quantity One Program (Bio-Rad). Statistical significance was evaluated by t test or ANOVA: p values <0.05 and <0.001 were considered significant. Neuropathological data were compared by ANOVA or repeated measures of ANOVA and by nonpaired Student’s t test (Stat-View). Drug analysis, including IC50 and maximum protection, were performed by GraphPad Prism program. Kaplan–Meier plots were performed using the SAS software.
Results
Screen for inhibitors of cytochrome c release from purified mitochondria
To search for inhibitors of cytochrome c release, we have developed a cell-free screening assay to identify drugs that inhibit cytochrome c release from mouse-liver mitochondria. Isolated mitochondria are preincubated with the test drug for 5 min. To induce cytochrome c release, the organelles are treated with 20 μM Ca2+ for 30 min at 37°C. After removing the mitochondria by centrifugation, the supernatant is analyzed by ELISA to determine the concentration of cytochrome c. This procedure was used to test all 1040 compounds in a library assembled by the Neurodegeneration Drug Screening Consortium of the NINDS. Many of these molecules cross the blood–brain barrier and the majority are FDA-approved drugs already in clinical usage.
Experiments were performed in a “double-blind” manner by observers unaware of the identity of each drug. Figure 1A shows the distribution of activities among the 80 compounds compromising one of 13 “kits” that constitute the library. Equivalent data were gathered for the 12 other kits. To generate Figure 1B, the data for each of these 13 sets of compounds are normalized so that the average in each kit is the same. The colored curves generated in this manner are then summed to form a grand distribution covering the entire NINDS library (Fig. 1, solid black line). Most drugs have little effect on the release of cytochrome c in response to Ca2+ stimulation. However, there are outlying points, indicative of drugs that substantially stimulate or, more significantly, inhibit cytochrome c release.
Figure 1.

Cytochrome c release from purified mitochondria is differentially affected by the various compounds in the NINDS library. A, This distribution is constructed from measurements of the impact of each drug on cytochrome c release. Data are gathered on 80 compounds (i.e., the entire complement of kit 6). The x-coordinate in this graph is a measure of cytochrome c release from Ca 2+-stimulated mitochondria. The x-axis is divided into intervals, 20 of them per 1 ng/ml change. The y-coordinate is the number of events falling into each such bin. The green line marks the level of cytochrome c release upon stimulation with Ca 2+ ions but in the absence of other pharmacological agents. Compounds scored to the right of the green line stimulate cytochrome c release; those scored to its left are inhibitory of the process. The blue line corresponds to the level of cytochrome c release in the absence of Ca 2+ ions. The red line is the level of Ca 2+-stimulated mitochondria in the presence of cyclosporin A. B, Colored curves are equivalent distributions for each of the 13 kits. Measurements within each set of compounds are normalized, thereby generating distributions with identical mean values. The black line is the sum of these 13 distributions. The dotted line is 1.5 SDs less than the mean value for the grand distribution. The x-axis is again divided into intervals, each of which spans 1/20 of the unit distance from zero to the normalized mean. The y-coordinate is the number of measurements among all 1040 that fall into the interval in question. C, After ranking the compounds for their effectiveness at inhibiting cytochrome c release, 21 of them are selected. Not only do these potentially therapeutic molecules strongly affect the test mitochondria, they are known to cross the blood– brain barrier and can be safely administered to patients. All are in clinical usage, each one in the indicated capacity. NCC, National Institute of Neurological Disorders and Stroke Custom Collection.
To choose potentially neuroprotective compounds, we selected those that depress cytochrome c release by >1.5 SDs below the mean of the grand distribution (i.e., to the left of the dotted line). In the primary screen, 48 compounds were found to suppress cytochrome c release to below this value. In a second screen, 39 of the top candidates were confirmed to be effective when present at 10 and 20 μM (data not shown). We then selected among them on the basis of their current clinical usage and overall ranking in the above screen. In addition, all drugs causing major side effects and those excluded from the CNS by the blood–brain barrier were removed, leaving 21 compounds (Fig. 1C). Thus, our cell-free assay narrowed the list of compounds for investigation in living cells to <2% of the original list of 1040. We note that minocycline is the second most potent drug identified using this protocol, and the related antibiotic doxycycline ranks seventh.
Inhibitors of cytochrome c release are protective of cultured cells
Living cells are far more complex than mitochondria; we therefore tested in a cellular system the 21 compounds that most strongly inhibit cytochrome c release from purified mitochondria. In this experiment, each potentially neuroprotective drug was used to treat mutant-htt expressing ST14A cells, a cellular model of HD (Rigamonti et al., 2000; Wang et al., 2003; X. Wang et al., 2005), and one in which cytochrome c release is known to stimulate the cell death process (Rigamonti et al., 2001; Wang et al., 2003). The stimulus used to induce cell death is shifting the temperature-sensitive cells from 33°C (the permissive temperature) to 37°C (the nonpermissive temperature) in serum-deprived medium (Rigamonti et al., 2000; Wang et al., 2003; X. Wang et al., 2005), that caused ~40% cell death in mutant-htt ST14A cells as positive control and ~18% cell death in parental ST14A cells as negative control with MTS assay in our previously published study (X. Wang et al., 2005).
To determine the relative potencies of these drugs, we measured the extent of cell death as a function of drug concentration. Each drug was tested at 7–10 concentrations by the MTS assay. The resulting curves (plotted semilogarithmically) define the IC50 and maximum protection afforded by each compound (Fig. 2) (supplemental Table S1, available at www.jneurosci.org as supplemental material). The dose–response curves for the 21 drugs can be classified into three broad categories: compounds in groups I and II reduce cell death as induced by temperature shift. Those in group I are active at lower concentrations than the ones in group II, having values for IC50 in the nanomolar range. However, they are toxic at higher concentrations (Fig. 2A). Compounds in group II inhibit cell death over a wide range of concentrations but they have values for IC50 in the micromolar range (Fig. 2 B). In addition, a direct measure of cell death by trypan blue dye exclusion assay at the maximally effective concentration of each compound provides similar neuroprotection (supplemental Fig. 2, available at www.jneurosci.org as supplemental material), thus confirms the results from the MTS assay.
Figure 2.

Assay of the 21 selected compounds for their ability to rescue cultured cells. Mutant-htt ST14A striatal cells are shifted to 37°C (the nonpermissive temperature) in SDM to induce cell death. A test drug is present in the medium (except for in the control culture) for 2 h before the temperature shift and for another 18 h afterward. The relative extent of cell death is evaluated using the MTS, inner salt assay. The cell death induced by temperature shift in SDM is defined as 100%. The relative percentage of cell death resulting by the incubation of different concentrations of test drug under temperature shift in SDM is recorded as the relative cell death. Including the drug-free control, there are a total of 22 assays. In all cases, cells were evaluated in sextuplicate, each in a single slot of a 96-well plate and tested using an automated plate reader. This entire experimental program was independently repeated three times. Each data point corresponds to the mean ±SD of the resulting 18 trials (supplemental Table S1, available at www.jneurosci.org as supplemental material). The results are displayed graphically in this figure. Compounds are classified into three categories according to their maximal efficiency at forestalling cell death and the IC50 for this activity. A, Group I compounds are protective in the nanomolar range. B, Group II compounds are protective in the micromolar range. C, Group III compounds are not protective (and are sometimes toxic). This classification is pertinent, as is apparent upon perusal of the tabulated parameters.
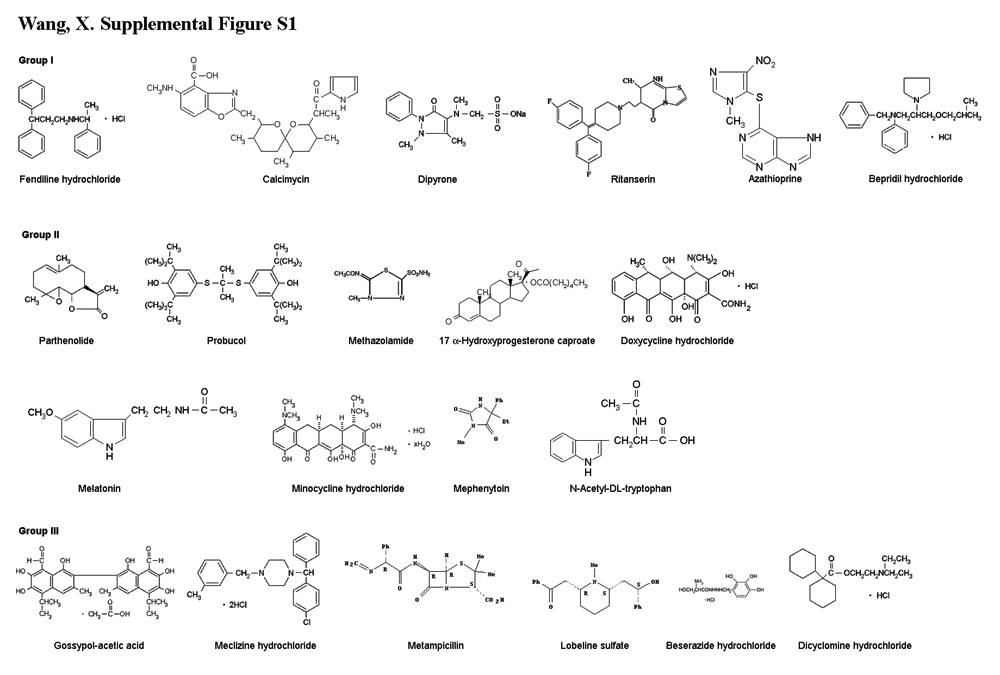
In contrast, group III compounds, though active on purified mitochondria, exhibit no significant inhibition of cell death (Fig. 2C). It is noteworthy that three compounds in group I (fendiline hydrochloride, ritanserin, and bepridil hydrochloride) and the group III compound meclizine hydrochloride all contain two phenyl rings and one positively charged center (nitrogen) (supplemental Fig. S1, available at www.jneurosci.org as supplemental material). This structural motif is reminiscent of a portion of tetra-phenylphosphonium, a compound known to localize to mitochondria.
We found that four of the compounds in group I hold special promise as potentially neuroprotective drugs. The IC50 for these compounds is particularly low, and they offer strong protection at the saturating concentration. They are fendiline hydrochloride, calcimycin, dipyrone, and bepridil hydrochloride, compounds with IC50 of 7, 7, 15, and 128 nM, respectively. Ritanserin and azathioprine are unlikely to prove neuroprotective because they fail to provide even 30% protection when present at saturating concentrations. Nevertheless, their low IC50 of 50 and 124 nM, respectively, relegate them to group I (Fig. 2A).
Among group II compounds, 10 were found to be potentially protective against neurodegeneration. These compounds are parthenolide (IC50, 1.3 μM), hydroxyprogesterone caproate (2.5 μM), probucol (6.6 μM), methazolamide (9.5 μM), doxycycline hydrochloride (12.4 μM), N-acetyl-dl-tryptophan (12.6 μM), minocycline hydrochloride (14.4 μM), and melatonin (15.5 μM) (Fig. 2B). Dicyclomine and mephenytoin, another two group II drugs, never afforded >30% protection to cultured cells, making them poor candidates for a drug with in vivo activity.
The remaining five compounds are relegated to group III. They do not demonstrate significant neuroprotection, perhaps because they possess intrinsic toxicity (Fig. 2C). Gossypol acetic acid is a case in point. Though it is the single most potent inhibitor of cytochrome c release from purified mitochondria (Fig. 1), it is toxic to mutant-htt ST14A striatal cells. Consequently, it is classified as a group III drug. Being useless for in vivo therapy, it makes a good negative control in further experiments.
Among the 21 compounds found to inhibit cytochrome c release from isolated mitochondria, 16 (76%) are protective in a cellular model of cell death. This high rate of success vindicates our assumption that inhibitors of the molecular process are beneficial to cells in culture. Among these compounds, several were already known to protect against cell death. Dipyrone (a.k.a., metamizol) has an antiapoptotic effect on HL-60, Jurkat, and Raji cell lines under a variety of conditions know to induce apoptosis (Coimbra et al., 1996; Pompeia et al., 2001). Ritanserin, a specific antagonist of the 5-HT2 serotonin receptor, reduces ischemic damage during transient global ischemia (Globus et al., 1992). The antioxidant probucol reduces HgCl2 toxicity (Gassó et al., 2001). Doxycycline hydrochloride has documented neuroprotective potency (Yrjänheikki et al., 1998). Methazolamide and melatonin (N-acetyl-5-methoxytryptamine) have been reported to prevent cell death of SH-SY5Y neuroblastoma cells after oxidative damage (Sarang et al., 2002). Furthermore, minocycline is protective against various acute and chronic afflictions of the CNS. Minocycline reduces tissue damage after ischemia and traumatic brain injury, delays onset and extends survival in animal models of ALS and HD, and exhibits neuroprotective properties in experimental models of Parkinson disease and multiple sclerosis (Yrjänheikki et al., 1998; Chen et al., 2000; Sanchez Mejia et al., 2001; Brundula et al., 2002; Wu et al., 2002; Zhu et al., 2002; Friedlander, 2003; Wang et al., 2003). It is however of interest that a number of publications have failed to demonstrated neuroprotection mediated by minocycline (Diguet et al., 2003; Smith et al., 2003; NINDS NET-PD Investigators, 2006). However, on the balance, minocycline-mediated neuroprotection has been accomplished in a broad verity of models in a number of independent laboratories (Yrjänheikki et al., 1999; Chen et al., 2000; Sanchez Mejia et al., 2001; Brundula et al., 2002; Wu et al., 2002; Zhu et al., 2002; Friedlander, 2003; Hersch et al., 2003; Wang et al., 2003; Stack et al., 2006).
Inhibition of cytochrome c release and of caspase activation contribute to neuroprotection by methazolamide
To provide further proof of principle for the effectiveness of our screen, we chose methazolamide for additional in-depth evaluation. Methazolamide is tolerated by patients and effectively crosses the blood–brain barrier. Methazolamide is currently used as a diuretic in humans, being FDA approved for the treatment of glaucoma. At the molecular level, it is a noncompetitive inhibitor of carbonic anhydrase (CA). However, there are no reports of methazolamide being tested for its benefits to patients with neurodegenerative diseases. Investigation of mitochondrial cell death pathways, both caspase-dependent and independent, is a promising avenue of research, as they are of documented importance to neurodegeneration (Beal, 1999; Li et al., 2001; Yu et al., 2002; Zhu et al., 2002; Friedlander, 2003; Wang et al., 2003; Zhang et al., 2003; Chan, 2004). In particular, the release of cytochrome c and other apoptogenic factors from these organelles trigger sequential maturation of caspase-9 and caspase-3, as well as caspase-independent cell death events. Disruption of this cascade of molecular events should forestall cell death. These considerations motivated us to study the changes that methazolamide effect on mitochondrial physiology and caspase activation. Bolstering this reasoning is our previous observation that the neuroprotective property of minocycline results from its ability to inhibit these very molecular changes (Zhu et al., 2002; Wang et al., 2003; Zhang et al., 2003).
The mutant htt ST14A cell line is a useful system in which to pursue the above investigations. Because these conditionally immortalized striatal cells carry a gene for temperature-sensitive large T antigen of SV40 and another one encoding polyglutamine-expanded huntingtin, they undergo cell death upon transfer to the nonpermissive temperature of 37°C (Rigamonti et al., 2000; Wang et al., 2003). Cytochrome c localization was evaluated by immunocytochemistry using a fluorescence microscope and deconvolution software. Cells were colabeled with anticytochrome c (Fig. 3A, top, green) and a mitochondrial marker, MitoTracker (Fig. 3A, middle, red). Merged images demonstrate localization of cytochrome c immunoreactivity with mitochondria (Fig. 3A, bottom). Arrows indicate release of cytochrome c from the mitochondria into the cytoplasm as evidenced by a more diffuse staining pattern (Fig. 3A). Methazolamide inhibited cytochrome c release as evidenced by the preservation of punctate staining after temperature shift (Fig. 3A).
Figure 3.

Methazolamide inhibits the release of mitochondrial apoptogenic factors and forestalls the activation of caspase-9 and -3. A, Cell death is induced in mutant-htt striatal cells by shifting them to the nonpermissive temperature of 37°C in SDM. Test cell cultures contain 100 μM methazolamide, whereas controls are devoid of these drugs. After 5 h, the cells are stained with Mitotracker and then fixed and stained with antibodies to cytochrome c. Mitochondrial cytochrome c is demonstrated as having a punctate pattern that colocalizes with Mitotracker. Cells in which cytochrome c is released demonstrate a more diffuse and decreased intensity of cytochrome c staining (arrows). Methazolamide retains intensity and punctate characteristics of the cytochrome c staining (Scale bar, 5 μm). B, Mutant-htt striatal cells are treated with 100 μM methazolamide (or processed in the absence of methazolamide) for 18 h. Subsequently, they were extracted; either cytosolic components or whole cell lysates were obtained. The samples, each of which contains 50 μg of protein, were analyzed by Western blot using antibodies either to cytochrome c, Smac with cytosolic components, or to caspase-9, or caspase-3 with whole cell lysates. β-Actin was used as a loading control. This blot is representative of three independent experiments. Densitometry was performed to quantify the intensity of the bands from the three independent experiments (*p < 0.05). C, D, Mutant-htt striatal cells were treated with 100 μM methazolamide for 5 and 18 h and compared with untreated controls. Cells were lysed and their complement of caspase-9 and -3 activities were evaluated by a fluorogenic assay. The results are the mean ±SD of three independent experiments (*p < 0.05, **p < 0.001). Experimental controls include cells treated with neither a cell death stimulus nor a test drugs (white bars). Others receive a death stimulus but are again not treated with a test drug (black bars). In addition to these controls, there are measurements of cell death in the presence of methazolamide either with or without a death stimulus (gray bars).
In addition to cytochrome c, Smac/Diablo is a proapoptotic mitochondrial protein, and its release from the mitochondria into the cytosol results in inhibition of facilitating downstream caspase activation of inhibitor of apoptosis proteins (Du et al., 2000). Western blotting of cell homogenates reveals that cytoplasmic levels of cytochrome c and Smac/Diablo were elevated by the temperature shift, as is the concentrations of active caspase-3 and -9. Methazolamide inhibits the release of mitochondrial apoptogenic factors and the proteolysis of procaspases (Fig. 3A,B). In parallel studies, the activity of caspase-9 and -3 were measured by their hydrolysis of fluorogenic tetrapeptide substrates. Again, treatment of cells with methazolamide inhibited caspase activation (Fig. 3C,D). Together, these observations indicate that neuroprotection by methazolamide results, at least in part, from inhibition of mitochondrial-dependent pathways of cell death.
Methazolamide slows dissipation of the mitochondrial potential gradient
Methazolamide could confer cytoprotection by acting upstream of the mitochondria, at an early mitochondrial event or at a later mitochondrial event, such as induction of the mitochondrial permeability transition (mPT) or cytochrome c release. Because the initial screen that identified methazolamide was performed in isolated mitochondria, the most parsimonious interpretation is that it acts at a mitochondrial target. Dissipation of the electrostatic potential across the inner mitochondrial membrane is a critical step in the intrinsic apoptotic pathway. After the collapse of (ΔΨm, the organelle can undergo the mPT, releasing apoptogenic factors into the cytoplasm. The effects of methazolamide on (ΔΨm were addressed using Mitoprobe JC-1 and, independently, potentiometric dye rhodamine 123. As discussed below, we found a striking correlation between methazolamide treatment and the preservation of the potential difference across the inner mitochondrial membrane.
Dissipation of (ΔΨm was found to strongly correlate with increased cell death of mutant-htt ST14A striatal cells shifted to the nonpermissive temperature (Fig. 4A,B). Independent studies with Mitoprobe JC-1 (Fig. 4A) and Rh 123 (Fig. 4B) fluorescent stains both revealed that methazolamide inhibits the collapse of (ΔΨm. Drug treatment preserved red Mitoprobe JC-1 aggregates and punctate distribution of Rh 123 fluorescence in the presence of a cellular stress, the property that correlates with the ability of compounds to reduce the extent of cell death (Fig. 4A,B). In contrast, gossypoyl-acetic acid complex did not prevent the loss of (ΔΨm on the induction of cell death of mutant-htt ST14A striatal cells (Fig. 4B), despite its ability to inhibit cytochrome c release from purified mitochondria.
Figure 4.

Methazolamide slows the dissipation of (ΔΨm but does not inhibit mPT. A, B, In model of cell death, striatal cells were transferred to SDM and incubated for 5 or 18 h at the nonpermissive temperature. During these proapoptotic treatments, the culture medium was supplemented with methazolamide (test drugs) on the one hand, or with gossypol-acetic acid complex or no drug whatsoever (negative controls) on the other. The living cells were then stained with either 5 μg/ml Mitoprobe JC-1 to measure the collapse of the electrochemical gradient across the mitochondrial membrane (red JC-1 aggregates in healthy cells and green JC-1 monomers in apoptotic cells) (A) or 2 μM Rh 123 to determine the electrostatic charge of the mitochondria (B). C, Methazolamide was also investigated in an in vitro system of purified liver mitochondria that had been stimulated with Ca 2+ ions. Methazolamide did not prevent the induction of the mPT as assessed by a time course of mitochondrial swelling. The lack of such an effect upon addition of methazolamide to a solution of stimulated mitochondria is illustrated in C. The same is true of mitochondria stimulated in several ways (i.e., with Ca 2+ ions; Ca 2+ and tBH, PhAsO, or Ca 2+ and diamide). The dose–response curves to these stimuli is essentially unchanged when methazolamide is present at a range from 0.01 μM to 2 mM. In all cases, mitochondrial swelling is monitored by a standard spectroscopic assay using light of 540 nm. D, Liver mitochondria (0.25 mg/ml) were energized with 5 mM glutamate/malate and incubated with 1, 5, 10, and 20 μM methazolamide in buffer containing 250 mM sucrose, 10 mM Hepes, and 2 mM KH2PO4. Mitochondria were challenged with bolus additions of 5 μM Ca 2+ every 2 min until release of sequestered Ca 2+ occurred. Alameticin (100 μg) was added in the end of each sample. Top left panel is (ΔΨm, top right is in the buffer, bottom left is NADH level, and bottom right is swelling. See Materials and Methods for additional information.
Methazolamide is not an mPT inhibitor in isolated mitochondria
The mitochondrial permeability transition pore consists of a multimeric complex of proteins spanning the inner and outer membranes (Crompton et al., 1999; Zoratti et al., 2005). Its opening is a component of mitochondrial dysfunction, itself a result of such biochemical stresses as high concentrations of Ca2+ ion, oxidizing agents, thiol reactive compounds (i.e., reactive aldehyde), and proapoptotic cytosolic proteins (Stavrovskaya et al., 2004). The loss of (ΔΨm is an early event in the cell death pathway and an important trigger of the caspase cascade.
There is no satisfactory method for directly observing the mitochondrial permeability transition in living cells. Consequently, we investigated the effects of methazolamide on this molecular change in purified mitochondria. In these experiments, mPT was induced by Ca2+ ions, the oxidating agent organic hydroperoxide tBH, the thiol cross-linking agent PhAsO, the thiol oxidant diamide, or a combination thereof (Fig. 4C). Methazolamide did not protect purified mitochondria from these chemical challenges. These observations contrast with the analogous ones using (1) minocycline, a compound that blocks the loss of the mitochondrial membrane potential both in vitro and in vivo (Zhu et al., 2002; Wang et al., 2003), or (2) the heterocyclic, tricyclic, or phenothiazine-derived agents (Stavrovskaya et al., 2004). Because of its effects on purified mitochondria are dissimilar, methazolamide and minocycline probably benefit cultured cells via different mechanisms.
Neither inhibition of the mPT nor direct effects on mitochondrial physiology appear to underlie the protection imparted by methazolamide. Initial studies in isolated liver mitochondrial focused on monitoring swelling as a marker or mPT induction and tested the agents at a broad dose–response range. No effects were seen, suggesting that these agents do not interfere with mPT induction across a broad concentration range. Because work in other systems, such as cultured cerebellar granular neurons, had suggested that interference with mitochondrial physiology through uncoupling and respiratory inhibition could also appear protective, we examined the effects of methazolamide on basic physiological properties. Studies were done on a recently adapted fluorescence system (Baranov et al., 2008) that allows simultaneous measurement of membrane potential (by following TMRM fluorescence), Ca2+ flux (using Calcium Green 5N), NAD+/NADH redox status (using autofluorescence of the NAD+/NADH couple), and swelling (via light scatter). The system is an improved, fluorescence-based analog of the electrode-based system we have previously used and described (Stavrovskaya et al., 2004; Krasnikov et al., 2005). Methazolamide did not have any significant effects on (ΔΨm, calcium transport, NAD+/NADH redox status, or swelling (Fig. 4D). Methazolamide was associated with a slightly increased sensitivity to Ca2+ overload, but this would be expected to, if anything, slightly facilitate cell death, not to be protective. Thus, the data in Figure 4, C and D, suggest that methazolamide does not mediate its protective effect by acting upon basic mitochondrial physiology, including mitochondrial redox status and substrate, proton, electron, or Ca2+ transport. These data are most consistent with effects mediated outside the inner mitochondrial membrane/mitochondrial matrix, including potential targets such as bcl-2 family members (e.g., bax) and the elements involved in release of proapoptotic proteins. Studies are in progress to address these potential mechanisms.
Methazolamide delays disease onset and mortality in R6/2 mice, an animal model of chronic neurodegeneration
We proceeded to investigate the ability of methazolamide to slow chronic neurodegeneration. R6/2 mice were chosen as the animal model because they suffer neurodegeneration reminiscent of that in HD. The latter syndrome results from their expression of a human gene encoding the N-terminal portion of polyQ-expanded huntingtin protein (Mangiarini et al., 1996). Indeed, R6/2 mice are widely used for studying novel drug therapies for the human disease (Ona et al., 1999; Chen et al., 2000; Li et al., 2005; Stack et al., 2006). Beginning at 6 weeks of age, R6/2 mice received daily intraperitoneal injections of 20 or 40 mg/kg methazolamide. Control R6/2 mice were injected with saline vehicle. Body weight was monitored weekly. Both the test and control groups were comprised of equal numbers of males and females. In a dose-dependent manner, methazolamide treatment significantly delayed disease onset in R6/2 mice by 15 and 27% in the 20 and 40 mg/kg groups, respectively, when compared with saline-treated controls (Fig. 5A–C). In addition, methazolamide treatment significantly extended their lifespan by 11% (20 mg/kg) and 20% (40 mg/kg) (Fig. 5D). However, the time course of weight loss was not significantly altered (Fig. 5C). Marked neuroprotection at the tissue level was observed in methazolamide-treated R6/2 mice, as evidenced by reduced brain weight loss (Fig. 6A). Consistent with the attenuation of loss of brain weight, gross brain atrophy and bilateral ventricular hypertrophy present in saline treated R6/2 mice was significantly reduced in the methazolamide-treated mice (F(2,18) = 15.12, p < 0.01) (Fig. 6B). Parallel to these findings, methazolamide administration also significantly ameliorated the striatal neuronal atrophy present in the saline-treated R6/2 mice (WT littermate control, 136.8 ± 9.8 μm2; methazolamide-treated R6/2 mice, 105.7 ± 15.7 μm2; saline-treated R6/2 mice, 57.4 ± 21.6 μm2, (F(2,18) = 21.61, p < 0.01) (Fig. 6B). To demonstrate that methazolamide is targeting release of cytochrome c, we evaluated this event in vivo. As it did in mutant htt expressing cells, methazolamide significantly inhibited cytochrome c release in the treated R6/2 mice (Fig. 7A). In addition, because DARP is present in medium-sized striatal neurons, we performed an immunohistochemical analysis of DARP32-immunopositive neurons in the R6/2 mice. Compared with the saline-treated R6/2 mice, methazolamide markedly reduced the loss of DARP32 immunoreactive striatal neurons (Fig. 7B). In addition, although the early and progressive accumulation of huntingtin aggregates is a pathological hallmark in R6/2 mice, methazolamide treatment did not significantly reduce huntingtin-positive striatal aggregates in R6/2 mice (saline-treated R6/2 mice, 5.27 × 10⁶ ± 1.18; methazolamide-treated R6/2 mice, 5.06 × 10⁶ ± 1.04, (F(2,12) × 21.61, p < 0.22) (Fig. 7C). The finding of lack of effect of methazolamide treatment on huntingtin aggregates is similar to that observed with other neuroprotective strategies (Ona et al., 1999; Chen et al., 2000).
Figure 5.

Methazolamide delays the onset of neurodegeneration in R6/2 mice. A, B, Motor performance of R6/2 mice was evaluated by recording the time (up to 7 min) that they remained on a rotarod turning at 15 rpm (A) and 5 rpm (B). Mice were injected daily with 20 or 40 mg/kg methazolamide (or the saline vehicle) from 6 weeks of age. Measurements were made weekly beginning when the animals were 6 weeks old. p value is compared with saline-treated mice, for 20 mg/kg methazolamide, p < 0.05 in weeks 23, 25, and 27; for 40 mg/kg methazolamide, p <0.05 in weeks 22, 23, 25, and 26, p <0.001 in weeks 24, 27, and 28. C, The body weight of the above R6/2 mice was recorded on a weekly basis. D, The age (in days) at disease onset and at death is tabulated for both drug-treated and control animals. E, Cumulative probability of onset of rotarod deficit in R6/2 mice. F, Cumulative probability of survival in R6/2 mice. Behavior and disease progression data were generated from the same cohort of mice. p value is indicated compared with saline-treated mice (n =12 for the 20 mg/kg methazolamide-treated group; n =7 for the 40 mg/kg methazolamide-treated group; n =18 for saline-injected controls).
Figure 6.

Methazolamide improves the brain weight loss and prevents the ventricular hypertrophy in R6/2 mice. At 25 weeks, groups of saline-treated and methazolamide-treated R6/2 and littermate wild-type control mice are obtained. A, The loss of brain weight in the methazolamide-treated (40 mg/kg) was significantly improved, compared with the saline-treated R6/2 mice (n = 5 for wild-type control mice; n =4 for both saline-treated and methazolamide-treated R6/2 mice). Error bars represent SD. B, Both the gross brain atrophy, ventricular enlargement (left), and neuronal atrophy (right) present in saline-treated R6/2 mice was significantly reduced by methazolamide administration. Scale bars, 2 mm (for gross brain), 100 μm (for striatal neurons). Neuropathological data were compared by ANOVA or repeated measures of ANOVA and by nonpaired Student’s t test (Statview). *p <0.05. Data is representative from n =5 for wild-type control mice, n =4 for both saline-treated and methazolamide-treated R6/2 mice.
Figure 7.

Methazolamide prevents the release of cytochrome c and delays markers of disease progression in R6/2 mice. A, Lysates of brain tissue from 25-week-old mice were separated into cytosolic fractions. Protein samples were separated by SDS/PAGE, probed with a cytochrome c antibody, and reprobed with a β-actin antibody. Each lane is from a brain lysate from an individual mouse. The illustrated blot was generated from lysates from three mice per group. Cytochrome c release was evaluated from two independent trials in total from seven wild-type mice, six saline-treated R6/2 mice, and six methazolamide-treated R6/2 mice. Densitometry was performed to quantify each lane to allow the signals from cytochrome c to be compared with that from β-actin (n = 7 for wild-type control mice, n = 6 for both saline-treated and methazolamide-treated R6/2 mice). Statistical significance was evaluated by t test. *p <0.05, **p <0.001. B, DARP-32 immunoreactivity in striatal neurons in neostriatum. Compared with both wild-type littermate control mice and methazolamide-treated R6/2 mice, there was a marked reduction in the number of intensely immunostained DARP32 neurons in saline-treated R6/2 mice. C, Huntingtin immunoreactivity in methazolamide-treated R6/2 mice. Huntingtin immunostained tissue sections from the neostriatum in untreated and methazolamide-treated R6/2 transgenic mice. The number and size of huntingtin aggregates, as well as intensity of immunostaining, is not significantly different in methazolamide-treated mice. Scale bar, 100 μm. For B and C, data are representative from n =5 for wild-type control mice, n =4 for both saline-treated and methazolamide-treated R6/2 mice.
Discussion
Because the release of cytochrome c from mitochondria triggers caspase activation, blocking this critical step should interfere with the cell death program thereby rescue dying neurons. Release of cytochrome c and activation of downstream cell death pathways have been clearly identified in vivo in a broad number of acute (i.e., ischemia, spinal cord injury, and traumatic brain injury) and chronic (i.e., ALS and Huntington’s disease) neurodegenerative diseases. However, evidence clearly demonstrating the functional role of cytochrome c release in neurologic disease models is limited. Although minocycline inhibits cytochrome c release and it is neuroprotective, it may be other functions that may explain its protective function. What is needed to provide further support for the functional role of cytochrome c release in HD and other neurodegenerative diseases is to identify new inhibitors of cytochrome c release. With this goal in mind, we developed a cell-free screening assay to identify inhibitors of mitochondrial cytochrome c release. Purified mitochondria exposed to Ca2+ ions provide the requisite in vitro system. Released cytochrome c (i.e., that which remains in the supernatant once the organelles have been removed by centrifugation) can easily be detected by ELISA. Those compounds that reduce the resulting signal are promising candidates for neuroprotective drugs. Compounds from the resulting “short list” were then assayed for their ability to rescue cultured cells challenged with a cell death stimuli, incubation at the nonpermissive temperature. Drugs/compounds that are protective in these cellular systems are further evaluated in trials on animal models. Ultimately, biologically safe and potentially curative agents can be tested on humans afflicted by chronic neurodegenerative diseases such as HD. Minocycline and doxycycline, two compounds known a priori to slow neurodegeneration (Yrjänheikki et al., 1998; Chen et al., 2000; Brundula et al., 2002; Wu et al., 2002; Zhu et al., 2002; Friedlander, 2003; Wang et al., 2003), are particularly effective at inhibiting the release of cytochrome c from purified mitochondria. These observations are reassuring, as they suggest that the in vitro assay has predictive value. However, a positive result in the isolated mitochondrial screen does not, itself, give definitive indication of eventual efficacy or safety of an agent. Gossypol could be an example of a “false” positive agent. Gossypol is a well known respiratory poison (uncoupler), considering a strong mitochondrial respiratory toxin will score positive as an inhibitor of any event which requires an active proton gradient, such as calcium transport, it is reasonable to account for our observation that gossypol is effective in the isolated mitochondrial screen (rank in first) but toxic in intact cells (cellular screen) (Floridi et al., 1984).
Because different screening campaigns and different model systems may yield different hit compounds, until now, no single powerful and validated model exists for Huntington’s or other neurodegenerative diseases. Using our three-tiered selection process (an assay for activity in a cell-free system, observation of effects on cultured cells, and finally trials in animal models) we successively narrowed the list of potentially therapeutic compounds. Of the 21 compounds selected in the initial screen, 16 proved protective of cells in culture. Our study thus provides proof of principle that the screen for inhibitors of cytochrome c release from purified mitochondria is a useful technique for identifying drugs with the potential to slow neurodegeneration.
Furthermore, our observations constitute the first report of the ability of methazolamide to benefit R6/2 mice. CA is a zinc-containing enzyme that catalyzes the reversible hydration of carbon dioxide: CO2+ H2O<–>HCO3(−)+H+. There are seven mammalian CA isozymes, CA I-VII. Thus far, the mechanism of action of methazolamide consists in inhibition of target CA isozymes, with the reduction of bicarbonate, and profound effect on pH. Furthermore, methazolamide has been reported to be an effective inhibitor of human CA II (hCA II) and mitochondrial hCA V. Considering methazolamide inhibits cytochrome c/Smac/apoptosis-inducing factor release and slows the dissipation of the mitochondrial potential gradient in this study, we hypothesize that mitochondrial hCA V may involve in the neuroprotection by methazolamide in mutant-htt ST14A living cells and in R6/2 transgenic mice. However, methazolamide may act independent of CA isozymes, it may act on other targets in cellular and/or animal model of HD, such as the NADH oxidase, or inhibit neuronal cell death with involvement of reactive oxygen species. In light of the fact that methazolamide in current clinical usage as chronic therapy for patients with glaucoma, although it is a weak diuretic, should not have prohibitive side effects if used in trials on humans. It is our hope that methazolamide will also be of clinical value for the treatment of persons afflicted by neurodegenerative diseases.
Together, these experiments have demonstrated that methazolamide is protective in an animal model of chronic neurodegeneration. The conclusions reached above pertain to this drug in particular. The study has broader significance, however. It demonstrates that the in vitro assay for cytochrome c release from Ca2+-stimulated mitochondria can be used to screen for potentially therapeutic compounds and provides further in vivo evidence for the importance of cytochrome c release in the process of neurodegeneration. At the physiological level, it validates targeting that molecular process as a rational approach to designing therapies for chronic neurological diseases such as HD.
Supplementary Material
Acknowledgments
This work was supported by grants from the National Institutes of Health–National Institute of Neurological Disorders and Stroke (R.M.F., X.W., R.J.F.), the Huntington’s Disease Society of America (R.M.F.), the Hereditary Disease Foundation (X.W., B.S.K.), New York State Center of Research Excellence (I.G.S., B.S.K.), and the Veterans Administration (R.J.F.). We thank Ugo Giambarella and Karen Smith for experimental assistance, Stan Young, Jun Feng, and Lijuan Mao for help with structure analysis of compounds, and Hongying Wang for statistical assistance.
References
- Aiken CT, Tobin AJ, Schweitzer ES. A cell-based screen for drugs to treat Huntington’s disease. Neurobiol Dis. 2004;16:546–555. doi: 10.1016/j.nbd.2004.04.001. [DOI] [PubMed] [Google Scholar]
- Alano CC, Kauppinen TM, Valls AV, Swanson RA. Minocycline inhibits poly(ADP-ribose) polymerase-1 at nanomolar concentrations. Proc Natl Acad Sci U S A. 2006;103:9685–9690. doi: 10.1073/pnas.0600554103. [DOI] [PMC free article] [PubMed] [Google Scholar]
- Baranov SV, Stavrovskaya IG, Brown AM, Tyryshkin AM, Kristal BS. Kinetic model for Ca2×-induced permeability transition in energized liver mitochondria discriminates between inhibitor mechanisms. J Biol Chem. 2008;283:665–676. doi: 10.1074/jbc.M703484200. [DOI] [PubMed] [Google Scholar]
- Beal MF. Mitochondria, NO and neurodegeneration. Biochem Soc Symp. 1999;66:43–54. doi: 10.1042/bss0660043. [DOI] [PubMed] [Google Scholar]
- Bernardi P, Scorrano L, Colonna R, Petronilli V, Di Lisa F. Mitochondria and cell death. Mechanistic aspects and methodological issues. Eur J Biochem. 1999;264:687–701. doi: 10.1046/j.1432-1327.1999.00725.x. [DOI] [PubMed] [Google Scholar]
- Brundula V, Rewcastle NB, Metz LM, Bernard CC, Yong VW. Targeting leukocyte MMPs and transmigration: minocycline as a potential therapy for multiple sclerosis. Brain. 2002;125:1297–1308. doi: 10.1093/brain/awf133. [DOI] [PubMed] [Google Scholar]
- Chan PH. Mitochondria and neuronal death/survival signaling pathways in cerebral ischemia. Neurochem Res. 2004;29:1943–1949. doi: 10.1007/s11064-004-6869-x. [DOI] [PubMed] [Google Scholar]
- Chen M, Ona VO, Li M, Ferrante RJ, Fink KB, Zhu S, Bian J, Guo L, Farrell LA, Hersch SM, Hobbs W, Vonsattel JP, Cha JH, Friedlander RM. Minocycline inhibits caspase-1 and caspase-3 expression and delays mortality in a transgenic mouse model of Huntington disease. Nat Med. 2000;6:797–801. doi: 10.1038/77528. [DOI] [PubMed] [Google Scholar]
- Coimbra C, Drake M, Boris-Möller F, Wieloch T. Long-lasting neuroprotective effect of postischemic hypothermia and treatment with an anti-inflammatory/antipyretic drug. Evidence for chronic encephalopathic processes following ischemia. Stroke. 1996;27:1578–1585. doi: 10.1161/01.str.27.9.1578. [DOI] [PubMed] [Google Scholar]
- Crompton M, Virji S, Doyle V, Johnson N, Ward JM. The mitochondrial permeability transition pore. Biochem Soc Symp. 1999;66:167–179. doi: 10.1042/bss0660167. [DOI] [PubMed] [Google Scholar]
- Diguet E, Rouland R, Tison F. Minocycline is not beneficial in a phenotypic mouse model of Huntington’s disease. Ann Neurol. 2003;54:841–842. doi: 10.1002/ana.10818. [DOI] [PubMed] [Google Scholar]
- Du C, Fang M, Li Y, Li L, Wang X. Smac, a mitochondrial protein that promotes cytochrome c-dependent caspase activation by eliminating IAP inhibition. Cell. 2000;102:33–42. doi: 10.1016/s0092-8674(00)00008-8. [DOI] [PubMed] [Google Scholar]
- Floridi A, D’Atri S, Bellocci M, Marcante ML, Paggi MG, Silvestrini B, Caputo A, De Martino C. The effect of gossypol and Lonidamine on electron transport in Ehrlich ascites tumor mitochondria. Exp Mol Pathol. 1984;40:246–261. doi: 10.1016/0014-4800(84)90081-9. [DOI] [PubMed] [Google Scholar]
- Friedlander RM. Apoptosis and caspases in neurodegenerative diseases. N Engl J Med. 2003;348:1365–1375. doi: 10.1056/NEJMra022366. [DOI] [PubMed] [Google Scholar]
- GassóS Cristòfol RM, Selema G, Rosa R, Rodríguez-Farré E, Sanfeliu C. Antioxidant compounds and Ca(2+) pathway blockers differentially protect against methylmercury and mercuric chloride neurotoxicity. J Neurosci Res. 2001;66:135–145. doi: 10.1002/jnr.1205. [DOI] [PubMed] [Google Scholar]
- Globus MY, Wester P, Busto R, Dietrich WD. Ischemia-induced extracellular release of serotonin plays a role in CA1 neuronal cell death in rats. Stroke. 1992;23:1595–1601. doi: 10.1161/01.str.23.11.1595. [DOI] [PubMed] [Google Scholar]
- Hengartner MO. The biochemistry of apoptosis. Nature. 2000;407:770–776. doi: 10.1038/35037710. [DOI] [PubMed] [Google Scholar]
- Hersch S, Fink K, Vonsattel JP, Friedlander RM. Minocycline is protective in a mouse model of Huntington’s disease. Ann Neurol. 2003;54:841. doi: 10.1002/ana.21891. author reply 842–843. [DOI] [PubMed] [Google Scholar]
- Krasnikov BF, Zorov DB, Antonenko YN, Zaspa AA, Kulikov IV, Kristal BS, Cooper AJ, Brown AM. Comparative kinetic analysis reveals that inducer-specific ion release precedes the mitochondrial permeability transition. Biochim Biophys Acta. 2005;1708:375–392. doi: 10.1016/j.bbabio.2005.05.009. [DOI] [PubMed] [Google Scholar]
- Li JY, Popovic N, Brundin P. The use of the R6 transgenic mouse models of Huntington’s disease in attempts to develop novel therapeutic strategies. NeuroRx. 2005;2:447–464. doi: 10.1602/neurorx.2.3.447. [DOI] [PMC free article] [PubMed] [Google Scholar]
- Li LY, Luo X, Wang X. Endonuclease G is an apoptotic DNase when released from mitochondria. Nature. 2001;412:95–99. doi: 10.1038/35083620. [DOI] [PubMed] [Google Scholar]
- Li P, Nijhawan D, Budihardjo I, Srinivasula SM, Ahmad M, Alnemri ES, Wang X. Cytochrome c and dATP-dependent formation of Apaf-1/caspase-9 complex initiates an apoptotic protease cascade. Cell. 1997;91:479–489. doi: 10.1016/s0092-8674(00)80434-1. [DOI] [PubMed] [Google Scholar]
- Mangiarini L, Sathasivam K, Seller M, Cozens B, Harper A, Hetherington C, Lawton M, Trottier Y, Lehrach H, Davies SW, Bates GP. Exon 1 of the HD gene with an expanded CAG repeat is sufficient to cause a progressive neurological phenotype in transgenic mice. Cell. 1996;87:493–506. doi: 10.1016/s0092-8674(00)81369-0. [DOI] [PubMed] [Google Scholar]
- NINDS NET-PD Investigators. A randomized, double-blind, futility clinical trial of creatine and minocycline in early Parkinson disease. Neurology. 2006;66:664–671. doi: 10.1212/01.wnl.0000201252.57661.e1. [DOI] [PubMed] [Google Scholar]
- Ona VO, Li M, Vonsattel JP, Andrews LJ, Khan SQ, Chung WM, Frey AS, Menon AS, Li XJ, Stieg PE, Yuan J, Penney JB, Young AB, Cha JH, Friedlander RM. Inhibition of caspase-1 slows disease progression in a mouse model of Huntington’s disease. Nature. 1999;399:263–267. doi: 10.1038/20446. [DOI] [PubMed] [Google Scholar]
- Pompeia C, Boaventura MF, Curi R. Antiapoptotic effect of dipyrone on HL-60, Jurkat and Raji cell lines submitted to UV irradiation, arachidonic acid and cycloheximide treatments. Int Immunopharmacol. 2001;1:2173–2182. doi: 10.1016/s1567-5769(01)00144-8. [DOI] [PubMed] [Google Scholar]
- Rigamonti D, Bauer JH, De-Fraja C, Conti L, Sipione S, Sciorati C, Clementi E, Hackam A, Hayden MR, Li Y, Cooper JK, Ross CA, Govoni S, Vincenz C, Cattaneo E. Wild-type huntingtin protects from apoptosis upstream of caspase-3. J Neurosci. 2000;20:3705–3713. doi: 10.1523/JNEUROSCI.20-10-03705.2000. [DOI] [PMC free article] [PubMed] [Google Scholar]
- Rigamonti D, Sipione S, Goffredo D, Zuccato C, Fossale E, Cattaneo E. Huntingtin’s neuroprotective activity occurs via inhibition of procaspase-9 processing. J Biol Chem. 2001;276:14545–14548. doi: 10.1074/jbc.C100044200. [DOI] [PubMed] [Google Scholar]
- Rothstein JD, Patel S, Regan MR, Haenggeli C, Huang YH, Bergles DE, Jin L, Dykes Hoberg M, Vidensky S, Chung DS, Toan SV, Bruijn LI, Su ZZ, Gupta P, Fisher PB. Beta-lactam antibiotics offer neuroprotection by increasing glutamate transporter expression. Nature. 2005;433:73–77. doi: 10.1038/nature03180. [DOI] [PubMed] [Google Scholar]
- Sanchez Mejia RO, Ona VO, Li M, Friedlander RM. Minocycline reduces traumatic brain injury-mediated caspase-1 activation, tissue damage, and neurological dysfunction. Neurosurgery. 2001;48:1393–1399. doi: 10.1097/00006123-200106000-00051. discussion 1399–1401. [DOI] [PubMed] [Google Scholar]
- Sarang SS, Yoshida T, Cadet R, Valeras AS, Jensen RV, Gullans SR. Discovery of molecular mechanisms of neuroprotection using cell-based bioassays and oligonucleotide arrays. Physiol Genomics. 2002;11:45–52. doi: 10.1152/physiolgenomics.00064.2002. [DOI] [PubMed] [Google Scholar]
- Smith DL, Woodman B, Mahal A, Sathasivam K, Ghazi-Noori S, Lowden PA, Bates GP, Hockly E. Minocycline and doxycycline are not beneficial in a model of Huntington’s disease. Ann Neurol. 2003;54:186–196. doi: 10.1002/ana.10614. [DOI] [PubMed] [Google Scholar]
- Stack EC, Smith KM, Ryu H, Cormier K, Chen M, Hagerty SW, Del Signore SJ, Cudkowicz ME, Friedlander RM, Ferrante RJ. Combination therapy using minocycline and coenzyme Q10 in R6/2 transgenic Huntington’s disease mice. Biochim Biophys Acta. 2006;1762:373–380. doi: 10.1016/j.bbadis.2005.11.002. [DOI] [PubMed] [Google Scholar]
- Stavrovskaya IG, Narayanan MV, Zhang W, Krasnikov BF, Heemskerk J, Young SS, Blass JP, Brown AM, Beal MF, Friedlander RM, Kristal BS. Clinically approved heterocyclics act on a mitochondrial target and reduce stroke-induced pathology. J Exp Med. 2004;200:211–222. doi: 10.1084/jem.20032053. [DOI] [PMC free article] [PubMed] [Google Scholar]
- Tikka T, Fiebich BL, Goldsteins G, Keinanen R, Koistinaho J. Minocycline, a tetracycline derivative, is neuroprotective against excitotoxicity by inhibiting activation and proliferation of microglia. J Neurosci. 2001;21:2580–2588. doi: 10.1523/JNEUROSCI.21-08-02580.2001. [DOI] [PMC free article] [PubMed] [Google Scholar]
- Wang W, Duan W, Igarashi S, Morita H, Nakamura M, Ross CA. Compounds blocking mutant huntingtin toxicity identified using a Huntington’s disease neuronal cell model. Neurobiol Dis. 2005;20:500–508. doi: 10.1016/j.nbd.2005.03.026. [DOI] [PubMed] [Google Scholar]
- Wang X, Zhu S, Drozda M, Zhang W, Stavrovskaya IG, Cattaneo E, Ferrante RJ, Kristal BS, Friedlander RM. Minocycline inhibits caspase-independent and -dependent mitochondrial cell death pathways in models of Huntington’s disease. Proc Natl Acad Sci U S A. 2003;100:10483–10487. doi: 10.1073/pnas.1832501100. [DOI] [PMC free article] [PubMed] [Google Scholar]
- Wang X, Brégégère F, Soroka Y, Frusic-Zlotkin M, Milner Y. Replicative senescence enhances apoptosis induced by pemphigus autoimmune antibodies in human keratinocytes. FEBS Lett. 2004a;567:281–286. doi: 10.1016/j.febslet.2004.04.083. [DOI] [PubMed] [Google Scholar]
- Wang X, Brégégère F, Frusiæ-Zlotkin M, Feinmesser M, Michel B, Milner Y. Possible apoptotic mechanism in epidermal cell acantholysis induced by pemphigus vulgaris autoimmunoglobulins. Apoptosis. 2004b;9:131–143. doi: 10.1023/B:APPT.0000018795.05766.1f. [DOI] [PubMed] [Google Scholar]
- Wang X, Wang H, Figueroa BE, Zhang WH, Huo C, Guan Y, Zhang Y, Bruey JM, Reed JC, Friedlander RM. Dysregulation of receptor interacting protein-2 and caspase recruitment domain only protein mediates aberrant caspase-1 activation in Huntington’s disease. J Neurosci. 2005;25:11645–11654. doi: 10.1523/JNEUROSCI.4181-05.2005. [DOI] [PMC free article] [PubMed] [Google Scholar]
- Wang X, Narayanan M, Bruey JM, Rigamonti D, Cattaneo E, Reed JC, Friedlander RM. Protective role of Cop in Rip2/caspase-1/caspase-4-mediated HeLa cell death. Biochim Biophys Acta. 2006;1762:742–754. doi: 10.1016/j.bbadis.2006.06.015. [DOI] [PubMed] [Google Scholar]
- Wu DC, Jackson-Lewis V, Vila M, Tieu K, Teismann P, Vadseth C, Choi DK, Ischiropoulos H, Przedborski S. Blockade of microglial activation is neuroprotective in the 1-methyl-4-phenyl-1,2,3,6-tetrahydropyridine mouse model of Parkinson disease. J Neurosci. 2002;22:1763–1771. doi: 10.1523/JNEUROSCI.22-05-01763.2002. [DOI] [PMC free article] [PubMed] [Google Scholar]
- Yrjänheikki J, Keinänen R, Pellikka M, Hökfelt T, Koistinaho J. Tetracyclines inhibit microglial activation and are neuroprotective in global brain ischemia. Proc Natl Acad Sci U S A. 1998;95:15769–15774. doi: 10.1073/pnas.95.26.15769. [DOI] [PMC free article] [PubMed] [Google Scholar]
- Yrjänheikki J, Tikka T, Keinänen R, Goldsteins G, Chan PH, Koistinaho J. A tetracycline derivative, minocycline, reduces inflammation and protects against focal cerebral ischemia with a wide therapeutic window. Proc Natl Acad Sci U S A. 1999;96:13496–13500. doi: 10.1073/pnas.96.23.13496. [DOI] [PMC free article] [PubMed] [Google Scholar]
- Yu SW, Wang H, Poitras MF, Coombs C, Bowers WJ, Federoff HJ, Poirier GG, Dawson TM, Dawson VL. Mediation of poly(ADP-ribose) polymerase-1-dependent cell death by apoptosis-inducing factor. Science. 2002;297:259–263. doi: 10.1126/science.1072221. [DOI] [PubMed] [Google Scholar]
- Zhang WH, Wang X, Narayanan M, Zhang Y, Huo C, Reed JC, Friedlander RM. Fundamental role of the Rip2/caspase-1 pathway in hypoxia and ischemia-induced neuronal cell death. Proc Natl Acad Sci U S A. 2003;100:16012–16017. doi: 10.1073/pnas.2534856100. [DOI] [PMC free article] [PubMed] [Google Scholar]
- Zhu S, Stavrovskaya IG, Drozda M, Kim BY, Ona V, Li M, Sarang S, Liu AS, Hartley DM, Wu DC, Gullans S, Ferrante RJ, Przedborski S, Kristal BS, Friedlander RM. Minocycline inhibits cytochrome c release and delays progression of amyotrophic lateral sclerosis in mice. Nature. 2002;417:74–78. doi: 10.1038/417074a. [DOI] [PubMed] [Google Scholar]
- Zoratti M, Szabò I, De Marchi U. Mitochondrial permeability transitions: how many doors to the house? Biochim Biophys Acta. 2005;1706:40–52. doi: 10.1016/j.bbabio.2004.10.006. [DOI] [PubMed] [Google Scholar]
- Zou H, Henzel WJ, Liu X, Lutschg A, Wang X. Apaf-1, a human protein homologous to C. elegans CED-4, participates in cytochrome c-dependent activation of caspase-3. Cell. 1997;90:405–413. doi: 10.1016/s0092-8674(00)80501-2. [DOI] [PubMed] [Google Scholar]
Associated Data
This section collects any data citations, data availability statements, or supplementary materials included in this article.