

Abstract
Background
The inflammatory chemokine, interferon-gamma inducible protein of 10 kDa (IP-10), is a biomarker associated with several conditions.
Objectives
This study investigated serum concentrations of IP-10 in healthy individuals who developed acute respiratory infection (ARI). The hypothesis is that serum IP-10 concentrations correlate with ARI severity and detection of viral pathogens.
Study design
Data come from a randomized controlled trial measuring the effects of mindfulness meditation or exercise on ARI (Clinical Trials ID: NCT01654289). Healthy adults ages 30–69 were followed for a single season for ARI incidence and severity. This trial is ongoing, and the investigators are still blinded. When a participant reported ARI symptoms, nasal swab and lavage for PCR-based viral identification and blood samples were collected within the first 72 hours of ARI symptoms. Serum IP-10 concentrations were measured by ELISA (R&D Systems, Inc. Quantikine ELISA, Minneapolis, MN). ARI severity was measured using the validated Wisconsin Upper Respiratory Symptom Survey (WURSS-24) until the ARI episode resolved.
RESULTS
Serum IP-10 concentrations from 225 ARI episodes correlated with ARI global severity (rho 0.28 [95% CI: 0.15–0.39]; p<0.001). IP-10 concentrations were higher with an ARI in which a viral pathogen was detected compared to no viral pathogen detected (median 366 pg/ml [IQR: 227–486] vs 163 pg/ml [IQR: 127–295], p<0.0001). Influenza infections had higher IP-10 concentrations than coronavirus, enterovirus or rhinovirus, and paramyxovirus.
CONCLUSION
Serum IP-10 concentration correlates with ARI global severity. Also, IP-10 concentration measured early in the course of the ARI correlates with the daily severity, duration, and illness symptoms.
Keywords: IP-10, acute respiratory infection, viral pathogens, healthy adults, biomarker
Background
The inflammatory chemokine interferon-gamma inducible protein of 10 kDa (IP-10), also known as C-X-C motif chemokine ligand 10 (CXCL10), is a biomarker associated with obesity, insulin resistance, atherosclerosis, paraneoplastic neurologic disorders, and infections. [1–6] This ligand of chemokine C-X-C motif receptor 3 (CXCR3) found on T lymphocytes (Th1), natural killer (NK) cells and eosinophils is encoded by the CXCL10 gene on chromosome 4 at band q21, and is secreted by monocytes, endothelial cells, adipose tissue, and fibroblasts.[4, 7–10] IP-10 plays a role in angiogenesis inhibition, cell chemotaxis, regulation of cell growth and proliferation, and apoptosis. [11–15] Infections associated with IP-10 include those caused by parasites, viruses, bacteria and fungi. [3] IP-10 production is associated with both protection from and facilitation of infection. Recent reports have indicated increased levels of IP-10 occur with acute respiratory infections (ARIs) and suggest a biomarker role for IP-10. [16–19]
Objectives
The present study investigated serum concentrations of IP-10 in otherwise healthy patients who developed ARIs in order to further ascertain a link between ARI and IP-10 concentrations. The development of a biomarker for virally-mediated ARIs could potentially lead to a methodology to point to infection etiology and severity in order to formulate a treatment plan. Based on previous studies, the hypothesis is that serum IP-10 concentrations correlate with ARI severity and durations in otherwise healthy individuals. Also, we considered that the detection of virus in nasal specimens would be associated with IP-10 concentration obtained early in the ARI course. This could potentially be helpful, as there are few if any clinically useful markers of mild to moderate severity acute respiratory infection.
Study design
Participants
Data come from a randomized controlled trial measuring the effects of mindfulness meditation or exercise on the incidence and severity of ARI (Clinical Trials ID: NCT01654289). Study participants were community-recruited adults ages 30–69, who were generally healthy and who reported getting at least one cold per year. Three cohorts of 99, 105, and 104 healthy individuals who gave written informed consent over three seasons were enrolled in August and September and were followed until May. The trial is ongoing, and the investigators are still blinded. IP-10 concentrations used in this analysis were measured at study entry before randomization of intervention occurred and within the first 72 hours following onset of ARI. It is still unknown if or how the meditation or exercise interventions could influence IP-10 measurements. The study protocol was approved by the University of Wisconsin-Madison Institutional Review Board for Human Subjects Research.
Viral identification and IP-10 concentrations
Each participant had blood drawn at study entry. When a participant reported ARI symptoms equaling 2 or greater on the Jackson scale, samples were collected within the first 72 hours of onset of symptoms. Blood samples were collected using standard venipuncture techniques, and the serum was frozen at −80°C. IP-10 concentrations were measured in picograms per milliliter (pg/mL) using ELISA, according to manufacturer’s protocol (R and D Systems, Minneapolis, MN). The assay range is 7.8–500 pg/ml, and samples with concentrations greater than the highest standard were diluted as directed by the manufacturer’s protocol and remeasured. At the time that the participant contacted the study coordinators to report an ARI, the participant performed a nasal self-swab. A nasal lavage was done at the time of the blood draw. Multiplex PCR was were used to detect and identify respiratory viruses in nasal swab and wash samples. Over 100 rhinovirus serotypes, as well as serotypes of influenza, parainfluenza, coronavirus, respiratory syncytial virus, adenovirus, enterovirus, and metapneumovirus can be identified. Overall sensitivity is estimated at 94%, with 99% specificity. [20] Viruses detected in either nasal swab or lavage were considered positive. Viruses were grouped by type for analysis: adenovirus and bocavirus, coronaviruses, enterovirus and rhinovirus, influenza viruses, paramyxoviruses (metapneumovirus, parainfluenza viruses, and respiratory syncytial viruses).
ARI definition and monitoring
After providing written informed consent, participants were contacted every week using a web-based surveillance system to prompt self-reported ARI episodes. The Jackson criteria were used to define the beginning of an ARI episode; three criteria had to be met: 1) Answer “Yes” to either “Do you think you have a cold?” or “Do you think you are coming down with a cold?;” 2) Report at least one of four cold symptoms: Nasal discharge, nasal obstruction, sneezing, or sore throat; AND 3) Score at least two points on the Jackson scale. The Jackson score is calculated by summing scores for eight symptoms: sneezing, headache, malaise, chilliness, nasal discharge, nasal obstruction, sore throat and cough. Each symptom is rated 0, 1, 2, or 3; from absent to severe.[21] Data about symptom severity and quality of life impact were collected daily using the validated Wisconsin Upper Respiratory Symptom Survey (WURSS-24) until the ARI episode resolved.[22, 23] The daily severity score is calculated by adding the WURSS items for that day. To calculate area under the curve (WURSS AUC) for ARI global severity, the sum of WURSS totals across all daily time points of the illness episode was used, and trapezoidal approximation was then applied.[24, 25] WURSS can be divided into three categories of symptoms: nasal, throat, and quality of life (QoL) symptoms. [25, 26]
To assess the relationship between the ARI illness outcomes and IP-10, Spearman correlations were computed. Fisher’s z transformation was used to compute 95% confident intervals (CI) around the correlations. Wilcoxon scores were computed and used in the Kruskal-Wallis test to compare continuous variables by groupings (e.g. ARI global severity between participants with corresponding IP-10 measurements versus those without IP-10 measurements at time of ARI). Generalized linear regression modeling techniques were used to assess the relationship between ARI outcomes and IP-10 after adjusting for baseline covariates (age, sex, and body mass index (BMI)); repeated measures modeling was used to account for the correlation between observations within a participant for those who had more than one ARI. Generalized linear regression modeling techniques with repeated measures correlations were also used to compute LSMeans comparisons between the viral infection categories using the Tukey adjustment for multiple comparisons. ARI global severity, ARI duration, and IP-10 are highly skewed measurements; we transformed these measurements on the log base10 scale before running the regression models. Observed measurements for these data are presented as medians and interquartile ranges (IQR). For the change from baseline models with log base 10 transformed outcome variables, change was calculated as log10(ARI at later time point / ARI at baseline). The beta can be interpreted as a percentage change in the outcome (e.g. ARI global severity) for every unit increase in the predictor variable (e.g. IP-10). All statistical analyses were run using SAS 9.3.
Results
Of the 308 individuals enrolled in the study, 181 participants experienced 284 ARI episodes. We were unable to measure IP-10 levels during 59 of the ARI episodes due to challenges getting samples within 72 hours of onset of symptoms, as required by protocol (Figure 1). Thus, we were able to collect serum samples for IP-10 concentration during 225 ARI episodes that occurred in 157 individuals (Table 1). Characteristics of these 225 ARI episodes with corresponding IP-10 collection can be also be found in Table 1. There were no statistically significant differences in ARI global severity or ARI duration between the ARI episodes where IP-10 was collected as compared to the ARI episodes where IP-10 was not collected. In addition, we were unable to collect IP-10 on the same day as the WURSS symptom scores for five ARIs (n=220 for same day symptom level analyses).
Figure 1.

Consort Diagram
Table 1.
Demographics and ARI Characteristics
| Number of Participants with ARI | 157 |
| Total Number of ARIs with data | 225 |
| Number of ARIs (per participant), median [IQR] | 1 [1–2] |
| ARI Duration (days), median [IQR] | 6.4 [4.3–10.5] |
| ARI Global Severity (WURSS AUC), median [IQR] | 171.5 [85.5–356.5] |
| ARI Daily Severity, median [IQR] | 44 [22–64] |
| Nasal Symptoms, median [IQR] | 7 [3–12] |
| Throat Symptoms, median [IQR] | 5 [2–10] |
| QoL Symptoms, median [IQR] | 8 [3–11.5] |
| IP-10 at Baseline (pg/ml), median [IQR] | 152 [119–195] |
| IP-10 at Time of ARI (pg/ml), median [IQR] | 295 [172–433] |
| Age (years), mean (SD) | 48.1 (11.5) |
| BMI (kg/m2), mean (SD) | 29.4 (7.8) |
| Male, sex, n (%) | 35 (22%) |
| Smoking History, n (%) | |
| Never Smoked | 114 (73%) |
| Past Smoker | 38 (24%) |
| Current Smoker | 5 (3%) |
| Race, n (%) | |
| Black/African American | 6 (4%) |
| White/Caucasian | 139 (89%) |
| Asian | 3 (2%) |
| Mixed Race | 7 (4%) |
| Other | 1 (1%) |
| Education, n (%) | |
| Through high school grad/GED | 3 (2%) |
| Some college/technical school | 30 (19%) |
| College graduate | 190 (85%) |
| Employment, n (%) | |
| Full-time | 98 (62%) |
| Part-time | 32 (20%) |
| Unemployed | 10 (6%) |
| Student | 3 (2%) |
| Retired | 14 (9%) |
| Seattle Index of Comorbidity, mean (SD) | 2.3 (2.3) |
| SF12 Physical Composite Score, mean (SD) | 50.7 (9.3) |
| SF12 Mental Composite Score, mean (SD) | 49.4 (9.3) |
ARI=acute respiratory infection, QoL=quality of life, IQR=interquartile range, SD=standard deviation
Serum IP-10 at baseline correlates with age (rho=0.31 [95% confidence interval (95% CI): 0.160.44] p<0.0001) and BMI (rho=0.37 [95% CI: 0.22–0.49]; p<0.0001). While men had lower IP-10 than women at baseline (median=138 (IQR:109–183) vs median=154 (123–199), respectively), these differences were not statistically significant (p=0.27).
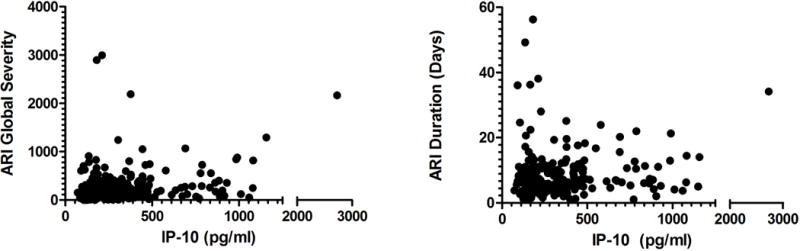
Serum IP-10 correlated with ARI severity, duration, and symptoms.(Figure 2) An ARI induced an increase in IP-10 over baseline almost 80% of the time with serum IP-10 increasing from baseline (median: 152 pg/ml [IQR:119–192]) to ARI (median: 295 pg/ml [IQR:172–433]; p<0.0001). While baseline IP-10 did not correlate with ARI outcomes, both ARI IP-10 and change in IP-10 correlated with all of the ARI outcomes (Table 2). ARI IP-10 correlates significantly with ARI global severity (rho=0.28 [95% CI: 0.15–0.39]; p<0.001) and duration (rho=0.14 [95% CI: 0.01–0.27]; p=0.03). (Figure 2) After adjusting for age, sex, and BMI, for every unit increase in log-based 10 IP-10, there was an increase in log 10 ARI global severity of 0.50 (95% CI: 0.28–0.72). (Table 3) This implies that an IP-10 concentration of 100 pg/mL predicted a 50 unit (95% CI: 44–67 units) increase in ARI global severity. For every 10% increase in IP-10 from baseline, there was a 1.8% increase in ARI global severity (95% CI: 0.9%–2.7%).
Figure 2.

Serum IP-10 correlates with ARI severity and duration. Serum IP-10 correlates with ARI global severity (Spearman rho 0.28 (95% CL: 0.15–0.39); p<0.001) as measured using the WURSS area under the curve (WURSS AUC). IP-10 also correlates with ARI duration days (Spearman rho=0.14 [95% CI: 0.01–0.27]; p=0.03).
Table 2.
IP-10 correlates with ARI Severity, Duration, and Symptoms
| ARI Outcome | Baseline IP-10 (pg/ml) Spearman rho (95% CI) [pvalue] | ARI IP-10 (pg/ml)Spearman rho (95% CI) [pvalue] | Change from Baseline in IP-10 (pg/ml) Spearman rho (95% CI) [pvalue] |
|---|---|---|---|
| ARI Global Severity (WURSS AUC) | 0.06 (−0.08–0.18) [0.41] |
0.28 (0.15–0.39) [<0.0001] |
0.29 (0.16–0.40) [<0.0001] |
| ARI Duration (days) | 0.09 (−0–0.22) [0.17] |
0.14 (0.01–0.27) [0.03] |
0.12 (−0.00–0.26) [0.05] |
| ARI Daily Severity1 | −0.02 (−0–0.11) [0.74] |
0.34 (0.22–0.45) [<0.0001] |
0.35 (0.23–0.46) [<0.0001} |
| Nasal Symptoms1 | −0.06 (−0–0.08) [0.41] |
0.29 (0.16–0.40) [<0.0001] |
0.31 (0.19–0.42) [<0.0001] |
| Throat Symptoms1 | 0.04 (−0–0.18) [0.51] |
0.31 (0.18–0.42) [<0.0001] |
0.29 (0.17–0.41) [<0.0001] |
| QoL Symptoms1 | −0.05 (−0–0.08) [0.42] |
0.24 (0.11–0.36) [<0.0001] |
0.25 (0.12–0.37) [<0.0001] |
Observed on the day of the IP-10 blood draw.
Table 3.
| ARI Outcome | Modeling Results | Predicted Effect on ARI Outcome at Various ARI IP-10 (pg/ml) Values (after adjusting for age, gender, and bmi) | |||||||
|---|---|---|---|---|---|---|---|---|---|
| Beta | SE | 95% CI | P-value | 100 | 377 | 500 | 1000 | ||
| ARI Global Severity1 (WURSS AUC) | 0.50 | 0.11 | 0.28–0.72 | <0.0001 | 50 | 190 | 252 | 503 | |
| ARI Duration1 (days) | 0.13 | 0.07 | −0.02–0.26 | 0.08 | 13 | 48 | 63 | 127 | |
| ARI Daily Severity3 | 34.5 | 6.4 | 22.0–46.9 | <0.0001 | 69 | 89 | 93 | 103 | |
| Nasal Symptoms3 | 4.76 | 1.12 | 2.59–6.94 | <0.0001 | 9.5 | 12.3 | 12.9 | 14.3 | |
| Throat Symptoms3 | 5.21 | 1.05 | 3.17–7.25 | <0.0001 | 10.4 | 13.4 | 14.1 | 15.6 | |
| QoL Symptoms3 | 4.98 | .15 | 2.75–7.22 | <0.0001 | 10.0 | 12.8 | 13.5 | 15.0 | |
As modeled using log-based 10 transformation.
All models include the following covariates: age, gender, and BMI at baseline.
Observed on the day of the IP-10 blood draw.
IP-10 with ARI correlates with the ARI severity on day of serum collection in the expected positive direction both for the daily severity score (rho=0.34 [95% CI: 0.22–0.45], p<0.0001) and for for each group of symptoms: nasal (rho=0.29 [95% CI: 0.16–0.40]), throat (rho=0.31 [95% CI: 0.18–0.42[), and quality of life (rho=0.24 [95% CI: 0.11–0.36]) (Table 2). These relationships remain after adjusting for age, gender, and BMI (Table 3).
Finally, serum IP-10 concentrations are higher in individuals with an ARI in which a viral pathogen was detected (median=366 pg/ml [IQR:227–486]) compared to those in which no pathogen was identified in nasal specimens (median=163 pg/ml [IQR:127–295]; p<0.0001) (Table 4). While nasal symptoms were more prominent in those with a virus identified compared to those in which no virus was found (median=5 [IQR:2–9] vs 2 [IQR:2–9], p=0.001). Among those with only one identified viral pathogen, influenza infections had higher IP-10 concentrations (median=802 pg/ml [IQR:430–1079]), compared to coronavirus (median=322 pg/ml [IQR:254–429], p=0.0003), enterovirus or rhinovirus (median=311 pg/ml [IQR:204–448], p<0.0001), and paramyxoviruses (median=379 pg/ml [IQR:200–778], p=0.03) (Figure 3). We also compared the ARI global severity among those with a single virus identified in their nasal specimens. Those with coronavirus infection had the lowest ARI global severity (median=149 pg/ml [IQR:72–230]), while those with paramyxoviruses had the highest ARI global severity (median=402 pg/ml [IQR:159–385], p=0.01). Those with enterovirus or rhinovirus infection also had lower ARI global severity (median=166 pg/ml [IQR:70–331]) than those with paramyxoviruses (p=0.008).
Table 4.
Acute Respiratory Infection Characteristics and Viral Identification
| ARI IP-10 (pg/ml) |
ARI Global Severity (WURSS AUC) |
||
|---|---|---|---|
| Virus Identification | N (%) | Median (IQR) | Median (IQR) |
| Not Identified | 74 (33%) | 163 (127–295) | 154 (79–290) |
| Present: | 151 (67%) | 366 (227–486) | 189 (88–366) |
| Adenovirus or Bocavirus | 1 (0.7%) | 135 | 1067 |
| Coronavirus | 30 (20%) | 322 (254–429) | 149 (72–230) |
| Enterovirus or Rhinovirus | 75 (50%) | 311 (204–448) | 166 (70–331) |
| Influenza virus | 18 (12%) | 802 (430–1079) | 277 (81–548) |
| Paramyxovirus | 19 (13%) | 379 (200–778) | 402 (171–804) |
| More than One Virus Identified | 8 (5%) | 343 (235–725) | 292 (159–385) |
ARI = acute respiratory infection
Figure 3.
IP-10 concentration varies with virus identified in ARI. If a virus was identified, the IP-10 concentration (median=366 pg/ml [IQR: 227–486]) was much higher compared to those ARI when no virus was identified (median=163 pg/ml [IQR: 127–295]; p<0.0001). Among those with a single identified viral pathogen, influenza infections had higher IP-10 concentrations (median=802 pg/ml [IQR: 430–1079]), compared to coronavirus (median=322 pg/ml [IQR: 254–429]; p=0.0003), enterovirus or rhinovirus (median=311 pg/ml [IQR 204–448]; p<0.0001), or paramyxoviruses (median=379 pg/ml [IQR: 200–778]; p=0.03). The boxes represent the 25th and 75th percentile and the whiskers are the 5th and 95th percentile.
Discussion
This paper presents some evidence that IP-10 concentration early during the ARI may serve as a useful predictor of ARI outcome, including severity and duration in healthy adults. The concentration of IP-10 appears to correlate with symptom severity and hence could serve as a useful marker or predictor of ARI illness severity. IP-10 correlates with symptoms on the day that it is measured, and appears to predict subsequent severity and duration. It appears to correlate with all three groups of symptoms used to measure ARI severity as expected from a potential biomarker in serum. [25, 26]
In the context of a clinical study, such as the one reported here, participants also have baseline IP-10 concentrations measured at study entry, a time when they are not sick. We show that the change in IP-10 concentration at ARI over baseline also correlates with ARI severity and duration. This finding confirms that the IP-10 concentrations increase with ARI illness. For example, IP-10 could potentially be helpful with risk-stratification, with refining the differential diagnosis, or even possibly with clinical decision-making, such as whether to initiate antiviral treatment. Future work would be needed to formally test these possibilities.
Serum IP-10 correlates with detection of virus in nasal specimens obtained within the first 72 hours of symptoms. Parallel correlations exist in that influenza and paramyxovirus infections are associated with higher IP-10 concentrations and greater ARI severity, as measured by WURSS AUC, compared to infections caused by coronaviruses, enteroviruses, and rhinoviruses. Our results are consistent with the findings from another laboratory that found higher IP-10 concentrations in bronchoalveolar lavage samples in which a virus was identified. [17] However, the patients in that study were much sicker as all were hospitalized and underwent bronchoscopy for diagnosis of their lower respiratory tract infection.
Few serum biomarkers of ARI have been identified. In fact, for all-cause community-acquired ARI illness, no reliable predictor of severity or duration exists. [27] Our group previously found a positive correlation between interleukin-8 concentrations in nasal wash and severity and duration of ARI nasal symptoms, including runny nose, plugged nose, and sneezing.[25] In contrast, serum procalcitonin is not a useful marker for ARI.[28] Other research groups have reported that nasal IP-10 is correlated with ARI, primarily among people with underlying illness. [29–31] ARIs caused by parainfluenza virus in adults with severe multiple disabilities had an almost 9 fold increase in the serum concentration of IP-10 during the acute phase of the infection.[16] Additionally, in other populations with underlying illnesses, such as asthma or COPD, IP-10 concentrations measured in serum [16, 32–34] or nasal [31] samples or IP-10 gene expression [19, 35] again correlated with acute respiratory infections leading to exacerbations. Although IP-10 concentrations are higher in smokers with COPD but not in smokers generally,[36] the number of smokers in our cohort is small and hence unlikely to influence IP-10 concentrations. However, we also analyzed change in IP-10 with ARI and got the same results. Although the correlations are relatively modest, our study results show that serum IP-10 is a potentially useful marker for ARI severity and trends with ARI duration in this healthy population.
Although IP-10 is elevated with influenza infections compared to controls, IP-10 has not been shown to be useful for identifying severe influenza infections. [37] Although large increases in IP-10 concentrations were observed with parainfluenza infections, no correlations with clinical severity of infection were apparent. [16] In contrast, we found that IP-10 concentrations correlate with ARI symptoms on the day measured early in the course of the infection, as well as with severity and duration of ARI in a cohort of healthy individuals.
The ARI episodes in these healthy individuals were mild to moderate in severity. These were community-recruited female-predominated participants who are primarily white, well-educated and agreed to be monitored for a cold-and-flu season. The vast majority of illness episodes were not severe enough to prompt clinical evaluation. A sample collected from people presenting to clinic would likely demonstrate somewhat higher severity and biomarker values, which might influence the relationships reported here. [39] The nasal specimens in which no virus was detected are certainly not always without viral or infectious cause. There are several reasons why we did not identify virus in someone sick with what appears to be an ARI: 1) we did not test for the virus causing the infection; 2) the symptoms are associated with an allergic response or other inflammatory reaction; 3) the infection is of bacterial[40] or fungal etiology; 4) the symptoms are caused by chemical irritation; 5) the symptoms are psychosomatic.
Our study results provide evidence that IP-10 is a biomarker for ARI severity in healthy adults. Serum IP-10 concentration correlates with ARI severity, as measured by WURSS, on the day that it is measured. Also, IP-10 concentration measured early in the course of the ARI correlates with both the severity and trends with duration of the illness.
Highlights.
Serum IP-10 concentrations from 225 ARI episodes correlated with ARI severity on the day that it was measured and overall ARI severity for the episode.
IP-10 concentrations were higher with an ARI in which a viral pathogen was detected compared to no viral pathogen detected. Influenza infections induce higher IP-10 concentrations than coronavirus, enterovirus or rhinovirus, and paramyxovirus.
IP-10 may be a biomarker for ARI severity and for presence of a viral pathogen.
Acknowledgments
Funding: This work was supported by a grant from the National Institutes of Health, National Center for Complementary and Integrative Health (NCCIH), USA (R01AT006970). Bruce Barrett was supported by a midcareer investigator award from NCCIH (K24AT006543).
Footnotes
Publisher's Disclaimer: This is a PDF file of an unedited manuscript that has been accepted for publication. As a service to our customers we are providing this early version of the manuscript. The manuscript will undergo copyediting, typesetting, and review of the resulting proof before it is published in its final citable form. Please note that during the production process errors may be discovered which could affect the content, and all legal disclaimers that apply to the journal pertain.
Competing interests: None declared
Ethical approval: The study protocol was approved by the University of Wisconsin-Madison Institutional Review Board for Human Subjects Research.
References
- 1.Kitahara CM, Trabert B, Katki HA, Chaturvedi AK, Kemp TJ, Pinto LA, Moore SC, Purdue MP, Wentzensen N, Hildesheim A, Shiels MS. Body mass index, physical activity, and serum markers of inflammation, immunity, and insulin resistance. Cancer Epidemiol Biomarkers Prev. 2014;23(12):2840–2849. doi: 10.1158/1055-9965.EPI-14-0699-T. [DOI] [PMC free article] [PubMed] [Google Scholar]
- 2.Niki T, Soeki T, Yamaguchi K, Taketani Y, Yagi S, Iwase T, Yamada H, Wakatsuki T, Shimabukuro M, Sata M. Elevated concentration of interferon-inducible protein of 10 kD (IP-10) is associated with coronary atherosclerosis. Internat Heart J. 2015;56(3):269–272. doi: 10.1536/ihj.14-300. [DOI] [PubMed] [Google Scholar]
- 3.Liu M, Guo S, Hibbert JM, Jain V, Singh N, Wilson NO, Stiles JK. CXCL10/IP-10 in infectious diseases pathogenesis and potential therapeutic implications. Cytokine Growth Factor Rev. 2011;22(3):121–130. doi: 10.1016/j.cytogfr.2011.06.001. [DOI] [PMC free article] [PubMed] [Google Scholar]
- 4.Sindhu S, Thomas R, Shihab P, Sriraman D, Behbehani K, Ahmad R. Obesity is a positive modulator of IL-6R and IL-6 expression in the subcutaneous adipose tissue: Significance for metabolic inflammation. PLoS ONE. 2015;10(7):e0133494. doi: 10.1371/journal.pone.0133494. [DOI] [PMC free article] [PubMed] [Google Scholar]
- 5.Christen U, McGavern DB, Luster AD, von Herrath MG, Oldstone MBA. Among CXCR3 Chemokines, IFN-γ-Inducible Protein of 10 kDa (CXC Chemokine Ligand (CXCL) 10) but Not Monokine Induced by IFN-γ (CXCL9) Imprints a Pattern for the Subsequent Development of Autoimmune Disease. J Immunol. 2003;171(12):6838–6845. doi: 10.4049/jimmunol.171.12.6838. [DOI] [PubMed] [Google Scholar]
- 6.Roberts WK, Blachère NE, Frank MO, Dousmanis A, Ransohoff RM, Darnell RB. A destructive feedback loop mediated by CXCL10 in central nervous system inflammatory disease. Ann Neurolog. 2015;78(4):619–629. doi: 10.1002/ana.24494. [DOI] [PMC free article] [PubMed] [Google Scholar]
- 7.Luster AD, Ravetch JV. Biochemical characterization of a gamma interferon-inducible cytokine (IP-10) J Exp Med. 1987;166(4):1084–1097. doi: 10.1084/jem.166.4.1084. [DOI] [PMC free article] [PubMed] [Google Scholar]
- 8.Luster AD, Jhanwar SC, Chaganti RS, Kersey JH, Ravetch JV. Interferon-inducible gene maps to a chromosomal band associated with a (4;11) translocation in acute leukemia cells. Proc Nat Acad Sci. 1987;84(9):2868–2871. doi: 10.1073/pnas.84.9.2868. [DOI] [PMC free article] [PubMed] [Google Scholar]
- 9.Loetscher M, Gerber B, Loetscher P, Jones SA, Piali L, Clark-Lewis I, Baggiolini M, Moser B. Chemokine receptor specific for IP10 and mig: structure, function, and expression in activated T-lymphocytes. J Exp Med. 1996;184(3):963–969. doi: 10.1084/jem.184.3.963. [DOI] [PMC free article] [PubMed] [Google Scholar]
- 10.Jinquan T, Jing C, Jacobi HH, Reimert CM, Millner A, Quan S, Hansen JB, Dissing S, Malling H-J, Skov PS, Poulsen LK. CXCR3 Expression and Activation of Eosinophils: Role of IFN-γ-Inducible Protein-10 and Monokine Induced by IFN-γ. J Immunol. 2000;165(3):1548–1556. doi: 10.4049/jimmunol.165.3.1548. [DOI] [PubMed] [Google Scholar]
- 11.Angiolillo AL, Sgadari C, Taub DD, Liao F, Farber JM, Maheshwari S, Kleinman HK, Reaman GH, Tosato G. Human interferon-inducible protein 10 is a potent inhibitor of angiogenesis in vivo. J Exp Med. 1995;182(1):155–162. doi: 10.1084/jem.182.1.155. [DOI] [PMC free article] [PubMed] [Google Scholar]
- 12.Neville LF, Mathiak G, Bagasra O. The immunobiology of interferon-gamma inducible protein 10 kD (IP-10): A novel, pleiotropic member of the C-X-C chemokine superfamily. Cytokine Growth Factor Rev. 1997;8(3):207–219. doi: 10.1016/s1359-6101(97)00015-4. [DOI] [PubMed] [Google Scholar]
- 13.Aksoy MO, Yang Y, Ji R, Reddy PJ, Shahabuddin S, Litvin J, Rogers TJ, Kelsen SG. CXCR3 surface expression in human airway epithelial cells: cell cycle dependence and effect on cell proliferation. Am J Physiolog-Lung Cell Molecul Physiolog. 2006;290(5):L909–L918. doi: 10.1152/ajplung.00430.2005. [DOI] [PubMed] [Google Scholar]
- 14.Sui Y, Stehno-Bittel L, Li S, Loganathan R, Dhillon NK, Pinson D, Nath A, Kolson D, Narayan O, Buch S. CXCL10-induced cell death in neurons: role of calcium dysregulation. Eur J Neurosci. 2006;23(4):957–964. doi: 10.1111/j.1460-9568.2006.04631.x. [DOI] [PubMed] [Google Scholar]
- 15.Feldman ED, Weinreich DM, Carroll NM, Burness ML, Feldman AL, Turner E, Xu H, Alexander HR. Interferon γ-Inducible Protein 10 Selectively Inhibits Proliferation and Induces Apoptosis in Endothelial Cells. Ann Surg Oncol. 2006;13(1):125–133. doi: 10.1245/ASO.2006.03.038. [DOI] [PubMed] [Google Scholar]
- 16.Matsuda S, Kiyota N, Yoshizumi M, Noda M. Alteration in serum levels of inflammatory cytokines during parainfluenza virus type 1 infection in patients with severe multiple disabilities. Jap J Infect Dis. 2014;67(5):392–396. doi: 10.7883/yoken.67.392. [DOI] [PubMed] [Google Scholar]
- 17.Sumino KC, Walter MJ, Mikols CL, Thompson SA, Gaudreault-Keener M, Arens MQ, Agapov E, Hormozdi D, Gaynor AM, Holtzman MJ, Storch GA. Detection of respiratory viruses and the associated chemokine responses in serious acute respiratory illness. Thorax. 2010;65(7):639–644. doi: 10.1136/thx.2009.132480. [DOI] [PMC free article] [PubMed] [Google Scholar]
- 18.Wark PAB, Bucchieri F, Johnston SL, Gibson PG, Hamilton L, Mimica J, Zummo G, Holgate ST, Attia J, Thakkinstian A, Davies DE. IFN-γ-induced protein 10 is a novel biomarker of rhinovirus-induced asthma exacerbations. J Allergy Clin Immunol. 2007;120(3):586–593. doi: 10.1016/j.jaci.2007.04.046. [DOI] [PMC free article] [PubMed] [Google Scholar]
- 19.Wood LG, Powell H, Grissell TV, Davies B, Shafren DR, Whitehead BF, Hensley MJ, Gibson PG. Persistence of rhinovirus RNA and IP-10 gene expression after acute asthma. Respirology. 2011;16(2):291–299. doi: 10.1111/j.1440-1843.2010.01897.x. [DOI] [PMC free article] [PubMed] [Google Scholar]
- 20.Lee W-M, Grindle K, Pappas T, Marshall DJ, Moser MJ, Beaty EL, Shult PA, Prudent JR, Gern JE. High-throughput, sensitive, and accurate multiplex PCR-microsphere flow cytometry system for large-scale comprehensive detection of respiratory viruses. J Clin Microbiol. 2007;45(8):2626–2634. doi: 10.1128/JCM.02501-06. [DOI] [PMC free article] [PubMed] [Google Scholar]
- 21.Jackson G, Dowling H, Muldoon R. Present concepts of the common cold. Am J Public Health Nations Health. 1962;52(6):940–5. doi: 10.2105/ajph.52.6.940. [DOI] [PMC free article] [PubMed] [Google Scholar]
- 22.Barrett B, Brown R, Mundt M, Safdar N, Dye L, Maberry R, Alt J. The Wisconsin Upper Respiratory Symptom Survey is responsive, reliable, and valid. J Clin Epidemiol. 2005;58(6):609–617. doi: 10.1016/j.jclinepi.2004.11.019. [DOI] [PMC free article] [PubMed] [Google Scholar]
- 23.Barrett B, Brown RL, Mundt MP, Thomas GR, Barlow SK, Highstrom AD, Bahrainian M. Validation of a short form Wisconsin Upper Respiratory Symptom Survey (WURSS-21) Health Qual Life Outcomes. 2009;7(1):1–20. doi: 10.1186/1477-7525-7-76. [DOI] [PMC free article] [PubMed] [Google Scholar]
- 24.Barrett B, Hayney MS, Muller D, Rakel D, Ward A, Obasi CN, Brown R, Zhang Z, Zgierska A, Gern J, West R, Ewers T, Barlow S, Gassman M, Coe CL. Meditation or exercise for preventing acute respiratory infection: A randomized controlled trial. Ann Fam Med. 2012;10(4):337–346. doi: 10.1370/afm.1376. [DOI] [PMC free article] [PubMed] [Google Scholar]
- 25.Henriquez KM, Hayney MS, Xie Y, Zhang Z, Barrett B. Association of interleukin-8 and neutrophils with nasal symptom severity during acute respiratory infection. J Med Virol. 2015;87(2):330–337. doi: 10.1002/jmv.24042. [DOI] [PMC free article] [PubMed] [Google Scholar]
- 26.Obasi CN, Brown RL, Barrett BP. Item reduction of the Wisconsin Upper Respiratory Symptom Survey (WURSS-21) leads to the WURSS-11. Qual Life Res. 2014;23(4):1293–1298. doi: 10.1007/s11136-013-0561-z. [DOI] [PMC free article] [PubMed] [Google Scholar]
- 27.Longmier E, Barrett B, Brown R. Can patients or clinicians predict the severity or duration of an acute upper respiratory infection? Fam Pract. 2013;30(4):379–385. doi: 10.1093/fampra/cmt006. [DOI] [PMC free article] [PubMed] [Google Scholar]
- 28.Henriquez KM, Hayney MS, Rakel DP, Barrett B. Procalcitonin levels in acute respiratory infection. Viral Immunol. 2016;29(2):128–31. doi: 10.1089/vim.2015.0106. Epub 2016/01/08. [DOI] [PMC free article] [PubMed] [Google Scholar]
- 29.Manthei DM, Schwantes EA, Mathur SK, Guadarrama AG, Kelly EA, Gern JE, Jarjour NN, Denlinger LC. Nasal lavage VEGF and TNF-α levels during a natural cold predict asthma exacerbations. Clin Exp Allergy. 2014;44(12):1484–1493. doi: 10.1111/cea.12387. [DOI] [PMC free article] [PubMed] [Google Scholar]
- 30.Malmo J, Moe N, Krokstad S, Ryan L, Loevenich S, Johnsen IB, Espevik T, Nordbo SA, Dollner H, Anthonsen MW. Cytokine profiles in human metapneumovirus infected children: Identification of genes involved in the antiviral response and pathogenesis. PLoS One. 2016;11(5):e0155484. doi: 10.1371/journal.pone.0155484. Epub 2016/05/14. [DOI] [PMC free article] [PubMed] [Google Scholar]
- 31.Lewis TC, Henderson TA, Carpenter AR, Ramirez IA, McHenry CL, Goldsmith AM, Ren X, Mentz GB, Mukherjee B, Robins TG, Joiner TA, Mohammad LS, Nguyen ER, Burns MA, Burke DT, Hershenson MB. Nasal cytokine responses to natural colds in asthmatic children. Clinical and experimental allergy : journal of the British Society for Allergy and Clinical Immunology. 2012;42(12):1734–44. doi: 10.1111/cea.12005. Epub 2012/11/28. [DOI] [PMC free article] [PubMed] [Google Scholar]
- 32.Almansa R, Sanchez-Garcia M, Herrero A, Calzada S, Roig V, Barbado J, Rico L, Bobillo F, Eiros JM, Iglesias V, de Lejarazu RO, Bermejo-Martin JF. Host response cytokine signatures in viral and nonviral acute exacerbations of chronic obstructive pulmonary disease. Journal of interferon & cytokine research : the official journal of the International Society for Interferon and Cytokine Research. 2011;31(5):409–13. doi: 10.1089/jir.2010.0131. Epub 2011/01/18. [DOI] [PubMed] [Google Scholar]
- 33.Kato M, Tsukagoshi H, Yoshizumi M, Saitoh M, Kozawa K, Yamada Y, Maruyama K, Hayashi Y, Kimura H. Different cytokine profile and eosinophil activation are involved in rhinovirus- and RS virus-induced acute exacerbation of childhood wheezing. Ped Allergy Immunol. 2011;22(1pt2):e87–e94. doi: 10.1111/j.1399-3038.2010.01026.x. [DOI] [PubMed] [Google Scholar]
- 34.Quint JK, Donaldson GC, Goldring JJP, Baghai-Ravary R, Hurst JR, Wedzicha JA. Serum IP-10 as a biomarker of human rhinovirus infection at exacerbation of COPD. Chest. 2010;137(4):812–822. doi: 10.1378/chest.09-1541. [DOI] [PMC free article] [PubMed] [Google Scholar]
- 35.Wood LG, Simpson JL, Wark PA, Powell H, Gibson PG. Characterization of innate immune signalling receptors in virus-induced acute asthma. Clinical and experimental allergy : journal of the British Society for Allergy and Clinical Immunology. 2011;41(5):640–8. doi: 10.1111/j.1365-2222.2010.03669.x. Epub 2010/12/07. [DOI] [PubMed] [Google Scholar]
- 36.Saetta M, Mariani M, Panina-Bordignon P, Turato G, Buonsanti C, Baraldo S, Bellettato CM, Papi A, Corbetta L, Zuin R, Sinigaglia F, Fabbri LM. Increased expression of the chemokine receptor CXCR3 and its ligand CXCL10 in peripheral airways of smokers with chronic obstructive pulmonary disease. Am J Respir Crit Care Med. 2002;165(10):1404–9. doi: 10.1164/rccm.2107139. Epub 2002/05/23. [DOI] [PubMed] [Google Scholar]
- 37.Hagau N, Slavcovici A, Gonganau DN, Oltean S, Dirzu DS, Brezoszki ES, Maxim M, Ciuce C, Mlesnite M, Gavrus RL, Laslo C, Hagau R, Petrescu M, Studnicska DM. Clinical aspects and cytokine response in severe H1N1 influenza A virus infection. Critical Care. 2010;14(6):1–10. doi: 10.1186/cc9324. [DOI] [PMC free article] [PubMed] [Google Scholar]
- 38.Huang R, Zhang L, Gu Q, Zhou Y-H, Hao Y, Zhang K, Liu Y, Dong D, Wang S, Huang Z, Lu S, Wu C. Profiles of acute cytokine and antibody responses in patients infected with avian influenza A H7N9. PLoS ONE. 2014;9(7):e101788. doi: 10.1371/journal.pone.0101788. [DOI] [PMC free article] [PubMed] [Google Scholar]
- 39.van Houten CB, de Groot JAH, Klein A, Srugo I, Chistyakov I, de Waal W, Meijssen CB, Avis W, Wolfs TFW, Shachor-Meyouhas Y, Stein M, Sanders EAM, Bont LJ. A host-protein based assay to differentiate between bacterial and viral infections in preschool children (OPPORTUNITY): a double-blind, multicentre, validation study. Lancet Infect Dis. doi: 10.1016/S1473-3099(16)30519-9. [DOI] [PubMed] [Google Scholar]
- 40.Obasi CN, Barrett B, Brown R, Vrtis R, Barlow S, Muller D, Gern J. Detection of viral and bacterial pathogens in acute respiratory infections. J Infect. 2014;68(2):125–130. doi: 10.1016/j.jinf.2013.10.013. [DOI] [PMC free article] [PubMed] [Google Scholar]