

Abstract
Chromaffin cells of the adrenal medulla are innervated by the sympathetic nervous system. Stimulation causes chromaffin cells to fire action potentials leading to the exocytosis of various classes of transmitters into the circulation. Low frequency electrical stimulation (action potentials delivered at 0.5 Hz) causes adrenal chromaffin cells to selectively release catecholamines through a kiss-and-run fusion event. Elevated electrical stimulation (action potentials at 15 Hz) evokes fusion pore dilation, full granule collapse and additional release of the neuropeptide-containing proteinacious granule core. Here we apply single-cell electrophysiological, electrochemical and fluorescence measurements to investigate the cellular mechanism for this shift in exocytic behavior. We show that at low frequency stimulation, a filamentous-actin cell cortex plays a key role in stabilizing the kiss-and-run fusion event. Increased stimulation disrupts the actin cortex, driving full granule collapse. We show pharmacological perturbation of the actin cortex supersedes stimulus frequency in controlling exocytic mode. Finally, we show that non-muscle myosin II activation contributes to the cytoskeleton-dependent control of the fusion event. Inhibition of myosin II or myosin light chain kinase under elevated stimulation frequencies inhibits fusion pore dilation and maintains the granule in a kiss and run mode of exocytosis. These results demonstrate an essential role for activity-evoked cytoskeletal re-arrangement and the action of myosin II in the regulation of catecholamine and neuropeptide exocytosis and represents an essential element of the sympathetic stress response.
Keywords: Actin, Myosin II, Exocytosis, Chromaffin, Neurotransmitter, Stress
Chromaffin cells of the adrenal medulla are a major output of the sympathetic nervous system and are innervated by the splanchnic nerve through a cholinergic synapse. Under basal sympathetic firing, chromaffin cells selectively release freely-soluble catecholamines through an Ω-form kiss-and-run fusion event (Elhamdani et al., 2006; Fulop and Smith, 2006). This exocytic mode is characterized by transient fusion of the granule with the cell membrane, maintenance of basic granule morphology and retention of the dense proteinacious granule core (Fulop et al., 2005). In contrast, under acute stress, increased splanchnic firing and subsequent acetylcholine release drives chromaffin cells to increase their activity level (Brandt et al., 1976; Kidokoro and Ritchie, 1980) resulting in elevated catecholamine output. Under these conditions the restricted fusion pore dilates, leading to a full granule collapse and expulsion of both catecholamine as well as the neuropeptide-containing proteinacious core (Rahamimoff and Fernandez, 1997; Fulop et al., 2005). Thus, dependent upon stimulation intensity, chromaffin cells utilize two modes of exocytosis that differentially release catecholamine and neuropeptide transmitter molecules. The cellular mechanism and regulation of the transition from kiss-and-run to full granule collapse is not fully understood. Improper regulation of the acute stress response can cause pathological conditions such as hypertension, diabetes, and depression (Habib et al., 2001).
Many studies focused on the role played by the cytoskeleton in the control of catecholamine release. In resting conditions, chromaffin cells exhibit a sub-plasmalemmal filamentous actin (F-actin) cortical network that is thought to act as a physical barrier to granule recruitment to the plasma membrane and limit secretory function (Vitale et al., 1995a; Barclay et al., 2003). Stimulation leads to a partial dissolution of the F-actin cortex, allowing for granule recruitment to the cell periphery for sustained transmitter release (Vitale et al., 1991). It has also been shown that non-muscle myosin II, associated with the F-actin network, may play a role in active granule recruitment (Neco et al., 2002). On the single granule level, inhibition of myosin II decreases the catecholamine quantal size of single fusion events (Neco et al., 2004). However, mechanistic description for how the actin/myosin II system regulates quantal size remains to be determined.
The goal of this study was to investigate the role of activity-mediated actin reorganization and myosin II function in the control of quantal exocytosis. We utilized carbon-fiber amperometry, capacitance noise analysis, fluorescence microscopy and peptide transfection techniques to investigate the mode of exocytosis. We determined the role of the actin cytoskeleton and myosin II in regulating the activity-dependent transition from kiss-and-run to full collapse exocytosis. Our data demonstrate that the characteristic Ω-form kiss-and-run exocytosis is stabilized by an intact F-actin cortex. Elevated stimulation resulted in a cooperative partial disruption of the F-actin cortex and activation of myosin II to drive collapse of the Ω-figure to achieve the full collapse exocytic mode. Thus, we have identified a role for F-actin and myosin II in the control and regulation of a proper sympathetic stress response by controlling the mode of exocytosis at the single granule level.
Methods
Chromaffin cells isolated from the adrenal medullae of adult C57/BL6 mice (Jackson Laboratories, Bar Harbor, ME; 8 weeks old) were used in this study. All anesthesia and euthanasia protocols were reviewed and approved by the institutional animal care and use committee (IACUC) of Case Western Reserve University, an accredited oversight body (federal animal welfare assurance # A3145-01). Animals were deeply anesthetized by isoflurane inhalation and sacrificed by decapitation. All chemicals and reagents were obtained from Sigma (St. Louis, MO) unless otherwise noted in the text.
Cell Preparation
Adrenal glands were removed immediately after animal sacrifice and placed in an ice-cold dissociation solution containing (in mM) 80 Na Glutamate, 55 NaCl, 6 KCl, 1 MgCl2, 10 HEPES, 10 Glucose, pH 7.0 and osmolarity adjusted to 280 mOsm. Glands were trimmed of fat and the adrenal cortex was dissected from the medulla. Cells were isolated as previously described (Fulop et al., 2005) and plated on 25 mm round cover glasses and cultured in ~2 ml DMEM growth medium supplemented with ITS-X artificial serum substitute (1x; Invitrogen, Carlsbad CA) and penicillin/streptomycin (20 units/ml each). The cells were incubated at 35 °C in 10% CO2 and the experiments were carried out at ~25° C 2-3 days following cell preparation.
Electrophysiology and electrochemistry
All electrophysiological recordings were performed in the perforated-patch configuration (Korn and Horn, 1989) as previously described (Chan and Smith, 2001) with some modifications described here. The electrical stimulus protocols were delivered by either an EPC-9 or EPC-10 amplifier (HEKA Elektronik, Lambrecht Germany) controlled by Pulse (HEKA Elektronik, v 8.8). Cell capacitance was measured by imposing a 635 Hz sine wave 25 mV in amplitude superimposed on a holding potential of -80 mV. Cell capacitance and conductance were determined by the Sine+D.C. method (Gillis, 1995) implemented through the built in lock-in module in Pulse. Cells were stimulated with action potential equivalent (APe) waveforms embedded in the sine wave holding potential at either 0.5 Hz or 15 Hz. The APe was formed from ramp segments as follows (start potential [mV], end potential [mV], duration [ms]): -80, 50, 2.5; 50, -90, 2.5; -90, -80, 2.5. Voltage-dependent sodium and calcium influx, elicited catecholamine release and capacitance jumps in response to APe stimulation have been shown to be statistically identical to native AP waveforms (Chan and Smith, 2001). The internal pipette solution contained the following composition (in mM): 135 CsGlutamate, 10 HEPES-H, 9.5 NaCl, 0.5 TEA-Cl, and 0.53 amphotericin B. During all recordings, the cells were constantly superfused at a rate of ~1ml/min with a Ringer solution of the following composition (mM): 150 NaCl, 10 HEPES-H, 10 Glucose, 2.8 CaCl2, 2.8 KCl, and 2 MgCl2. The osmolarity was adjusted to 320 mOsm with mannitol, and the pH adjusted to 7.2. The junction potential for this internal/Ringer solution set was measured to be approximately -13 mV and all potentials were adjusted accordingly. For elevated potassium stimulation, KCl was increased to either 8 mM or 30 mM and NaCl was reduced to maintain osmolarity (Fulop and Smith, 2007). Cell capacitance-noise-analysis detection of Ω-form kiss-and-run granule fusion was performed as previously described (Fulop and Smith, 2006).
Amperometric recordings were also performed as previously described (Fulop et al., 2005). Commercially-available 5 μm diameter carbon fiber electrodes (ALA Scientific, Westbury, NY) were used for catecholamine detection. The carbon fiber tip was cut before each recording and the fiber was held at +650 mV. The fiber tip was positioned close to the cell membrane to minimize diffusion distance from the cell membrane. Amperometric current was recorded using a dedicated amplifier (VA-10x, ALA Scientific) with a modified head stage containing a 1 GΩ feedback resistor to minimize noise. Recorded signals were passed through a 4-pole analogue Bessel filter at a cutoff frequency of 1.3 kHz and sampled at 20 kHz through an ITC-1600 (Instrutech, Port Washington, NY) into IGOR Pro (WaveMetrics Inc., Lake Oswego, OR).
Pharmacological agents
Cells were treated with 2 μM Cytochalasin D (Sigma), 2 μM Jasplakinolide (Invitrogen), 10 μM ML7 (Calbiochem; San Diego, CA), 2 μM MLCK Inhibitor Peptide 18 (M18, Calbiochem), or 25 μM Blebbistatin (Biomol; Plymouth Meeting, PA) as indicated in the text. All pre-incubations were carried out by addition of the agent to the culture medium and incubation at 35° C to facilitate reagent uptake. This pre-incubation was 10 minutes in duration for all reagents except the cell-permeant M18 MLCK inhibitory peptide. Due to its larger size, the M18 peptide was pre-incubated in the culture medium for 20 minutes. Following pre-treatment, cells were then immediately transferred to the recording chamber, superfused with the appropriate reagent-containing recording Ringer and used for experimentation.
Imaging and fluorometry
Fluorescence images were acquired on an Olympus IX-81 inverted microscope with a 100X oil immersion objective (NA = 1.3). Excitation illumination was provided by a TILL Polychrometer IV (TILL Photonics, Pleasanton, CA) under the control of SlideBook image acquisition software (SlideBook 4.1; Intelligent Imaging Corporation, Denver, CO). Images were collected with a cooled CCD camera (Retiga EXi; QImaging Corporation, Burnaby, BC, Canada) at a set exposure time of 5 ms to standardize image intensity and to minimize photobleach during the illumination. Dextran staining and quantification was performed as previously described (Fulop et al., 2005). Actin labeling and quantification of filamentous actin (F-actin) was performed as follows: cells were pre-treated with 2 μM Cytochalasin D or 2 μM Jasplakinolide by bath application. Cells were then patch clamped and stimulated at 0.5 Hz or 15 Hz (as indicated in text) or with external potassium matched to provide identical stimulation intensity and secretory behavior (Fulop and Smith, 2007). Immediately following stimulation, cells were fixed at the pipette tip by bath application of 4% Paraformaldehyde for 25 minutes (Fulop et al., 2005). After being washed 3 times with 1X PBS, cells were bathed in 1X PBS for 5 minutes. At this point, the patch pipette was gently lifted from the cell. Next, 1.5 mL of 0.15% Triton was superfused into the dish and left for 30 minutes to permeabilize the cell membrane. Triton was then removed by 3 washes in 1X PBS and cells were incubated with 5 μl (200U/1.5 mL; Invitrogen) rhodamine-conjugated phalloidin in 1.5 mL 1X PBS. Cells were then imaged as above.
Data Analysis
Image and data analysis of fluorescence images were performed using custom-written macros in IGOR Pro (WaveMetrics). Single amperometric spikes were analyzed in IGOR Pro with a macro modified from the original ‘Spike’ package (Gomez et al., 2002). Non-parametric Mann-Whitney statistical analysis of medians was performed using Minitab (v 15; Minitab Inc., State College, PA). Statistical significance was tested at 99.99% (P < 0.001) confidence level. Statistical significance for each category plot of each mean parameter was determined by Student’s t-test. Statistical significance was tested at 95% (P < 0.05) confidence level. Data are expressed as mean ± standard error of the mean.
Results
Recent work has demonstrated a mechanistic shift in the mode of exocytosis under different stimulation conditions in chromaffin as well as other secretory cell types (Aravanis et al., 2003; Fulop et al., 2005; Richards et al., 2005; Elhamdani et al., 2006). Work from our group and others has shown that chromaffin cells exhibit a rapid and transient kiss-and-run mode of exocytosis when challenged with modest stimulation conditions. Increased electrical or chemical stimulation shifts the mode of exocytosis to a more complete full collapse secretory mode. We initiated a series of experiments designed to test if activity-dependent myosin II activation and reorganization of the actin cortex play roles in this shift in exocytic mechanism. We utilized pharmacological tools to manipulate the balance between depolymerized and polymerized actin as well as the function of myosin light chain kinase (MLCK) and myosin II. To quantify their effect, we assayed granule fusion, catecholamine release and subsequent membrane trafficking under low frequency and high frequency action potential stimulation that elicit kiss and run or full collapse exocytosis, respectively.
Disrupting the actin cortex increases amperometric spike amplitude
Carbon fiber amperometry is a high-resolution method for recording the kinetics of catecholamine release from single secretory granules (Wightman et al., 1991; Chow et al., 1992). This technique is capable of resolving the kinetics of both the initial opening and dilation of the granule-plasmalemma fusion pore as well as total quantal size of the fusion event (Alvarez de Toledo et al., 1993; Albillos et al., 1997; Artalejo et al., 2002). Increasing cell stimulation has been shown to increase quantal size (Elhamdani et al., 2001) as well as the rate of catecholamine release through an activity-mediated shift from kiss-and-run to full granule collapse (Fulop and Smith, 2006). We utilized amperometry to quantify the kinetics of catecholamine release from cells stimulated with action potential equivalent (APe) voltage templates delivered at 0.5 or 15 Hz in perforated patch voltage clamp. These conditions mimic splanchnic input under sympathetic tone or acute stress respectively (Kidokoro and Ritchie, 1980; Chan and Smith, 2001; Wilson et al., 2002).
Representative amperometric recordings from single cells stimulated with either 0.5 or 15 Hz APe trains are shown (Fig. 1a). From such experiments, we analyzed single spike parameters (Fig. 1bi) that correlate to fusion pore dilation and thus overall exocytic mode. Spike amplitude and spike charge (an index of total catecholamine content) have been shown to increase with dilation of the fusion pore (Alvarez de Toledo et al., 1993; Albillos et al., 1997; Lindau and Alvarez de Toledo, 2003; Fulop and Smith, 2006). An initial analysis of these parameters showed that they did not follow a normal, but rather a skewed distribution (Neco et al., 2004). Cumulative probability plots for each parameter are provided (Fig. 1bii). Insets in each sub-panel show box-and-whisker plots for each distribution. Non parametric Mann-Whitney median tests indicate that both parameters, spike amplitude and spike charge, are significantly smaller under 0.5 Hz versus 15 Hz APe stimulation. We also analyzed population means that also showed statistical significance in each parameter (table S1, provided in supplemental data). Thus, by either median or more conventional mean-based statistical analyses, catecholamine secretion kinetics evoked by 15 Hz electrical APe stimulation are more rapid than those under 0.5 Hz stimulation and indicate a dilated fusion pore under higher stimulation intensity.
Figure 1. Amperometric analysis of catecholamine release under 0.5 versus 15 Hz electrical stimulation.
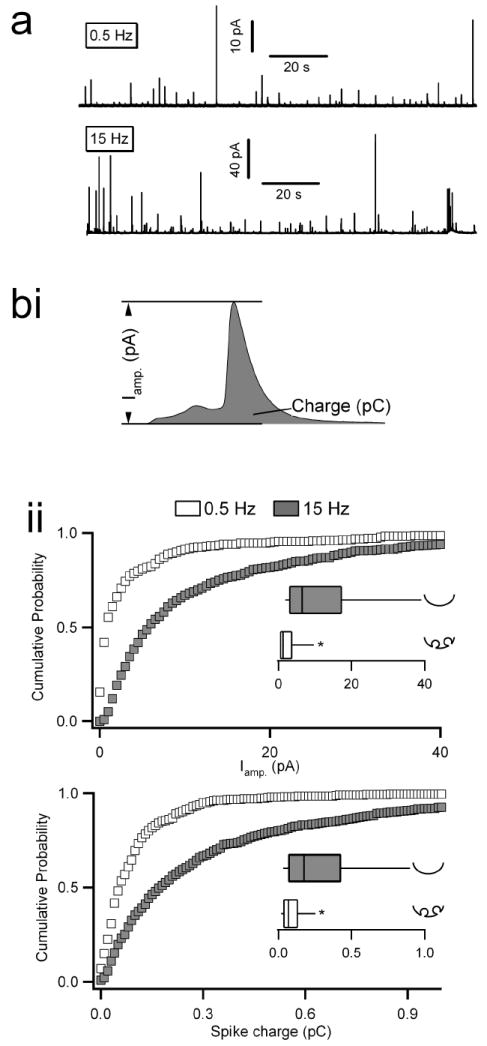
Chromaffin cells were held at -80mV in the perforated patch configuration and stimulated with action potential equivalent waveforms. (a) Representative traces from cells continuously stimulated with action potential equivalent voltage templates at 0.5 or 15 Hz are provided (note the difference in scale). Equivalent time windows are shown for better comparison. Individual spikes were identified using an automated detection algorithm and then manually confirmed. (bi) Two kinetic parameters, maximum spike amplitude (pA) and total spike charge (pC), were measured for each individual spike. Pooled cumulative probability plots for spike amplitude (bii, top plot) and charge (bii, bottom plot) are provided. Insets show box-and-whisker plots for their respective data sets. Parameters for the box-and-whisker plots are as follows; smallest non-outlier, first quartile, median, third quartile, and largest non outlier observation. Statistical significance for medians was determined by a Mann-Whitney non-parametric median analysis and asterisks in each box-and-whisker plot indicate statistical significance (p < 0.001). Icons next to each box and whisker category provide interpretation of the mode of fusion. N = 12 cells from 7 preparations for 0.5 and 10 cells from 7 preparations for 15 Hz.
Previous studies have shown that the distinct actin cortex normally observed in chromaffin cells is disrupted by cell stimulation (Vitale et al., 1995a; Trifaro et al., 2000; Giner et al., 2007). We set out to test if pharmacological perturbation of the actin cortex could mimic the difference in stimulation intensity by regulating the kinetics of catecholamine secretion. Cells were pre-treated (see Methods) with pharmacological agents that either disrupt or stabilize the actin cortex (2 μM cytochalasin D or 2 μM jasplakinolide, respectively) and stimulated at 0.5 or 15 Hz. The actin cortex was then visualized with rhodamine-conjugated phalloidin (6 μM), a compound that binds to filamentous, but not monomeric actin (Wieland, 1986). We took advantage of this polymerization-specific staining to estimate the relative disruption of the actin cortex under different stimulation conditions. Single cell images (Fig. 2, left column) as well as quantified phalloidin staining (Fig. 2, right column) show that 0.5 Hz stimulation had no effect on the actin cortex when compared to unstimulated control cells. However, pre-treatment with cytochalasin D significantly decreased the amount of polymerized F-actin at the cell periphery. Stimulation at 15 Hz resulted in a punctate phalloidin staining at the cell periphery and a decreased amount of cortical F-actin compared to unstimulated control cells. This stimulus-dependent cortical disruption was blocked by pretreatment with jasplakinolide under 15 Hz stimulation.
Figure 2. Rhodamine-phalloidin imaging of the actin cortex.
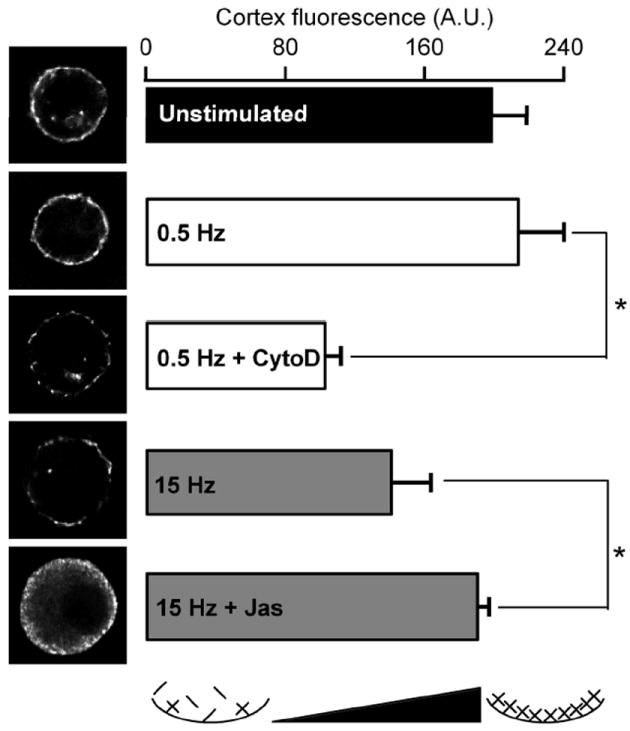
Chromaffin cells were stimulated as in figure 1, but immediately fixed after stimulation by perfusion with a paraformaldehyde-containing Ringer. Following fixation, cells were permeabilized by triton X-100 perfusion and stained with rhodamine-conjugated phalloidin to provide a fluorescence-based index of filamentous actin. Each cell was imaged as a stack with 0.25 μm z-steps. All cells in the data set were imaged with identical illumination, exposure and camera gain settings to enable quantitative cross-comparison of intensity levels. Equatorial images of representative cells for each condition are provided (left column) and quantified mean cortical staining (cell periphery and 1 μm under periphery) are provided in the bar-graph format (right column). Abbreviations “CytoD” and “Jas” represent cells treated with cytochalasin D and jasplakinolide respectively. An icon at the bottom of the right column represents the status of the cortical actin as a function of fluorescence intensity. n = 15 cells from 3 preparations for all conditions. Statistical significance for each mean parameter was determined by Student’s t-test and an asterisk in each category indicates statistical significance with respect to control (p < 0.05). Error bars represent SEM.
Next we tested the direct effects of cytochalasin D and jasplakinolide on catecholamine release. We measured single amperometric spike amplitude and charge as previously (Fig. 1). Cells were pre-treated with cytochalasin D as above and then stimulated with trains of APe waveforms at 0.5 Hz (Fig. 3ai). The cumulative probability plot for spike amplitude is presented along with paired control data for comparison (Fig. 3aii). The inset box-and-whisker plot indicates that the median spike amplitude was significantly enhanced with cytochalasin D treatment when compared to untreated control cells. Cytochalasin D also significantly increased spike charge. Furthermore, cytochalasin D treatment had no effect under 15 Hz stimulation, consistent with the already disrupted actin cortex observed at this activity level in figure 2 (see supplemental table S1 for complete data set). We then treated cells with jasplakinolide to stabilize the actin cortex, and stimulated with 15 Hz APe trains. A representative single recording is provided (Fig. 3bi). Single spikes were again quantified for each secretory event and the cumulative probability plot for their amplitude as well as the corresponding box-and-whisker median analysis plot are provided (Fig. 3bii). These data show that actin stabilization with jasplakinolide acted to significantly decrease spike amplitude when compared to untreated cells stimulated in the same manner (Fig. 3bii). Again, a significant decrease was also observed for spike charge with jasplakinolide treatment under 15 Hz stimulation while jasplakinolide had no effect on amperometric parameters acquired under 0.5 Hz stimulation (supplemental table S1). Thus, pharmacological manipulation of the actin cortex controls normal activity-specific secretory behavior. Whether achieved in an activity-dependent manner or by pharmacological perturbation, disruption of F-actin favors large, rapid spikes associated with full granule collapse. An intact actin cortex, as present under light electrical stimulation or due to pharmacological stabilization even under elevated stimulation, favors smaller and slower spikes that are characteristic of kiss-and-run exocytosis (Fulop and Smith, 2006).
Figure 3. Actin modifying reagents affect the kinetics of catecholamine release under 0.5 Hz stimulation.
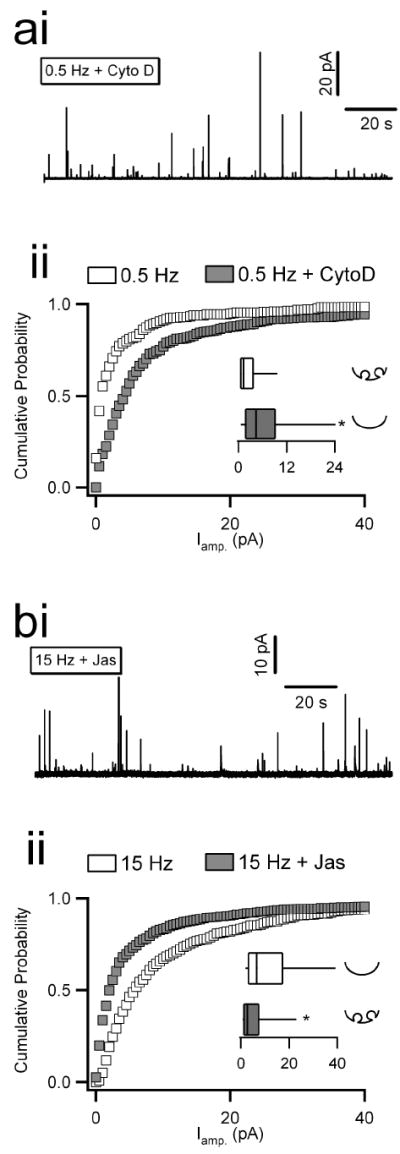
Chromaffin cells were voltage-clamped and stimulated as in previous figures. Cells were pre-treated with cytochalasin D (‘CytoD’; 2 μM for 10 minutes) and stimulated with trains of action potentials at 0.5 Hz. (ai) A sample raw record is plotted. Single amperometric spikes were analyzed as in figure 1. (aii) Cumulative probability plots for spike amplitude are provided for both control and CytoD data sets (n = 10 and 12 cells from 7 preparations for cytochalasin D and control conditions, respectively). The inset box-and-whisker plot shows that CytoD treatment acted to increase the median spike amplitude compared to control (p < 0.001). To test the role of actin stabilization under elevated firing, cells were treated with jasplakinolide (‘Jas’; 2 μM for 10 minutes) and stimulated at 15 Hz. (bi) A representative raw data record is provided. (bii) Spike amplitude was measured for Jasplakinolide treated cells and are co-plotted with control data collected from untreated cells stimulated at the same frequency. The inset box-and-whisker plot shows that jasplakinolide treatment acted to decrease the median spike amplitude compared to control (p < 0.001). (n = 10 and 15 cells from 7 preparations for jasplakinolide and control conditions, respectively).
Myosin II activity is required for the activity-dependent increase in amperometric spike amplitude
Stabilizing networked actin partially, but not completely, converted the spike parameter measured under 15 Hz to those measured under 0.5 Hz stimulation. We considered other potential contributors that may regulate the activity-dependent and F-actin-dependent shift in exocytic mode. A number of studies have suggested that myosin II may play a role in regulating the exocytic mode. For example, it was shown that potassium stimulation induces a calcium-dependent phosphorylation of the regulatory subunit of myosin light chain (Gutierrez et al., 1989), which serves to regulate the interaction of myosin with F-actin. Additionally, myosin II has been shown to be localized to the cell cortex, suggesting its role is close to the plasma membrane (Rose et al., 2002). Lastly, recent studies have shown that myosin II plays a role in the regulation of amperometric spike amplitude and total spike charge (Neco et al., 2004). Given these results, and that actin and myosin II represent a functional pairing, we investigated the role of myosin II activation and activity under 0.5 and 15 Hz APe stimulation.
We treated cells with either MLCK- or myosin II-specific inhibitors and analyzed amperometric events evoked under 0.5 and 15 Hz stimulation. Chromaffin cells were pretreated with the MLCK inhibitors ML7 (10 μM) or the M18 peptide (2 μM). ML7 is a cell-permeant molecule that binds to the ATP-binding pocket of the enzyme, blocking MLCK-mediated phosphorylation of myosin, a necessary requisite to myosin motor function (Saitoh et al., 1987). M18 is a cell-permeant peptide fragment that competitively competes for binding to the substrate binding pocket of the MLCK enzyme (Lukas et al., 1999; Neco et al., 2002). Additionally, we directly targeted myosin II by pretreatment with blebbistatin (25 μM), a specific myosin II inhibitor that blocks ATP-hydrolysis and thus motor activity. Chromaffin cells pretreated with the MLCK inhibitors ML7 or M18 showed a clear reduction in spike amplitude evoked under 15 Hz stimulation (Fig. 4a,b). ML7 and M18 decreased spike charge at 15 Hz, but had no effect at 0.5 Hz (supplemental table S1). Direct targeting of myosin II by pretreatment with blebbistatin mirrored these results; spike amplitude was decreased at 15 Hz (Fig. 4c), with no effect at 0.5 Hz (supplemental table S1). Furthermore, a combined treatment with an actin stabilizer and a MLCK inhibitor, followed by stimulation at 15 Hz completely converted catecholamine release kinetics; spike amplitude was statistically identical to that measured from untreated cells stimulated at 0.5 Hz (Fig. 4d). A similar negative result was obtained for spike charge (supplemental table S1). Thus, in addition to the reorganization of the actin cortex, elevated cell firing leads to activation of myosin II through MLCK. This series of events contributes to the transition in exocytic mode for activity-dependent catecholamine release.
Figure 4. Myosin II modifying reagents effect the kinetics of catecholamine release under 15 Hz stimulation.
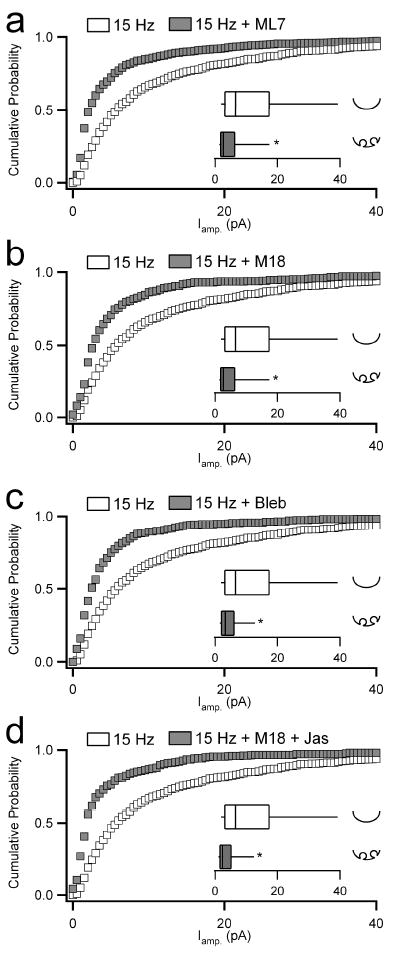
Chromaffin cells were voltage-clamped and stimulated as in previous figures. (a-b) Cells were pre-treated with agents that block MLCK activity (10 μM ML7 in a, n = 11 cells from 5 preparations; 2 μM M18 in b, n = 8 cells from 5 preparations) and stimulated with trains of action potentials at 15 Hz. Single amperometric spikes were analyzed and plotted as in previous figures. The inset box-and-whisker plots show that disruption of normal MLCK activity decreased median spike amplitude compared to control cells (p values < 0.001). (c) Likewise, cells pre-treated with blebbistatin (‘Bleb’, 25 μM, n = 8 cells from 6 preparations), an agent that directly blocks myosin II activity, resulted in decreased spike amplitude under 15 Hz stimulation by median analysis (p values < 0.001). (d) Co-treatment with M18 and Jas, to block MLCK and stabilize the actin cortex, resulted in less than an additive effect as determined by median analysis (p values < 0.001, n = 10 and 8 cells respectively from 6 preparations).
Variance analysis indicates actin and myosin II regulate fusion pore dilation
Cell capacitance measurements have long been used to measure granule fusion and provide an index of exocytosis in chromaffin cells (Neher and Marty, 1982). Recently, cell capacitance variance analysis has proven useful for detecting the accumulation of Ω-figures during kiss-and-run exocytosis (Fulop and Smith, 2006). Briefly, during kiss-and-run exocytosis, the Ω-form fusion intermediate adds an element to the normally simple equivalent circuit of a voltage-clamped chromaffin cell. In frequency-domain capacitance recordings, the additional circuit element includes the fusion pore conductance, which contributes to the Johnson noise of the circuit and increases the variance of the capacitance signal (Chen and Gillis, 2000). Thus, accumulation of Ω-figures during kiss-and-run exocytosis increases capacitance variance by an amount proportional to the total number of fusion events. During activity-dependent transition to full collapse exocytosis, electrical conductance through the Ω-figure fusion pore increases as it dilates to the point that the Ω-figure becomes indistinguishable from the cell surface, removing its contribution to the total capacitance variance. In this manner, kiss-and-run exocytosis stably elevates capacitance variance while full collapse exocytosis does not (Fulop and Smith, 2006).
We took advantage of this technique to determine if disrupting the actin cortex affected the accumulation of Ω-figures normally observed in kiss-and-run exocytosis under 0.5 Hz stimulation. The standard deviation of the capacitance signal was measured in response to stimulation (Fig. 5a, δ). Variance is then determined simply as the square of the standard deviation (δ2 [fF2]). In addition to control recordings, chromaffin cells were again treated with either cytochalasin D or jasplakinolide as described above and stimulated at 0.5 or 15 Hz. Data were pooled for each condition and mean variance values are plotted (Fig. 5b). As expected, action potential stimulation at 0.5 Hz resulted in relatively high capacitance variance, indicating the accumulation of Ω-figures. Despite eliciting robust granule fusion and catecholamine release, 15 Hz stimulation did not increase capacitance variance above unstimulated control values, indicative of full collapse exocytosis (Fig. 5b). Cytochalasin D treatment and stimulation at 0.5 Hz resulted in low capacitance variance, indicating fusion pore dilation to drive full collapse exocytosis while having no effect under 15 Hz stimulation where variance is low in control conditions (table S2). Conversely, jasplakinolide treatment kept variance at an elevated level even under 15 Hz stimulation which normally results in low variance but did not affect variance under conditions that normally exhibit high values (0.5 Hz stimulation, table S2). This result indicates that jasplakinolide blocks the transition from kiss and run exocytosis to full granule collapse that normally accompanies increased cell firing. These data are consistent with results obtained with the independent amperometric technique (Fig. 3) and indicate that at 0.5 Hz stimulation, filamentous actin plays a role in maintaining the restricted fusion pore associated with Ω-form exocytosis. Disruption of filamentous actin effects the transition to full collapse exocytosis.
Figure 5. Variance analysis predicts actin and myosin II as regulators of kiss and run exocytosis.
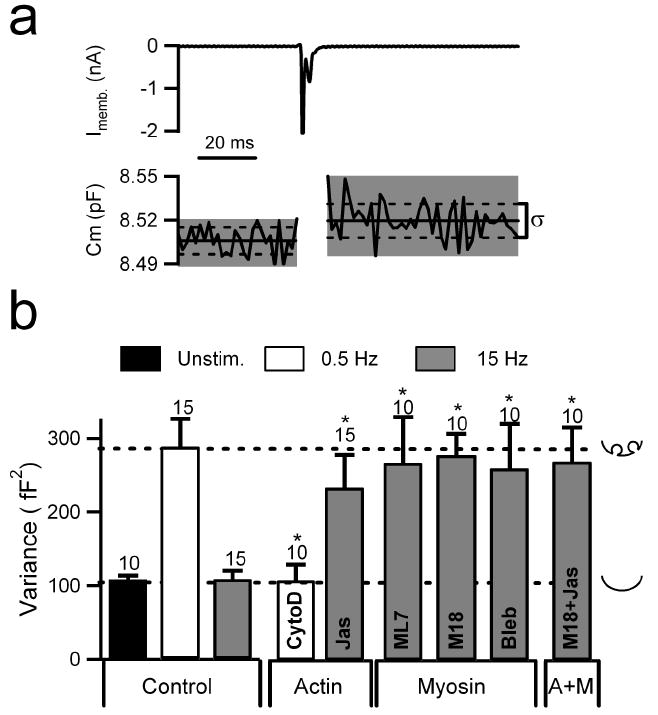
Capacitance variance was utilized to probe the roles of actin and myosin II in regulation of the Ω-figure. (a) Cells held in the perforated-patch configuration were stimulated with 0.5 or 15 Hz APe. Evoked membrane current (top plot) and measured cell capacitance (bottom plot) are shown for an example single APe stimulus. In response to Ca2+ influx, cell capacitance increases by approximately 15 fF, indicating the fusion of 8 or 9 granules with the cell surface. Solid lines indicate linear fits to pre- and post-pulse capacitance. Dotted lines indicate the standard deviation (δ) of these segments and variance (δ2) is calculated after each stimulation. (b) Variance was calculated throughout stimulus trains of APe delivered at 0.5 Hz or 15 Hz in control and cells treated with agents that perturb filamentous actin, MLCK or myosin II function. Concentrations for each agent were as in previous figures. Data are grouped according to pharmacological perturbation. Numbers of cells in each condition are indicated numerically above each category. Statistical significance was determined by Student’s t-test with a significance barrier (p) of 0.05. Error bars represent SEM. Significance with respect to the untreated control group at the same stimulus frequency is indicated as an asterisk. For comparison across conditions, dotted lines are drawn to indicate the control values for 0.5 Hz and 15 Hz stimulation. Icons to the right of the plot indicate the mode of fusion at each control variance level.
Next, we tested the role of myosin II under 15 Hz stimulation. Treatment with the MLCK inhibitors ML7 or M18, or myosin II inhibitor blebbistatin, all maintained high capacitance variance, indicating a persistence of kiss-and-run exocytosis (Fig. 5b). Furthermore, co-treatment with both jasplakinolide and M18, to stabilize actin and inhibit MLCK, did not produce an additive effect (Fig. 5b); measured variance was not greater than that measured in cells treated with jasplakinolide or M18 separately. This result indicates that jasplakinolide and M18 share a common mode of action, linking the role of actin and myosin II in the regulation of fusion pore dilation. Furthermore, none of these reagents altered variance under 0.5 Hz stimulation (see supplemental data table S2), indicating MLCK and myosin II play a role only under stimulation conditions leading to full granule collapse.
Endocytic uptake of fluorescent dextran is dependent upon actin and myosin II
We further tested the hypothesis that filamentous actin stabilizes a restricted fusion pore under kiss-and-run exocytosis. We utilized a fluorescence-based approach to probe for the diameter of the fusion/fission pore between cell membrane and newly forming endosomes under conditions with intact versus disrupted actin cortex. Seventy kD dextran (1 μM) has a molecular diameter of approximately 12 nm (Ioan et al., 2000) and has been shown to be excluded from endosomes as they pinch from the cell surface under kiss-and-run exocytosis in both chromaffin cells and pancreatic β cells (Takahashi et al., 2002; Fulop et al., 2005). Under 0.5 Hz stimulation, despite significant exocytic catecholamine release (Fig. 1), cells exhibited no accumulated intracellular fluorescence (left image, Fig. 6a; ○, Fig. 6bi), presumably due to exclusion of dextran uptake by the restricted fusion pore of the Ω-figure. However, stimulation at the same 0.5 Hz frequency in cytochalasin D-treated cells, resulted in significant internalization of dextran signal (●, Fig. 6bi). This result was not due to an enhanced secretory activity under cytochalasin D treatment; integrated amperometric currents showed that there was no difference in total catecholamine secretion following cytochalasin D treatment (assayed as total integrated amperometric current measured during the stimulation trains; control = 354±18, cytochalasin D = 353±29 pC). Thus disruption of filamentous actin led to dilation of the fusion pore to a size greater than the diameter of 70 kD dextran. Conversely, stimulation at 15 Hz resulted in a robust dextran fluorescence uptake (right image, Fig. 6a; ○, Fig. 6bii). Stabilization of filamentous actin (jas, ● in Fig. 6b) or blocking MLCK activity (ML7, ◆ in Fig. 6b) blocked dextran uptake under 15 Hz stimulation, despite levels of catecholamine release identical to that seen in control cells (assayed as above; control = 365±19, jasplakinolide = 366±30 and ML7 = 366±39 pC, respectively).
Figure 6. Dextran uptake indicates actin and myosin II regulate fusion pore dilation.
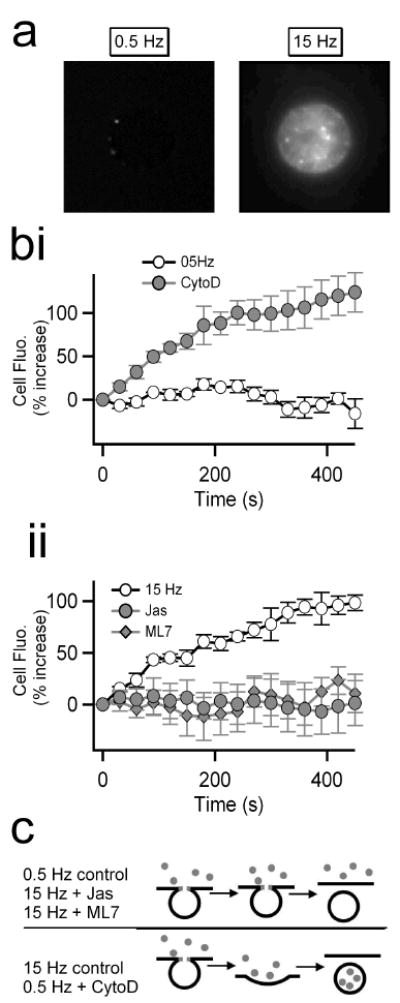
Chromaffin cells were stimulated with 0.5 or 15 Hz action potential waveforms and Texas Red-conjugated fluorescent 70 kD dextran (1 μM) was included in the bath solution as a fluid-phase marker. Cells were imaged during the stimulus train to probe for endosomal marker uptake. (a) Representative images show dye loading for each stimulus condition. (bi) Control cells stimulated at 0.5 Hz showed no 70 kD dextran uptake (n = 8 cells from 4 preparations). Pretreatment with 2 μM cytochalasin D resulted in dextran uptake during stimulation (n = 7 cells from 3 preparations). (bii) Control cells stimulated at 15 Hz showed strong uptake of 70 kD dextran while agents that stabilize actin (Jas) or inhibit MLCK (ML7) each blocked 70 kD dextran uptake (n = [cells/preparations] 8/4; 7/3 and 9/3 respectively). (c) A cartoon representation of the hypothesized modes of exocytosis under different stimulation conditions is pictured. Stimulation at 0.5 Hz or stabilization of F-actin results in kiss and run exocytosis while 15 Hz stimulation or F-actin disruption leads to full collapse.
Taken together, the data presented here demonstrate that activity-dependent disruption of the filamentous actin cortex and activation of myosin II play a critical role in the conversion from kiss-and-run to full collapse exocytosis in adrenal chromaffin cells (Fig. 6c).
Discussion
Previous evidence demonstrated a correlation between stimulation and actin cytoskeleton dynamics in chromaffin cells. Bath application of potent chemical secretagogues established a stimulation-dependent dissolution of the dense actin cortex, concluding that this disruption was necessary for the sustained recruitment of granules from the cell interior to the membrane where fusion and transmitter release occur (Nakata and Hirokawa, 1992; Trifaro et al., 1992; Vitale et al., 1995a; Giner et al., 2005). Our data allow for a refinement of this interpretation. Using physiological stimulation designed to mimic basal electrical splanchnic firing under sympathetic tone (action potential equivalent waveforms delivered at 0.5 Hz), we show sustained catecholamine release occurs without significant gross re-organization of the actin cortex. Previous work from our lab has shown that these stimulation conditions correlate to specific catecholamine release, but retention of the neuropeptide-containing granule core (Fulop et al., 2005). Amperometric, capacitance variance and dye uptake data presented here (Figs. 1, 5 and 6) collectively support the conclusion that exocytosis under low frequency stimulation conditions occurs through an Ω-form fusion transient. Thus, specific catecholamine release under low frequency stimulation occurs through kiss-and-run exocytosis with an intact actin cortex and inactive myosin II. Stimulation mimicking splanchnic firing under the sympathetic stress response (action potential waveforms delivered at 15 Hz) is then consistent with previous studies and shows disruption of the actin cortex and elevated catecholamine output. Again, collective data presented here obtained from amperometric spike analysis, capacitance variance measurements and large fluid-phase dye uptake show that exocytosis under 15 Hz stimulation occurs predominantly through a full collapse exocytic mode. This shift in exocytic mode is associated with an activity-dependent disruption of the actin cortex (Fig. 2). Indeed, pharmacological perturbation of the actin cortex establishes a causative relationship between cortex organization and the mode of exocytosis. Disruption of the F-actin cortex with cytochalasin D and stimulation at 0.5 Hz resulted in a shift away from kiss-and-run toward full collapse exocytosis by all parameters measured (amperometric spike analysis, capacitance variance analysis and fluid-phase dye uptake). Conversely jasplakinolide, an F-actin stabilizer, had the opposite result. Under 15 Hz stimulation, which normally results in full collapse exocytosis, jasplakinolide pretreatment favored maintenance of kiss-and-run exocytosis. An immediate interpretation of these data is that the actin cortex acts as a support scaffold to stabilize the Ω-figure fusion transient in kiss-and-run exocytosis. Disruption of F-actin, favors the collapse of the Ω-figure intermediate to transition to full collapse.
We further show that myosin II also plays a complementary role in this process. Previous studies have shown that different myosin isoforms play an important role in regulating exocytosis (Trifaro et al., 2007). Indeed, chemical stimulation causes the regulatory subunit of MLCK to become phosphorylated in a calcium-dependent manner proportional to the magnitude of the stimulus (Nicotera et al., 1986; Gutierrez et al., 1989). Furthermore, granule recruitment to the readily-releasable pool has been shown to require phosphorylation of MLCK and activation of myosin (Kumakura et al., 1994; Rose et al., 2002). Recent work found that expression of a phosphorylation-incompetent form of myosin II regulatory light chain decreased the kinetics of catecholamine release from single granules. These data demonstrate that myosin II is both required for vesicle mobility and also indicate a potential role of myosin II in the later stages of exocytosis on the single granule scale (Neco et al., 2002; Neco et al., 2004). Our data are consistent with, and build on, these data. We find that pharmacological perturbation of MLCK by either pretreatment with ML7 or by peptide transfection with M18, maintains kiss-and-run exocytosis in conditions that normally favor full collapse. Furthermore, direct inhibition of myosin II with blebbistatin mimicked this result, blocking the activity-dependent shift from kiss-and-run to full collapse exocytosis. Co-treatment of cells with M18 to block MLCK and jasplakinolide to stabilize actin resulted in a complete transition between modes of exocytosis by all parameters measured. The fact that the effects of M18 and jasplakinolide were not additive, and that they resulted quantitatively in a full conversion from full collapse to kiss-and-run under 15 Hz APe stimulation indicates they likely act cooperatively to regulate the mode of exocytosis.
Clearly, the cellular mechanism responsible for the activity-dependent shift in the mode of exocytosis does not end with actin and myosin II. Previous work has demonstrated a specific role for stimulus-dependent Ca2+ elevations in the regulation of actin cortex (Trifaro et al., 2000; Trifaro et al., 2002). Increased Ca2+ activates the actin regulatory protein scinderin. Calcium-bound scinderin then severs F-actin to disrupt the actin cortex (Rodriguez Del Castillo et al., 1990). Similarly, a second pathway may translate increased cell firing into disruption of the actin cortex. In the un-phosphorylated form, MARCKS (myristoylated alanine-rich C-kinase substrate) is bound to F-actin and stabilizes it in the polymerized form. Increased cell firing, and thus increased cytosolic Ca2+, may activate conventional isoforms of protein kinase C (PKC) to phosphorylate MARCKS. In the phosphorylated form, MARCKS dissociates from F-actin to favor actin depolymerization (Cuchillo-Ibanez et al., 2004). Indeed, previous work has shown that cytosolic calcium levels under 0.5 Hz APe stimulation are insufficient to activate PKC while 15 Hz APe stimulation does activate PKC. PKC activation correlates with a shift in exocytic mode from kiss-and-run to full collapse. Moreover, pharmacological block or activation of PKC shifts the mode of exocytosis independent of stimulation intensity (Fulop and Smith, 2006). These potential regulatory paths may begin to outline a cellular signaling cascade whereby elevated cell firing leads to a Ca2+-mediated activation of scinderin and PKC. PKC then could phospho-activate MARCKS and cause it to act in concert with scinderin to dissociate the actin cortex, thus allowing the transition from kiss-and-run to full collapse exocytosis. Activated PKC could then potentially phosphorylate MLCK (Clement et al., 1992; Vitale et al., 1995b) to initiate the myosin II-mediated contribution to the conversion in exocytotic mode. Further biophysical and biochemical experiments will be needed to test this potential pathway and to determine if it represents the cellular events responsible for the transition between sympathetic ‘breed and feed’ versus ‘fight or flight’ metabolic status.
Supplementary Material
Acknowledgments
The authors would like to thank Dr. Shyue-An Chan for expert help in design and execution of the experiments in this study as well as critical comment of the manuscript. The authors would also like to thank Katherine Trueblood-Doreian for critical comments. This work was supported by grants from the NSF (IBN-0344768) and NIH (1R01NS052123) to CS, (T32 HL 07887) for support of BD and (T32 HL 07653) for support of TF.
References
- Albillos A, Dernick G, Horstmann H, Almers W, Alvarez de Toledo G, Lindau M. The exocytotic event in chromaffin cells revealed by patch amperometry. Nature. 1997;389:509–512. doi: 10.1038/39081. [DOI] [PubMed] [Google Scholar]
- Alvarez de Toledo G, Fernandez-Chacon R, Fernandez JM. Release of secretory products during transient vesicle fusion. Nature. 1993;363:554–558. doi: 10.1038/363554a0. [DOI] [PubMed] [Google Scholar]
- Aravanis AM, Pyle JL, Tsien RW. Single synaptic vesicles fusing transiently and successively without loss of identity. Nature. 2003;423:643–647. doi: 10.1038/nature01686. [DOI] [PubMed] [Google Scholar]
- Artalejo CR, Elhamdani A, Palfrey HC. Sustained stimulation shifts the mechanism of endocytosis from dynamin-1-dependent rapid endocytosis to clathrin- and dynamin-2-mediated slow endocytosis in chromaffin cells. Proc Natl Acad Sci U S A. 2002;99:6358–6363. doi: 10.1073/pnas.082658499. [DOI] [PMC free article] [PubMed] [Google Scholar]
- Barclay JW, Craig TJ, Fisher RJ, Ciufo LF, Evans GJ, Morgan A, Burgoyne RD. Phosphorylation of Munc18 by protein kinase C regulates the kinetics of exocytosis. J Biol Chem. 2003;278:10538–10545. doi: 10.1074/jbc.M211114200. [DOI] [PubMed] [Google Scholar]
- Brandt B, Hagiwara S, Kidokoro Y, Miyazaki S. Action potentials in the rat chromaffin cell and effects of acetylcholine. J Physiol. 1976;263:417–439. doi: 10.1113/jphysiol.1976.sp011638. [DOI] [PMC free article] [PubMed] [Google Scholar]
- Chan SA, Smith C. Physiological stimuli evoke two forms of endocytosis in bovine chromaffin cells. J Physiology (London) 2001;537:871–885. doi: 10.1111/j.1469-7793.2001.00871.x. [DOI] [PMC free article] [PubMed] [Google Scholar]
- Chen P, Gillis KD. The noise of membrane capacitance measurements in the whole-cell recording configuration. Biophys J. 2000;79:2162–2170. doi: 10.1016/S0006-3495(00)76464-2. [DOI] [PMC free article] [PubMed] [Google Scholar]
- Chow RH, von Ruden L, Neher E. Delay in vesicle fusion revealed by electrochemical monitoring of single secretory events in adrenal chromaffin cells. Nature. 1992;356:60–63. doi: 10.1038/356060a0. [DOI] [PubMed] [Google Scholar]
- Clement O, Puceat M, Walsh MP, Vassort G. Protein kinase C enhances myosin light-chain kinase effects on force development and ATPase activity in rat single skinned cardiac cells. Biochem J. 1992;285(Pt 1):311–317. doi: 10.1042/bj2850311. [DOI] [PMC free article] [PubMed] [Google Scholar]
- Cuchillo-Ibanez I, Lejen T, Albillos A, Rose SD, Olivares R, Villarroya M, Garcia AG, Trifaro JM. Mitochondrial calcium sequestration and protein kinase C cooperate in the regulation of cortical F-actin disassembly and secretion in bovine chromaffin cells. J Physiol. 2004;560:63–76. doi: 10.1113/jphysiol.2004.064063. [DOI] [PMC free article] [PubMed] [Google Scholar]
- Elhamdani A, Palfrey HC, Artalejo CR. Quantal size is dependent on stimulation frequency and calcium entry in calf chromaffin cells. Neuron. 2001;31:819–830. doi: 10.1016/s0896-6273(01)00418-4. [DOI] [PubMed] [Google Scholar]
- Elhamdani A, Azizi F, Artalejo CR. Double patch clamp reveals that transient fusion (kiss-and-run) is a major mechanism of secretion in calf adrenal chromaffin cells: high calcium shifts the mechanism from kiss-and-run to complete fusion. J Neurosci. 2006;26:3030–3036. doi: 10.1523/JNEUROSCI.5275-05.2006. [DOI] [PMC free article] [PubMed] [Google Scholar]
- Fulop T, Smith C. Physiological stimulation regulates the exocytic mode through calcium activation of protein kinase C in mouse chromaffin cells. Biochem J. 2006;399:111–119. doi: 10.1042/BJ20060654. [DOI] [PMC free article] [PubMed] [Google Scholar]
- Fulop T, Smith C. Matching native electrical stimulation by graded chemical stimulation in isolated mouse adrenal chromaffin cells. Journal of Neuroscience Methods. 2007;166:195–202. doi: 10.1016/j.jneumeth.2007.07.004. [DOI] [PMC free article] [PubMed] [Google Scholar]
- Fulop T, Radabaugh S, Smith C. Activity-dependent differential transmitter release in mouse adrenal chromaffin cells. J Neurosci. 2005;25:7324–7332. doi: 10.1523/JNEUROSCI.2042-05.2005. [DOI] [PMC free article] [PubMed] [Google Scholar]
- Gillis KD. Techniques for Membrane Capacitance Measurements. In: Sakmann B, Neher E, editors. Single-Channel Recording. Second Edition. Chapter 7. New York: Plenum Press; 1995. pp. 155–198. [Google Scholar]
- Giner D, Neco P, Frances Mdel M, Lopez I, Viniegra S, Gutierrez LM. Real-time dynamics of the F-actin cytoskeleton during secretion from chromaffin cells. J Cell Sci. 2005;118:2871–2880. doi: 10.1242/jcs.02419. [DOI] [PubMed] [Google Scholar]
- Giner D, Lopez I, Villanueva J, Torres V, Viniegra S, Gutierrez LM. Vesicle movements are governed by the size and dynamics of F-actin cytoskeletal structures in bovine chromaffin cells. Neuroscience. 2007;146:659–669. doi: 10.1016/j.neuroscience.2007.02.039. [DOI] [PubMed] [Google Scholar]
- Gomez JF, Brioso MA, Machado JD, Sanchez JL, Borges R. New approaches for analysis of amperometrical recordings. Ann N Y Acad Sci. 2002;971:647–654. doi: 10.1111/j.1749-6632.2002.tb04544.x. [DOI] [PubMed] [Google Scholar]
- Gutierrez LM, Hidalgo MJ, Palmero M, Ballesta JJ, Reig JA, Garcia AG, Viniegra S. Phosphorylation of myosin light chain from adrenomedullary chromaffin cells in culture. Biochem J. 1989;264:589–596. doi: 10.1042/bj2640589. [DOI] [PMC free article] [PubMed] [Google Scholar]
- Habib KE, Gold PW, Chrousos GP. Neuroendocrinology of stress. Endocrinol Metab Clin North Am. 2001;30:695–728. vii–viii. doi: 10.1016/s0889-8529(05)70208-5. [DOI] [PubMed] [Google Scholar]
- Ioan C, Aberle T, Burchard W. Structure properties of dextran. 2. Dilute solution. Macromolecules. 2000;33:5730–5739. [Google Scholar]
- Kidokoro Y, Ritchie AK. Chromaffin cell action potentials and their possible role in adrenaline secretion from rat adrenal medulla. J Physiol. 1980;307:199–216. doi: 10.1113/jphysiol.1980.sp013431. [DOI] [PMC free article] [PubMed] [Google Scholar]
- Korn SJ, Horn R. Influence of sodium-calcium exchange on calcium current rundown and the duration of calcium-dependent chloride currents in pituitary cells, studied with whole cell and perforated patch recording. J Gen Physiol. 1989;94:789–812. doi: 10.1085/jgp.94.5.789. [DOI] [PMC free article] [PubMed] [Google Scholar]
- Kumakura K, Sasaki K, Sakurai T, Ohara-Imaizumi M, Misonou H, Nakamura S, Matsuda Y, Nonomura Y. Essential role of myosin light chain kinase in the mechanism for MgATP-dependent priming of exocytosis in adrenal chromaffin cells. J Neurosci. 1994;14:7695–7703. doi: 10.1523/JNEUROSCI.14-12-07695.1994. [DOI] [PMC free article] [PubMed] [Google Scholar]
- Lindau M, Alvarez de Toledo G. The fusion pore. Biochim Biophys Acta. 2003;1641:167–173. doi: 10.1016/s0167-4889(03)00085-5. [DOI] [PubMed] [Google Scholar]
- Lukas TJ, Mirzoeva S, Slomczynska U, Watterson DM. Identification of novel classes of protein kinase inhibitors using combinatorial peptide chemistry based on functional genomics knowledge. J Med Chem. 1999;42:910–919. doi: 10.1021/jm980573a. [DOI] [PubMed] [Google Scholar]
- Nakata T, Hirokawa N. Organization of cortical cytoskeleton of cultured chromaffin cells and involvement in secretion as revealed by quick-freeze, deep-etching, and double-label immunoelectron microscopy. J Neuroscience. 1992;12:2186–2197. doi: 10.1523/JNEUROSCI.12-06-02186.1992. [DOI] [PMC free article] [PubMed] [Google Scholar]
- Neco P, Gil A, Del Mar Frances M, Viniegra S, Gutierrez LM. The role of myosin in vesicle transport during bovine chromaffin cell secretion. Biochem J. 2002;368:405–413. doi: 10.1042/BJ20021090. [DOI] [PMC free article] [PubMed] [Google Scholar]
- Neco P, Giner D, Viniegra S, Borges R, Villarroel A, Gutierrez LM. New roles of myosin II during vesicle transport and fusion in chromaffin cells. J Biol Chem. 2004;279:27450–27457. doi: 10.1074/jbc.M311462200. [DOI] [PubMed] [Google Scholar]
- Neher E, Marty A. Discrete changes of cell membrane capacitance observed under conditions of enhanced secretion in bovine adrenal chromaffin cells. Proc Natl Acad Sci USA. 1982;79:6712–6716. doi: 10.1073/pnas.79.21.6712. [DOI] [PMC free article] [PubMed] [Google Scholar]
- Nicotera P, Hartzell P, Davis G, Orrenius S. The formation of plasma membrane blebs in hepatocytes exposed to agents that increase cytosolic Ca2+ is mediated by the. FEBS Lett. 1986;209:139–144. doi: 10.1016/0014-5793(86)81099-7. [DOI] [PubMed] [Google Scholar]
- Rahamimoff R, Fernandez JM. Pre- and postfusion regulation of transmitter release. Neuron. 1997;18:17–27. doi: 10.1016/s0896-6273(01)80043-x. [DOI] [PubMed] [Google Scholar]
- Richards DA, Bai J, Chapman ER. Two modes of exocytosis at hippocampal synapses revealed by rate of FM1-43 efflux from individual vesicles. J Cell Biol. 2005;168:929–939. doi: 10.1083/jcb.200407148. [DOI] [PMC free article] [PubMed] [Google Scholar]
- Rodriguez Del Castillo A, Lemaire S, Tchakarov L, Jeyapragasan M, Doucet JP, Vitale ML, Trifaro JM. Chromaffin cell scinderin, a novel calcium-dependent actin filament-severing protein. Embo J. 1990;9:43–52. doi: 10.1002/j.1460-2075.1990.tb08078.x. [DOI] [PMC free article] [PubMed] [Google Scholar]
- Rose SD, Lejen T, Casaletti L, Larson RE, Pene TD, Trifaro JM. Molecular motors involved in chromaffin cell secretion. Ann N Y Acad Sci. 2002;971:222–231. doi: 10.1111/j.1749-6632.2002.tb04466.x. [DOI] [PubMed] [Google Scholar]
- Saitoh M, Ishikawa T, Matsushima S, Naka M, Hidaka H. Selective inhibition of catalytic activity of smooth muscle myosin light chain kinase. J Biol Chem. 1987;262:7796–7801. [PubMed] [Google Scholar]
- Takahashi N, Kishimoto T, Nemoto T, Kadowaki T, Kasai H. Fusion pore dynamics and insulin granule exocytosis in the pancreatic islet. Science. 2002;297:1349–1352. doi: 10.1126/science.1073806. [DOI] [PubMed] [Google Scholar]
- Trifaro J, Rose SD, Lejen T, Elzagallaai A. Two pathways control chromaffin cell cortical F-actin dynamics during exocytosis. Biochimie. 2000;82:339–352. doi: 10.1016/s0300-9084(00)00193-0. [DOI] [PubMed] [Google Scholar]
- Trifaro JM, Vitale ML, Rodriguez DCA. Cytoskeleton and molecular mechanisms in neurotransmitter release by neurosecretory cells. Eur J Pharmacol. 1992;225:83–104. doi: 10.1016/0922-4106(92)90088-d. [DOI] [PubMed] [Google Scholar]
- Trifaro JM, Gasman S, Gutierrez LM. Cytoskeletal control of vesicle transport and exocytosis in chromaffin cells. Acta Physiol (Oxf) 2007 doi: 10.1111/j.1748-1716.2007.01808.x. [DOI] [PubMed] [Google Scholar]
- Trifaro JM, Lejen T, Rose SD, Pene TD, Barkar ND, Seward EP. Pathways that control cortical F-actin dynamics during secretion. Neurochem Res. 2002;27:1371–1385. doi: 10.1023/a:1021627800918. [DOI] [PubMed] [Google Scholar]
- Vitale ML, Seward EP, Trifaro J-M. Chromaffin cell cortical actin network dynamics control the size of the release-ready vesicle pool and the initial rate of exocytosis. Neuron. 1995a;14:353–363. doi: 10.1016/0896-6273(95)90291-0. [DOI] [PubMed] [Google Scholar]
- Vitale ML, Seward EP, Trifaro JM. Chromaffin cell cortical actin network dynamics control the size of the release-ready vesicle pool and the initial rate of exocytosis. Neuron. 1995b;14:353–363. doi: 10.1016/0896-6273(95)90291-0. [DOI] [PubMed] [Google Scholar]
- Vitale ML, Rodriguez Del Castillo A, Tchakarov L, Trifaro JM. Cortical filamentous actin disassembly and scinderin redistribution during chromaffin cell stimulation precede exocytosis, a phenomenon not exhibited by gelsolin. J Cell Biol. 1991;113:1057–1067. doi: 10.1083/jcb.113.5.1057. [DOI] [PMC free article] [PubMed] [Google Scholar]
- Wieland T. Peptides of Poisonous Amanita Mushrooms. 1. New York: Springer-Verlag; 1986. [Google Scholar]
- Wightman RM, Jankowski JA, Kennedy RT, Kawagoe KT, Schroeder TJ, Leszczyszyn DJ, Near JA, Diliberto EJ, Viveros OH. Temporally resolved catecholamine spikes correspond to single vesicle release from individual chromaffin cells. Proc Natl Acad Sci USA. 1991;88:10754–10758. doi: 10.1073/pnas.88.23.10754. [DOI] [PMC free article] [PubMed] [Google Scholar]
- Wilson JM, Coderre E, Renaud LP, Spanswick D. Active and passive membrane properties of rat sympathetic preganglionic neurones innervating the adrenal medulla. J Physiol. 2002;545:945–960. doi: 10.1113/jphysiol.2002.023390. [DOI] [PMC free article] [PubMed] [Google Scholar]
Associated Data
This section collects any data citations, data availability statements, or supplementary materials included in this article.