

Abstract
The results of recent studies suggest that the mouse Sac (saccharin preference) locus is identical to the Tas1r3 (taste receptor) gene. The goal of this study was to identify Tas1r3 sequence variants associated with saccharin preference in a large number of inbred mouse strains. Initially, we sequenced ~6.7 kb of the Tas1r3 gene and its flanking regions from six inbred mouse strains with high and low saccharin preference, including the strains in which the Sac alleles were described originally (C57BL/6J, Sacb; DBA/2J, Sacd). Of the 89 sequence variants detected among these six strains, eight polymorphic sites were significantly associated with preferences for 1.6 mm saccharin. Next, each of these eight variant sites were genotyped in 24 additional mouse strains. Analysis of the genotype–phenotype associations in all 30 strains showed the strongest association with saccharin preference at three sites: nucleotide (nt) −791 (3 bp insertion/deletion), nt +135 (Ser45Ser), and nt +179 (Ile60Thr). We measured Tas1r3 gene expression, transcript size, and T1R3 immunoreactivity in the taste tissue of two inbred mouse strains with different Tas1r3 haplotypes and saccharin preferences. The results of these experiments suggest that the polymorphisms associated with saccharin preference do not act by blocking gene expression, changing alternative splicing, or interfering with protein translation in taste tissue. The amino acid substitution (Ile60Thr) may influence the ability of the protein to form dimers or bind sweeteners. Here, we present data for future studies directed to experimentally confirm the function of these polymorphisms and highlight some of the difficulties of identifying specific DNA sequence variants that underlie quantitative trait loci.
Keywords: sweet, preference, phenotype, genotype, haplotype, QTL
Introduction
Mouse strains differ in their avidity to consume sweet solutions (Pelz et al., 1973; Stockton and Whitney, 1974; Ramirez and Fuller, 1976; Lush, 1989). Fuller (1974) demonstrated that most of the differences in saccharin preferences between C57BL/6J and DBA/2J strains depend on a single locus, Sac, with the dominant Sacb allele present in the C57BL/6J strain. Subsequent studies confirmed this finding in the BXD recombinant inbred strains, in crosses between the C57BL/6 and DBA/2 strains (Lush, 1989; Belknap et al., 1992; Phillips et al., 1994; Lush et al., 1995; Blizard et al., 1999) and in crosses between the C57BL/6ByJ and 129P3/J strains (Bachmanov et al., 1997). The Sac locus has been mapped to the subtelomeric region of mouse chromosome 4 (Phillips et al., 1994; Lush et al., 1995; Bachmanov et al., 1997; Blizard et al., 1999; Li et al., 2001) and more recently has been cloned positionally (Bachmanov et al., 2001). It corresponds to the Tas1r3 gene, which encodes a sweet taste receptor, T1R3 (Kitagawa et al., 2001; Max et al., 2001; Montmayeur et al., 2001; Nelson et al., 2001; Sainz et al., 2001; Li et al., 2002a; Nelson et al., 2002; Ariyasu et al., 2003; Damak et al., 2003).
Several studies have attempted to identify polymorphisms within the Tas1r3 gene that are equivalent to allelic variants of the Sac locus, by comparing Tas1r3 sequences in mouse strains with the most extreme differences in sweetener preferences (Bachmanov et al., 2001; Kitagawa et al., 2001; Max et al., 2001; Montmayeur et al., 2001; Sainz et al., 2001). However, saccharin intake in mice is a quantitative trait, and the Sac locus accounts for a different proportion of behavioral variation in different mouse crosses (Lush et al., 1995; Bachmanov et al., 1997; Blizard et al., 1999). The current study was designed to examine saccharin preference as a quantitative trait. First, we compared many inbred mouse strains with distant genealogies. Second, we examined genomic sequences including Tas1r3 exons, introns, and upstream and downstream regions, so that polymorphisms affecting amino acid composition, RNA splicing, or potential regulatory regions could be detected. Finally, we statistically compared the strength of the associations between the phenotype and genotype. The influence of these polymorphisms on Tas1r3 gene expression in taste tissue was evaluated by comparing two mouse strains with different Tas1r3 haplotypes and phenotypical Sac alleles.
Materials and Methods
General approach
The analysis of the associations of Tas1r3 sequence variants with saccharin preference was conducted in two stages. First, we selected three strains with strong saccharin preferences (C57BL/6J, CAST/Ei, and SWR/J) and three strains indifferent to saccharin (AKR/J, DBA/2J, and 129P3/J). In these six strains, an ~6.7 kb segment of genomic DNA, including ~2.4 kb upstream and ~1.0 kb downstream of Tas1r3, was sequenced. The analysis of saccharin preferences and sequence variants in these strains identified eight significant associations. For the second stage, genomic regions encompassing these eight variants were examined in an additional 24 strains of mice, and genotype–phenotype associations were then analyzed in all 30 strains.
Sweet preference tests
Mice from 28 inbred strains (129P3/J, A/J, AKR/J, BALB/cByJ, BUB/BnJ, C3H/HeJ, C57BL/6J, C57L/J, CAST/Ei, CBA/J, CE/J, DBA/2J, FVB/NJ, I/LnJ, KK/HlJ, LP/J, NOD/LtJ, NZB/BlNJ, P/J, PL/J, RBF/DnJ, RF/J, RIIIS/J, SEA/GnJ, SJL/J, SM/J, SPRET/Ei, and SWR/J) were purchased from The Jackson Laboratory (Bar Harbor, ME) and used in two-bottle preference tests with 1.6 mm saccharin and water. Because mice from the IS/Cam and ST/bJ strains used for Tas1r3 sequencing were not available from The Jackson Laboratory, we used 1.6 mm saccharin preference data for these strains obtained from a previous experiment that used a similar method (Lush, 1989). To justify combining the data from two different experiments, we analyzed correlations between 1.6 mm saccharin preference scores for a subset of 15 strains used in both studies. The correlation coefficient for strain means obtained in our study and in the study by Lush was r = +0.62 ( p = 0.013). Considering that different substrains were used in these two studies, and that genetic drift within strains could occur during the ≥11 years separating these two experiments, this result demonstrates consistency between laboratories.
The construction of drinking tubes and the testing procedure were described in detail previously (Bachmanov et al., 1996b). Groups of individually caged, 2- to 3-month-old male mice [n = 12 for each strain, except CAST/Ei, BUB/BnJ, NZB/BlNJ, and RBF/DnJ (n = 11) and BALB/cByJ (n = 10)] were offered for 48 hr two drinking tubes, one containing 1.6 mm saccharin and one containing water. The tube positions were reversed after 24 hr. For each 24 hr period, the volumes of water and solution consumed were recorded. Preference scores were calculated for each mouse as the average daily amount of saccharin consumed divided by the average daily total amount of fluid (saccharin plus water) consumed, multiplied by 100.
DNA sequencing and genotyping
Genomic DNA from 31 inbred mouse strains (129P3/J, A/J, AKR/J, BALB/cByJ, BUB/BnJ, C3H/HeJ, C57BL/6ByJ, C57BL/6J, C57L/J, CAST/Ei, CBA/J, CE/J, DBA/2J, FVB/NJ, I/LnJ, IS/CamEi, KK/HlJ, LP/J, NOD/LtJ, NZB/BlNJ, P/J, PL/J, RBF/DnJ, RF/J, RIIIS/J, SEA/GnJ, SJL/J, SM/J, SPRET/Ei, ST/bJ, and SWR/J) was purchased from the Mouse DNA Resource at The Jackson Laboratory. Sequences of the Tas1r3 region of the C57BL/6ByJ strain [used in our genetic mapping studies to clone positionally the Sac locus (Bachmanov et al., 1997, 2001; Li et al., 2001)] and the C57BL/6J strain (used in the strain survey of saccharin preferences described above) were identical, and so this sequence is referred to as C57BL/6 in this study.
Sixteen primer pairs were designed to encompass the 6675 bp Tas1r3 region, including 2482 bp upstream of the putative methionine initiation codon and 1046 bp downstream of the putative termination codon (primer sequences and PCR conditions are available on request). These upstream and downstream regions include most of the intergenic intervals between the Tas1r3 coding region and two flanking genes, Dvl and BC002216 (GenBank accession number NM_024472) (Bachmanov et al., 2001; Li et al., 2002b). Genomic DNA was used as a template to generate PCR products, which were sequenced. The majority of sequencing was conducted at Pfizer Global Research and Development (Alameda, CA) with additional sequencing conducted by the University of Pennsylvania Sequencing Facility (Philadelphia, PA). The Sequencher software program (Genecodes, Ann Arbor, MI) was used to assemble and align sequences (GenBank accession numbers AF550928 to AF551332) and to identify sequence variants. To define nucleotide (nt) positions of the variable sites, we aligned the C57BL/6 genomic sequences of Tas1r3 (GenBank accession number AF311386) and BAC RPCI23-118E21 (GenBank accession number AF389853). Polymorphism sites were numbered two ways. First, polymorphism positions were numbered using the putative start codon of Tas1r3 as +1. Second, because of the large number of insertions and deletions among inbred strains, polymorphism positions were also given relative to their position in BAC 118E21. To identify the correct nucleotides at position +661 in the A/J strain and at position +1309 in the 129/P3J strain, we consulted the Celera Discovery System. The deletion/insertion variable sites at nt −791 and +3479 were genotyped using simple sequence length polymorphism and single-stranded conformational polymorphism methods.
Proportion of transitions and transversions
The ratio of transitions and transversions found in the Tas1r3 gene was compared with the rates of nucleotide substitutions in the whole mouse genome using a χ2 test [>39,000 single nucleotide polymorphisms (SNPs); Mouse Phenome Database].
Statistical analyses of genotype–phenotype relationships
Preference scores of individual mice were averaged to obtain means for each strain, and the means were used in the statistical analyses. The relationship between Tas1r3 sequence variants and saccharin preferences was analyzed using an approach similar to a previous study (Long et al., 1998). The first stage of the analysis was conducted using all polymorphisms detected in six strains (129P3/J, AKR/J, C57BL/6J, CAST/Ei, DBA/2J, and SWR/J). For each polymorphic site, the effect of the nucleotide variant on saccharin preference was estimated using one-way ANOVA. For this initial stage of analysis, we have chosen arbitrarily the threshold of statistical significance to be p < 0.01 as a compromise between the standard threshold of p < 0.05 (which could produce approximately five false positives for 89 comparisons made here) and a Bonferroni correction ( p < 0.05/89 ≈ 0.00056), which would be too conservative in the initial stage of analysis using a small number of strains. All polymorphisms analyzed in the second stage had only two variants among the 30 strains; therefore, we used t tests to analyze genotype–phenotype relationships. The strains were grouped by sequence variant at each of the eight polymorphic sites, and the saccharin preferences of the two groups of strains were compared by two-tailed t test. The obtained p values were changed to their negative base-10 logarithms for ease of presentation, where needed. All analyses were done using Statistica software (StatSoft, Tulsa, OK).
Heritability of saccharin preference was calculated as the ratio SSamong strains/SStotal based on the sums of squares (SS) obtained in a one-way ANOVA assessing the effect of strain and using preference scores of individual mice (Belknap, 1998). Similarly, the percentage of genetic variation explained by alleles at the Tas1r3 polymorphic sites was calculated as the ratio SSTas1r3 genotype/SStotal based on the results of a one-way ANOVA assessing the effect of the Tas1r3 genotype and using the mean preference scores for the mouse strains.
Bioinformatic analyses of DNA variants
We used several approaches to identify the potential biological significance of the eight variant sites associated with saccharin preferences. The three variant sites residing within coding regions were examined to determine whether they were synonymous (encoded the same amino acid) or nonsynonymous (encoded different amino acids). The variant sites upstream of the putative methionine initiation codon and the variant site downstream of the putative termination codon were examined using several methods. First, the sequences were analyzed to determine whether the variants were contained within repetitive elements, using the computer program Repeatmasker (A. F. A. Smit and P. Green, unpublished results). Second, each variant site and the flanking region was examined for alterations in putative transcription factor-binding sites. We used the computer program MatInspector 2.2 (Quandt et al., 1995) in conjunction with the Transfac 4.0 database of transcription factors and their binding sites (Wingender et al., 2000). Third, the sequenced upstream and downstream regions of all three members of the mouse Tas1r family [Tas1r1 (GenBank accession number AL611927), Tas1r2, and Tas1r3 (GenBank accession number AF389853)] were aligned, and conserved elements were identified based on the sequence similarity assessed using a nucleic acid dot plot (Maizel and Lenk, 1981). Similarly, to identify elements conserved between human TAS1R3 (GenBank accession number AL139287) and mouse Tas1r3 (GenBank accession number AF389853) genes, the upstream and downstream regions of these genes were aligned using PipMaker (Schwartz et al., 2000). Then we determined whether these regions conserved among mouse Tas1r genes or between mouse and human Tas1r3 orthologs contained any of the eight sequence variants associated with saccharin preference. By examining the exon/intron boundaries, we determined whether any variant site interrupted a splice junction site. Finally, gene promoter regions were predicted using the computer program Promoter 2.0 (Knudsen, 1999), and we determined whether any of the eight DNA sequence variants were contained within these sites.
Subjects and tissues used to assess Tas1r3 gene expression
We tested the hypothesis that the polymorphisms that predict saccharin intake act by altering Tas1r3 gene expression, transcript size, or protein abundance in taste tissue. Lingual tissues used for real-time PCR, Northern blot hybridization, and immuncytochemistry were collected from killed C57BL/6J (B6) and 129P3/J (129) mice. Tissues containing fungiform, foliate, and circumvallate taste papillae and control tissue (lingual epithelium without taste papillae) were dissected as described previously (Huang et al., 1999).
Northern blot hybridization
Isolation of mouse total RNA from circumvallate and foliate taste papillae, electrophoresis, transfer, fixation, hybridization, washing, and exposure were as described (Huang et al., 1999), with slight modifications. The 32P-labeled Tas1r3 probe was generated by random nonamer priming of a 1.3 kb cDNA fragment of mouse T1R3 corresponding to the 5′ end coding sequence using Exo (-) Klenow polymerase in the presence of (α-32P)-dCTP. Ethidium bromide-stained 18S and 28S ribosomal RNA served as a control for RNA quality and gel loading.
Real-time PCR
Total RNA was extracted from the lingual tissues of 10 mice (5 mice from each strain) using the Absolutely RNA Microprep kit (Stratagene, La Jolla, CA). First-strand synthesis of cDNA was conducted following the directions of the manufacturer (SuperScript III; Invitrogen, Carlsbad, CA). Transcribed cDNA (1 μl/well) was transferred to a PCR 96-well optical reaction plate. Each well was supplemented with predeveloped TaqMan assay reagents (primer and fluorescent probe) and Universal PCR Master Mix to a final volume of 20 μl. The PCR product was heated to 50°C for 2 min and 95°C for 10 min, and then 40 amplification cycles were conducted at 95°C for 15 sec and 60°C for 60 sec. DNA amplification was performed in an ABI PRISM 7000 Sequence Detection System (Applied Biosystems, Foster City, CA), detecting fluorescence (500–560 nm) after laser light excitation. PCR cycle time values represent the time at which the emitted fluorescence increased above threshold. Primers were designed to span an intron to reduce genomic DNA contamination. Genomic contamination was assessed by including additional samples in the assay that contained no reverse transciptase. Tas1r3 gene expression was normalized as described previously (Zehnder et al., 2003) to a ubiquitously expressed control gene (TATA box-binding protein; Tbp; GenBank accession number NM_013684) and a taste receptor cell-specific gene involved in signal transduction (guanine nucleotide-binding protein 13, gamma; Gng13; GenBank accession number NM_022422). Samples in which there was little or no housekeeping gene expression were excluded from additional analysis. The significance of differences in Tas1r3 expression between inbred strains was assessed by a two-way ANOVA using tissue and strain as factors.
Immunocytochemistry
Polyclonal antisera against a hemocyanin-conjugated T1R3 peptide (aa 45–62) were raised in rabbits. Frozen sections of mouse lingual tissue (previously fixed in 4% paraformaldehyde and cryoprotected in 20% sucrose) were blocked in 3% BSA, 0.3% Triton X-100, 2% goat serum, and 0.1% sodium azide in PBS for 1 hr at room temperature and then incubated for 16 hr at 4°C with antisera against T1R3 (1:800). The secondary antibodies were Cy3-conjugated goat anti-rabbit Ig for T1R3. T1R3 immunoreactivity was blocked by preincubation of the antisera with the corresponding synthetic peptide at 10 μm. Preimmune serum did not show any immunoreactivity.
Results
Saccharin preference
Responses to 1.6 mm saccharin in the two-bottle choice tests ranged from indifference (i.e., mice consumed similar amounts of saccharin and water and their preference scores were close to 50%) to a strong preference (i.e., mice consumed almost 100% of their total fluid intake as saccharin). The strain differences were highly significant (F(27,299) = 25.7; p < 10−16; one-way ANOVA) and heritable (h2 = 0.70). For the initial analysis of the genotype–phenotype associations, we selected three strains with strong saccharin preferences (C57BL/6, CAST/Ei, and SWR/J; preference scores, 91 ± 1, 97 ± 1, and 93 ± 1%, respectively) and three strains indifferent to saccharin (129P3/J, AKR/J, and DBA/2J; preference scores, 58 ± 2, 41 ± 8, and 52 ± 2%, respectively).
Sequences of the Tas1r3 region in six strains with high or low saccharin preferences
Comparison of DNA sequences of the Tas1r3 region in the six inbred mouse strains with high or low saccharin preferences identified 89 sequence variants (Table 1), of which 86 (97%) had two alleles and 2 (2%) had three alleles. One polymorphism was an imperfect dinucleotide repeat with five alleles. Of all polymorphic sites, 77 contained SNPs (87% of polymorphic sites) and 12 contained deletions/insertions (13% of polymorphic sites); one polymorphic site with three alleles comprised both an SNP and a deletion/insertion. The DNA sequence variants in 58 cases (65%) occurred in one of six strains; in 21 cases (24%), they occurred in two of six strains, and in 9 cases (10%) they occurred in three of six strains. The proportions of transitions and transversions were similar to those of the whole mouse genome (χ2 = 0.32; observed rates for each substitution: A or G = 34.6%, C or T = 34.3%, A or C = 8.5%, G or T = 8.5%, A or T = 8.2%, C or G = 6.0%). Of the nucleotide substitutions in protein coding regions, 8 of 20 (40%) were nonsynonymous (Table 2).
Table 1.
Polymorphisms within the Tas1r3 region of mouse strains with high (C57BL/6, CAST/Ei, and SWR/J) and low (129P3/J, AKR/J, and DBA/2J) saccharin preferences
| Positiona | AF389853b | Location | C57BL/6c | SWR/J | CAST/Ei | 129P3/J | DBA/J | AKR/J |
|---|---|---|---|---|---|---|---|---|
| −2406 | 50853 | 5′ | G | T | T | T | T | T |
| −2386 | 50832 | 5′ | T | T | T | A | A | A |
| −2343 | 50790 | 5′ | C | DEL | C | DEL | DEL | DEL |
| −2342 | 50789 | 5′ | A | G | G | G | G | G |
| −2330 | 50777 | 5′ | A | G | A | G | G | G |
| −2323 | 50770 | 5′ | A | G | G | G | G | G |
| −2315 | 50762 | 5′ | G | DEL | G | DEL | DEL | DEL |
| −2198 | 50654 | 5′ | DEL | T | T | T | T | T |
| −2181 | 50629 | 5′ | G | T | T | T | T | T |
| −2002 | 50450 | 5′ | C | T | T | T | T | T |
| −1994 | 50442 | 5′ | C | A | A | A | A | A |
| −1845 | 50293 | 5′ | A | G | A | G | G | G |
| −1820 | 50268 | 5′ | G | A | G | A | A | A |
| −1803 | 50251 | 5′ | G | A | G | A | A | A |
| −1791 | 50239 | 5′ | C | T | C | T | T | T |
| −1786 | 50234 | 5′ | G | A | A | A | A | A |
| −1558 | 50006 | 5′ | G | UN | A | UN | G | G |
| −1488 | 49936 | 5′ | A | UN | G | UN | G | G |
| −1417 | 49865 | 5′ | A | UN | G | UN | G | G |
| −1414 | 49863 | 5′ | DEL | UN | TT | UN | TT | TT |
| −1407 | 49856 | 5′ | C | UN | T | UN | T | T |
| −1317 | 49767 | 5′ | G | UN | A | G | G | G |
| −1284 | 49734 | 5′ | G | UN | G | G | A | A |
| −1273 | 49723 | 5′ | A | A | G | A | A | A |
| −1260 | 49710 | 5′ | C | C | A | C | C | C |
| −1200 | 49650 | 5′ | A | T | A | T | T | T |
| −1130 | 49580 | 5′ | A | G | A | G | G | G |
| −1078 | 49529 | 5′ | A | G | G | G | G | G |
| −1032 | 49482 | 5′ | T | G | G | G | G | G |
| −967 | 49417 | 5′ | C | T | T | T | T | T |
| −962 | 49412 | 5′ | T | C | C | C | C | C |
| −912 | 49362 | 5′ | C | C | T | C | C | C |
| −827 | 49277 | 5′ | AG | AG | DEL | AG | AG | AG |
| −822 | 49272 | 5′ | A | A | G | A | A | A |
| −817 | 49267 | 5′ | A | G | G | G | G | G |
| −791 | 49241 | 5′ | AGG | AGG | AGG | DEL | DEL | DEL |
| −753 | 49203 | 5′ | T | T | C | T | T | T |
| −564 | 49014 | 5′ | G | C | G | C | C | C |
| −349 | 48799 | 5′ | T | C | T | T | T | T |
| −320 | 48770 | 5′ | 12 bp | DEL | 12 bp | DEL | DEL | DEL |
| −267 | 48718 | 5′ | G | DEL | A | DEL | DEL | DEL |
| −162 | 48613 | 5′ | G | C | C | C | C | C |
| −138 | 48588 | 5′ | A | A | A | G | G | G |
| −104 | 48554 | 5′ | G | G | A | G | G | G |
| −32 | 48482 | 5′ | C | T | C | T | T | T |
| −30 | 48480 | 5′ | C | T | T | T | T | T |
| −9 | 48459 | 5′ | C | A | C | C | C | C |
| 135 | 48316 | Exon 1 | A | A | A | G | G | G |
| 163 | 48288 | Exon 1 | A | A | A | G | G | G |
| 179 | 48272 | Exon 1 | T | T | T | C | C | C |
| 182 | 48269 | Exon 1 | C | T | C | T | T | T |
| 186 | 48265 | Exon 1 | C | T | T | T | T | T |
| 264 | 48187 | Intron | DEL | G | G | G | G | G |
| 271 | 48180 | Intron | A | G | G | G | G | G |
| 272 | 48179 | Intron | G | G | A | G | G | G |
| 319 | 48139 | Exon 2 | T | C | T | C | C | C |
| 556 | 47902 | Exon 2 | A | A | G | A | A | A |
| 661 | 47799 | Intron | T | T | T | C | C | C |
| 701 | 47759 | Exon 3 | T | C | C | C | C | C |
| 974 | 47486 | Exon 3 | A | G | G | G | G | G |
| 978 | 47482 | Exon 3 | C | T | C | C | C | C |
| 1309 | 47151 | Exon 3 | G | A | A | A | A | A |
| 1466 | 46994 | Exon 3 | C | T | C | C | C | C |
| 1874 | 46586 | Intron | A | A | DEL | A | A | A |
| 1897 | 46563 | Intron | A | C | C | C | C | C |
| 2061 | 46399 | Intron | G | G | DEL | G | G | G |
| 2098 | 46362 | Intron | G | G | G | C | G | G |
| 2106 | 46354 | Intron | A | A | G | A | A | A |
| 2216 | 46244 | Exon 6 | A | A | G | A | A | A |
| 2405 | 46055 | Exon 6 | T | C | C | C | C | C |
| 2474 | 45985 | Exon 6 | G | A | A | A | A | A |
| 2531 | 45929 | Exon 6 | A | A | G | A | A | A |
| 2651 | 45809 | Exon 6 | A | A | T | A | A | A |
| 2656 | 45762 | Exon 6 | T | C | T | T | T | T |
| 2698 | 45762 | Exon 6 | T | A | T | C | C | C |
| 3145 | 45315 | Exon 6 | G | A | A | A | A | A |
| 3240 | 45220 | 3′ | G | G | A | G | G | G |
| 3434 | 45026 | 3′ | T | C | T | C | C | C |
| 3479 | 44981 | 3′ | A | A | A | DEL | DEL | DEL |
| 3483 | 44977 | 3′ | C | T | C | T | T | T |
| 3493 | 44967 | 3′ | C | G | G | G | G | G |
| 3581 | 44870 | 3′ | (TG)23 | (TG)15 | (TG)20 | (TG)23 | (TG)16 | (TG)16 |
| 3609 | 44851 | 3′ | G | A | G | G | G | G |
| 3693 | 44767 | 3′ | T | T | C | T | T | T |
| 3724 | 44736 | 3′ | T | T | C | T | T | T |
| 3737 | 44723 | 3′ | G | A | G | G | G | G |
| 3781 | 44679 | 3′ | C | T | C | T | T | T |
| 3782 | 44678 | 3′ | A | G | A | G | G | G |
| 4201 | 44259 | 3′ | A | G | A | G | G | G |
The 12 bp sequence at polymorphic position −320 is GCAGCTTCTTTT. The dinucleotide repeat at position +3581 is imperfect in the C57BL/6 and SWR/J strains, with G substituted with A in the second TG repeat.
DEL, Deletion; UN, unknown. Polymorphisms significantly associated with saccharin preference are shown in bold.
Polymorphism positions relative to the first nucleotide in the putative start codon of Tas1r3.
Position in genomic sequence (GenBank accession number AF389853).
Sequences of the C57BL/6J and C57BL/6ByJ strains were identical and shown here as C57BL/6.
Table 2.
Sequence variants within exons of the Tas1r3 gene of six mouse strains
| Position (nt) | Codon | Amino acid |
|---|---|---|
| +135 | TCA>TCG | Ser45Ser |
| +163 | ACA>GCA | Thr55Ala |
| +179 | ATC>ACC | Ile60Thr |
| +182 | CCG>CTG | Pro61Leu |
| +186 | TGC>TGT | Cys62Cys |
| +319 | CTT>CTC | Leu68Leu |
| +556 | TCA>TCG | Ser147Ser |
| +701 | AGT>AGC | Ser168Ser |
| +974 | GTA>GTG | Val259Val |
| +978 | CGC>TGC | Arg261Cys |
| +1309 | CGG>CAG | Arg371Gln |
| +1466 | CAC>CAT | His423His |
| +2216 | CCA>CCG | Pro545Pro |
| +2405 | GGT>GGC | Gly608Gly |
| +2474 | GGG>GGA | Gly616Gly |
| +2531 | ACA>ACG | Thr650Thr |
| +2651 | GTA>GTT | Val690Val |
| +2656 | TTG>TCG | Leu692Ser |
| +2698 | ATC>AAC>ACC | Ile706Asn706Thr |
| +3145 | GGA>GAA | Gly855Glu |
All nucleotide positions are relative to the putative ATG start codon of the Tas1r3 gene. See Table 1 for sequence variants by inbred strain.
Frequencies of polymorphisms among strain pairs are shown in Table 3. There were substantial sequence differences between the high-preferring and low-preferring strains (24–68% of the 89 polymorphic sites). Sequence variability within the group of high-saccharin-preferring strains was higher (57–68%) than among the low-preferring strains (2–7%). The sequences of the low-preferring strains (129P3/J, AKR/J, and DBA/2J) were similar, although the strains are only related distantly (Beck et al., 2000). These three strains may have inherited this chromosomal region from a common ancestor, and the small percentage of polymorphisms among them may represent mutations accumulated during ~100 years of independent breeding of these strains.
Table 3.
Frequencies (%) of Taslr3 polymorphisms among six mouse strains
| Strain | C57BL/6 | CAST/Ei | SWR/J | 129P3/J | AKR/J |
|---|---|---|---|---|---|
| CAST/Ei | 57 | ||||
| SWR/J | 68 | 57 | |||
| 129P3/J | 66 | 59 | 24 | ||
| AKR/J | 68 | 57 | 23 | 7 | |
| DBA/2J | 68 | 56 | 20 | 5 | 2 |
The percentage of variable sequence sites that were polymorphic within each pair of strains is shown. Pairings between high-preference and low-preference strains are shown in bold.
Polymorphisms associated with saccharin preferences in six strains
Of the 89 polymorphic sites, 8 sites were significantly associated with saccharin preference (F(1,4) = 67.3; p = 0.0012) (Fig. 1). Each of the eight polymorphisms had only two sequence variants, one of which was found in all three high-saccharin-preferring strains, and the other one was found in all three low-preferring strains (Table 1). Therefore, these eight variable sites formed two haplotypes found either only in the high-saccharin-preferring strains or only in the low-saccharin-preferring strains.
Figure 1.

Relationship between polymorphisms in the Tas1r3 region and saccharin preferences in six mouse strains (129P3/J, AKR/J, C57BL/6, CAST/Ei, DBA/2J, and SWR/J). The x-axis shows the polymorphism positions relative to the first nucleotide in the putative start codon of Tas1r3 (indicated by a vertical line). The y-axis shows the negative decimal logarithm of p values obtained in one-way ANOVA tests assessing the effect of genotype for each polymorphism on 1.6 mm saccharin preference. A dotted horizontal line shows the threshold of statistical significance ( p = 0.01). For the eight polymorphisms significantly associated with saccharin preference, nucleotides (high preferring/low preferring) and their positions are shown; for coding regions, corresponding amino acids and their positions are shown in parentheses. At the bottom, asterisks indicate positions of these eight polymorphisms relative to the Tas1r3 coding and noncoding regions.
Three of the eight polymorphisms significantly associated with saccharin preference were in the 5′ region of Tas1r3, three were in exon 1, one was in intron 2, and one was in the 3′ region (Table 1). Among the three SNPs in exon 1, one was synonymous and two predicted an amino acid change.
Of the four variant sites located in the upstream and downstream regions, two sites did not alter putative transcription factor-binding sites. The SNP at nt −2383 in the high-preferring strains was a part of a predicted binding site for the transcription factor DPCR3HD, a cut-like home-odomain protein. In the low-preferring strains, this SNP was a part of a binding site for hepatocyte nuclear factor-3. The polymorphic site at nt −791 in strains with high-saccharin preferences was a part of a gut-enriched Krueppel-like factor-binding site, but a deletion at this position in the low-preferring strains eliminated this transcription factor-binding site. In addition, the −791 polymorphism was located at the beginning of a repetitive DNA element (long terminal repeat/mammalian retrotransposon like), but none of the other three variants were within repetitive elements.
The upstream and downstream DNA sequences had regions conserved between human TAS1R3 and mouse Tas1r3, and there were also few stretches of conserved DNA sequence among the three members of the Tas1r family. However, none of the eight variant sites were found within these conserved regions. None of the eight DNA sequence variants interrupted an intron/exon boundary or a predicted promoter motif.
Polymorphisms associated with saccharin preferences in 30 strains
The genomic regions encompassing the eight polymorphisms significantly associated with saccharin preference in the six high-or low-sachharin-preferring strains were examined in an additional 24 inbred mouse strains, and genotype–phenotype associations were analyzed using all 30 strains. Twenty-six of the 30 strains had alleles of the eight polymorphic sites retained as the two haplotypes found in the high- and low-preferring strains (Table 4). Four strains (CE/J, I/LnJ, RF/J, and SM/J) had a broken haplotype, with three new combinations of genotypes at the polymorphic sites. Therefore, there were five unique strain distribution patterns of genotypes for the eight polymorphisms. As a result, analysis of the genotype–phenotype relationships allowed us to distinguish the polymorphic sites based on the strength of their associations with saccharin preferences (Fig. 2). All sites showed a highly significant association with saccharin preference (0.000065 ≥ p ≥ 0.00000000012), with three variant sites (nt − 791, nt + 135, and nt + 179) showing the strongest association. When inbred mouse strains were grouped by genotype at these three variant sites, there was a large difference in saccharin preference between groups. However, within each group, there was also substantial variation in preference (Fig. 3). Overall, variation in the Tas1r3 haplotype for these three polymorphic sites explained 78% of the genetic variation in saccharin preferences among the inbred mouse strains; the remaining 22% of genetic variance is attributed to the contribution of other genes.
Table 4.
Genotypes of 30 mouse strains at eight polymorphic sites in the Tas1r3 region associated with 1.6 mm saccharin preference (%)
| Inbred strain | Sac pref | −2383 | −791 | −138 | +135 | +163 | +179 | +652 | +3479 |
|---|---|---|---|---|---|---|---|---|---|
| CAST/Ei | 97 | T | AGG | A | A | A | T | T | A |
| FVB/NJ | 96 | T | AGG | A | A | A | T | T | A |
| CE/J | 96 | A | AGG | G | A | A | T | C | Del |
| SJL/J | 93 | T | AGG | A | A | A | T | T | A |
| SWR/J | 93 | T | AGG | A | A | A | T | T | A |
| C57BL/6 | 91 | T | AGG | A | A | A | T | T | A |
| ST/bJa | 91 | T | AGG | A | A | A | T | T | A |
| I/LnJ | 91 | T | AGG | A | A | G | T | C | Del |
| SM/J | 91 | T | AGG | A | A | G | T | C | Del |
| P/J | 89 | T | AGG | A | A | A | T | T | A |
| RBF/DnJ | 89 | T | AGG | A | A | A | T | T | A |
| C57L/J | 88 | T | AGG | A | A | A | T | T | A |
| KK/HlJ | 83 | T | AGG | A | A | A | T | T | A |
| SEA/GnJ | 83 | T | AGG | A | A | A | T | T | A |
| IS/Cama | 83 | T | AGG | A | A | A | T | T | A |
| NOD/LtJ | 81 | T | AGG | A | A | A | T | T | A |
| SPRET/Ei | 77 | T | AGG | A | A | A | T | T | A |
| NZB/B1NJ | 74 | T | AGG | A | A | A | T | T | A |
| PL/J | 73 | A | Del | G | G | G | C | C | Del |
| RIIIS/J | 71 | A | Del | G | G | G | C | C | Del |
| C3H/HeJ | 65 | A | Del | G | G | G | C | C | Del |
| CBA/J | 65 | A | Del | G | G | G | C | C | Del |
| RF/J | 65 | A | Del | G | G | A | C | C | Del |
| BUB/BnJ | 60 | A | Del | G | G | G | C | C | Del |
| BALB/cByJ | 59 | A | Del | G | G | G | C | C | Del |
| 129P3/J | 58 | A | Del | G | G | G | C | C | Del |
| A/J | 56 | A | Del | G | G | G | C | C | Del |
| DBA/2J | 52 | A | Del | G | G | G | C | C | Del |
| LP/J | 48 | A | Del | G | G | G | C | C | Del |
| AKR/J | 41 | A | Del | G | G | G | C | C | Del |
Genotypes creating recombinant haplotypes are underlined. Variant sites most significantly associated with saccharin preference are shown in bold.
Saccharin preference data from Lush (1989).
Figure 2.

Relationship between polymorphisms in the Tas1r3 region and saccharin preferences in 30 mouse strains. The y-axis shows the negative decimal logarithm of p values obtained in t tests assessing differences in 1.6 mm saccharin preference between groups of mice with different genotypes at each polymorphic site. Positions, relative to the first nucleotide in the putative start codon of Tas1r3, are shown at the bottom. Nucleotide alleles, their locations, and corresponding amino acid substitutions are shown above the bars.
Figure 3.
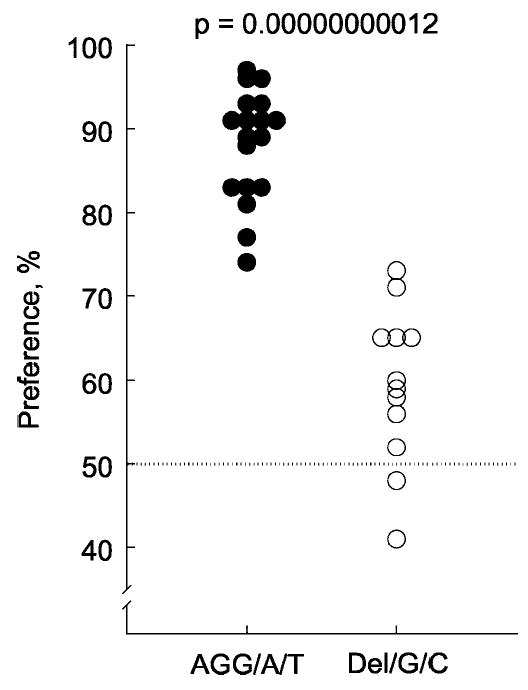
Preferences for 1.6 mm saccharin by mice from inbred strains with different Tas1r3 haplotypes. Closed circles denote means for strains with the nucleotide sequence AGG at nt −791, A at nt +135, and T at nt +179 (AGG/A/T haplotype found in the C57BL/6, C57L/J, CAST/Ei, CE/J, FVB/NJ, I/LnJ, IS/Cam, KK/HlJ, NOD/LtJ, NZB/BlNJ, P/J, RBF/DnJ, SEA/GnJ, SJL/J, SM/J, SPRET/Ei, ST/bJ, and SWR/J strains). Open circles show the means for strains with a 3 bp deletion at nt −791, G at nt +135, and C at nt +179 (Del/G/C haplotype found in the 129P3/J, A/J, AKR/J, BALB/cByJ, BUB/BnJ, C3H/HeJ, CBA/J, DBA/2J, LP/J, PL/J, RF/J, and RIIIS/J strains). The strains with the AGG/A/T haplotype strongly preferred saccharin (preference score, 88 ± 2%; mean ± SE; n = 18), whereas strains with the Del/G/C haplotype were indifferent to or only weakly preferred saccharin (preference score, 59 ± 3%; n = 12; p = 0.00000000012; two-tailed t test).
Tas1r3 gene expression, transcript size, and protein abundance in B6 and 129 mice
Northern blot analysis identified a single band in both the B6 and 129 strains of mice. There were no differences between strains in the abundance of the transcript, nor was there evidence for alternatively spliced forms of the transcript in either strain (Fig. 4). Likewise, the results of real-time PCR indicated that although the Tas1r3 gene was expressed in fungiform, circumvallate, and foliate papillae, there were no strain differences in Tas1r3 gene expression computed relative to either a housekeeping gene (main effect of strain: F(1,23) = 0.9; p = 0.35) or a taste receptor cell-specific gene (main effect of strain: F(1,20) = 2.2; p = 0.15) (Fig. 5). As expected from previous research, there was a main effect of tissue-type on Tas1r3 gene expression. Relative to the housekeeping gene Tbp, Tas1r3 gene expression was lower in fungiform papillae than in circumvallate and foliate papillae (F(3,23) = 3.7; p = 0.03). Relative to the taste receptor cell-specific gene Gng13, Tas1r3 gene expression was higher in fungiform papillae than in circumvallate and foliate papillae (F(1,20) = 5.1; p = 0.02). There were no between-strain differences in the expression of the taste cell-specific gene Gng13 ( p > 0.05) and no differences between strains in the number of fungiform papillae (A. A. Bachmanov, unpublished observations). Therefore, confounding variables, such as between-strain differences in papillae density or taste receptor cell number, are unlikely to have influenced the measurement of the Tas1r3 gene expression. The results of immunocytochemistry with an anti T1R3 antibody demonstrated that (1) a subset of taste receptor cells from all types of taste papillae contained T1R3 immunoreactivity, (2) there was little or no T1R3 immunoreactivity in non-taste lingual epithelium, and (3) there were no observable differences in T1R3 immunoreactivity between the B6 and 129 inbred mouse strains (Fig. 6).
Figure 4.

Northern blot analysis of Tas1r3 gene expression in gustatory tissues containing circumvallate and foliate papillae from B6 and 129 mice. Each lane contained 25 μg of total RNA. The blot was hybridized with the Tas1R3 cDNA probe and exposed to film for 4 d. A single major band (7.2 kb) was detected in both mouse strains with similar size and signal intensity. The size of the transcript agrees with previously published Northern blot (Max et al., 2001). Ribosomal RNA (28S and 18S; bottom) is shown as a control for the quality and amount of RNA loaded in each lane.
Figure 5.

Tas1r3 gene expression as measured by real-time PCR, presented relative to expression of a housekeeping gene (Tbp; a TATA box-binding protein) or a taste receptor cell-specific gene (Gng13; a G-protein involved in taste receptor signaling). Normalized gene expression was computed using the following formula (percentage of control gene = 2 (CTcontrol − CTTas1r3) × 100), where CT is the PCR cycle number in which the fluorescent product was first detected. Ten samples were eliminated because there was little or no control gene expression (5 samples from nontaste lingual epithelium, 2 samples from circumvallate papillae, 2 samples from fungiform papillae, and 1 sample from foliate papillae). Because the non-taste epithelium does not contain detectable levels of the taste receptor cell-specific gene Gng13, there are no values for expression of the Tas1r3 gene for this category. B6 and 129 mice have similar amounts of Tas1r3 mRNA in taste papillae relative to either a housekeeping gene or a gene specific to taste receptor cells. Values are presented as means ± SE.
Figure 6.

T1R3 immunoreactivity in taste tissue of B6 and 129 mice. Longitudinal sections from fungiform, foliate, and circumvallate papillae were immunostained with rabbit antiserum directed against a synthetic peptide from the N-terminal domain of T1R3, with a Cy3-conjugated anti-rabbit secondary antibody. No differences between the two mouse strains were apparent in expression levels of the receptor in any sections examined. Magnification, 250×.
Discussion
The identification of DNA variant sites within a 6.7 kb region of the Tas1r3 gene and analysis of genotype–phenotype relationships detected eight polymorphisms significantly associated with saccharin preference among inbred mouse strains. All these variants are candidates for functional polymorphisms affecting Tas1r3 biology. The different strength of the genotype–phenotype associations among these polymorphisms provided a hierarchy from most to least feasible candidate functional variant sites.
This association was strongest for three polymorphisms that are, therefore, the most likely candidates for the Sacb and Sacd alleles. One of these three polymorhphisms, a 3 bp deletion/insertion, is located upstream of the putative initiation codon and could influence Tas1r3 gene expression. However, we found mixed evidence for this. Although the deletion at this site disrupted a predicted transcription-binding site, its proximity to a repetitive element reduces the likelihood that this deletion has functional significance. Nevertheless, repetitive sequences in upstream gene regions have been shown to affect gene expression (Hung and Penning, 1999). The other key variant is a silent mutation (Ser45Ser) that might affect gene or protein function, for instance, by interfering with correct exon splicing (D’Souza et al., 1999). Using real-time PCR, Northern blot analysis, and immunocytochemistry, we found that Tas1r3 gene expression, mRNA transcript size, or T1R3 immunoreactivity in taste tissue did not differ between inbred strains with different Tas1r3 haplotypes. Taken with the results of another study using in situ hybridization to measure gene expression (Montmayeur et al., 2001), we conclude that these key polymorphisms are unlikely to act by blocking gene expression in taste tissue. We cannot exclude other effects of these polymorphisms on gene expression, however, such as those on developmental or tissue-specific regulation.
The third key variant resulted in the isoleucine-to-threonine substitution at position 60, in the extracellular N terminus of the predicted T1R3 protein. Modeling of the T1R3 protein using the structure of the related mGluR1 receptor as a prototype has suggested that the Ile60Thr change interferes with an N-linked glycosylation site, which could affect dimerization of the receptor (Max et al., 2001); however, this was not confirmed in a coimmunoprecipitation experiment (Nelson et al., 2002). This type of polymorphism could also affect ligand binding (Rana et al., 2001).
Because these three most likely candidate functional polymorphisms have the same genotype–phenotype associations, we cannot prioritize them. It is possible that the Sac alleles are complex, and all three variant sites are needed to affect the phenotype. Such complex alleles have been described in other genes (Phillips, 1999; Drysdale et al., 2000). Moreover, it is possible that there are more than two alleles of the Sac gene among the mouse strains examined, so that different polymorphic sites can contribute to different alleles. In fact, we cannot rule out a contribution of any of the eight variants that were significantly associated with saccharin preference, and each one should be considered a candidate functional polymorphism. Consistent with this, one sequence variant resulted in a threonine-to-alanine substitution at position 55, in the predicted extracellular N terminus of the T1R3 protein. Likewise, the nt −2383 SNP affected a predicted transcription factor-binding site, and the nt +652 SNP was located in an intron, in which functional polymorphisms can also exist (Fridman et al., 2000). Overall, although nonsynonymous variants are obvious candidates for functional polymorphisms, those in non-coding regions or silent mutations may also have significant biological function.
Positional cloning of quantitative trait loci (QTL), and especially identification of functional polymorphisms defining QTL alleles, is an evolving field. This study demonstrates an approach to examine key sequence variants within a positionally cloned QTL based on genotype–phenotype associations in a large number of genealogically diverse inbred mouse strains. Although special care was taken to select genealogically diverse strains, the results of the Mouse Genome Sequencing Consortium suggest that inbred strains of mice are a mosaic of only a few ancestorial mouse haplotypes (Wade et al., 2002) and that blocks of chromosomal segments identical by descent are, on average, ~1 Mb. The results of the current analysis partially confirm this observation. However, several of the inbred strains had mosiac haplotypes that were much smaller than 1 Mb, sometimes spanning only a few hundred base pairs. Therefore, methods of gene and allele identification that assume long stretches of identity by descent among inbred strains (Hitzemann et al., 2002) should be applied with caution.
Our results suggest that allelic variation at the Tas1r3 gene explains 78% of the strain variation in saccharin preference. However, there was a substantial amount of genetic variation among the inbred mouse strains not attributed to these polymorphisms, which is consistent with evidence for the multigenic determination of taste responses to sweeteners in mice (Pelz et al., 1973; Stockton and Whitney, 1974; Ramirez and Fuller, 1976; Bachmanov et al., 1996a, 1997; Inoue et al., 2004).
In conclusion, we have identified eight polymorphisms in the Tas1r3 region significantly associated with saccharin preference; three of these are the most likely candidates for functional polymorphisms. These eight variant sites include two protein-coding variants described previously (Bachmanov et al., 2001; Kitagawa et al., 2001; Max et al., 2001; Montmayeur et al., 2001; Nelson et al., 2001; Sainz et al., 2001) and six variants that do not affect predicted T1R3 protein sequence. Here, we presented data for future studies directed to experimentally confirm the function of these polymorphisms and highlighted some of the difficulties of identifying specific DNA sequence variants that underlie QTL.
Footnotes
This work was supported by National Institutes of Health Grants R03DC03509, R01DC04188, and R01DK55853 (D.R.R.); R03DC05154 (L.H.); R01AA11028 (M.G.T.); R01DC00882 (G.K.B.); and R03DC03854 (A.A.B.). Maria Theodorides, Lynn Vo, and Kirsten Mascioli provided technical assistance.
References
- Ariyasu T, Matsumoto S, Kyono F, Hanaya T, Arai S, Ikeda M, Kurimoto M. Taste receptor T1r3 is an essential molecule for the cellular recognition of the disaccharide trehalose. In Vitro Cell Dev Biol Anim. 2003;39:80–88. doi: 10.1290/1543-706X(2003)039<0080:TRTIAE>2.0.CO;2. [DOI] [PubMed] [Google Scholar]
- Bachmanov AA, Tordoff MG, Beauchamp GK. Ethanol consumption and taste preferences in C57BL/6ByJ and 129/J mice. Alcohol Clin Exp Res. 1996a;20:201–206. doi: 10.1111/j.1530-0277.1996.tb01630.x. [DOI] [PMC free article] [PubMed] [Google Scholar]
- Bachmanov AA, Reed DR, Tordoff MG, Price RA, Beauchamp GK. Intake of ethanol, sodium chloride, sucrose, citric acid, and quinine hydrochloride solutions by mice: a genetic analysis. Behav Genet. 1996b;26:563–573. doi: 10.1007/BF02361229. [DOI] [PMC free article] [PubMed] [Google Scholar]
- Bachmanov AA, Reed DR, Ninomiya Y, Inoue M, Tordoff MG, Price RA, Beauchamp GK. Sucrose consumption in mice: major influence of two genetic loci affecting peripheral sensory responses. Mamm Genome. 1997;8:545–548. doi: 10.1007/s003359900500. [DOI] [PMC free article] [PubMed] [Google Scholar]
- Bachmanov AA, Li X, Reed DR, Ohmen JD, Li S, Chen Z, Tordoff MG, de Jong PJ, Wu C, West DB, Chatterjee A, Ross DA, Beauchamp GK. Positional cloning of the mouse saccharin preference (Sac) locus. Chem Senses. 2001;26:925–933. doi: 10.1093/chemse/26.7.925. [DOI] [PMC free article] [PubMed] [Google Scholar]
- Beck JA, Lloyd S, Hafezparast M, Lennon-Pierce M, Eppig JT, Festing MF, Fisher EM. Genealogies of mouse inbred strains. Nat Genet. 2000;24:23–25. doi: 10.1038/71641. [DOI] [PubMed] [Google Scholar]
- Belknap JK. Effect of within-strain sample size on QTL detection and mapping using recombinant inbred mouse strains. Behav Genet. 1998;28:29–38. doi: 10.1023/a:1021404714631. [DOI] [PubMed] [Google Scholar]
- Belknap JK, Crabbe JC, Plomin R, McClearn GE, Sampson KE, O’Toole LA, Gora-Maslak G. Single-locus control of saccharin intake in BXD/Ty recombinant inbred (RI) mice: some methodological implications for RI strain analysis. Behav Genet. 1992;22:81–100. doi: 10.1007/BF01066794. [DOI] [PubMed] [Google Scholar]
- Blizard DA, Kotlus B, Frank ME. Quantitative trait loci associated with short-term intake of sucrose, saccharin and quinine solutions in laboratory mice. Chem Senses. 1999;24:373–385. doi: 10.1093/chemse/24.4.373. [DOI] [PubMed] [Google Scholar]
- Damak S, Rong M, Yasumatsu K, Kokrashvili Z, Varadarajan V, Zou S, Jiang P, Ninomiya Y, Margolskee RF. Detection of sweet and umami taste in the absence of taste receptor T1r3. Science. 2003;301:850–853. doi: 10.1126/science.1087155. [DOI] [PubMed] [Google Scholar]
- Drysdale CM, McGraw DW, Stack CB, Stephens JC, Judson RS, Nandabalan K, Arnold K, Ruano G, Liggett SB. Complex promoter and coding region beta 2-adrenergic receptor haplotypes alter receptor expression and predict in vivo responsiveness. Proc Natl Acad Sci USA. 2000;97:10483–10488. doi: 10.1073/pnas.97.19.10483. [DOI] [PMC free article] [PubMed] [Google Scholar]
- D’Souza I, Poorkaj P, Hong M, Nochlin D, Lee VM, Bird TD, Schellenberg GD. Missense and silent tau gene mutations cause frontotemporal dementia with parkinsonism-chromosome 17 type, by affecting multiple alternative RNA splicing regulatory elements. Proc Natl Acad Sci USA. 1999;96:5598–5603. doi: 10.1073/pnas.96.10.5598. [DOI] [PMC free article] [PubMed] [Google Scholar]
- Fridman E, Pleban T, Zamir D. A recombination hotspot delimits a wild-species quantitative trait locus for tomato sugar content to 484 bp within an invertase gene. Proc Natl Acad Sci USA. 2000;97:4718–4723. doi: 10.1073/pnas.97.9.4718. [DOI] [PMC free article] [PubMed] [Google Scholar]
- Fuller JL. Single-locus control of saccharin preference in mice. J Hered. 1974;65:33–36. doi: 10.1093/oxfordjournals.jhered.a108452. [DOI] [PubMed] [Google Scholar]
- Hitzemann R, Malmanger B, Cooper S, Coulombe S, Reed C, Demarest K, Koyner J, Cipp L, Flint J, Talbot C, Rademacher B, Buck K, McCaughran JJ. Multiple cross mapping (MCM) markedly improves the localization of a QTL for ethanol-induced activation. Genes Brain Behav. 2002;1:214–222. doi: 10.1034/j.1601-183x.2002.10403.x. [DOI] [PubMed] [Google Scholar]
- Huang L, Shanker YG, Dubauskaite J, Zheng JZ, Yan W, Rosenzweig S, Spielman AI, Max M, Margolskee RF. Gamma13 colocalizes with gustducin in taste receptor cells and mediates IP3 responses to bitter denatonium. Nat Neurosci. 1999;2:1055–1062. doi: 10.1038/15981. [DOI] [PubMed] [Google Scholar]
- Hung CF, Penning TM. Members of the nuclear factor 1 transcription factor family regulate rat 3alpha-hydroxysteroid/dihydrodiol dehydrogenase (3alpha-HSD/DD AKR1C9) gene expression: a member of the aldo-keto reductase superfamily. Mol Endocrinol. 1999;13:1704–1717. doi: 10.1210/mend.13.10.0363. [DOI] [PubMed] [Google Scholar]
- Inoue M, Reed DR, Li X, Tordoff MG, Beauchamp GK, Bachmanov AA (2004) Allelic variation of the Tas1r3 taste receptor gene selectively affects behavioral and neural taste responses to sweeteners in the F2 hybrids between C57BL/6ByJ and 129P3/J mice. J Neurosci, in press. [DOI] [PMC free article] [PubMed]
- Kitagawa M, Kusakabe Y, Miura H, Ninomiya Y, Hino A. Molecular genetic identification of a candidate receptor gene for sweet taste. Biochem Biophys Res Commun. 2001;283:236–242. doi: 10.1006/bbrc.2001.4760. [DOI] [PubMed] [Google Scholar]
- Knudsen S. Promoter2.0: for the recognition of PolII promoter sequences. Bioinformatics. 1999;15:356–361. doi: 10.1093/bioinformatics/15.5.356. [DOI] [PubMed] [Google Scholar]
- Li X, Inoue M, Reed DR, Huque T, Puchalski RB, Tordoff MG, Ninomiya Y, Beauchamp GK, Bachmanov AA. High-resolution genetic mapping of the saccharin preference locus (Sac) and the putative sweet taste receptor (T1R1) gene (Gpr70) to mouse distal chromosome 4. Mamm Genome. 2001;12:13–16. doi: 10.1007/s003350010236. [DOI] [PMC free article] [PubMed] [Google Scholar]
- Li X, Staszewski L, Xu H, Durick K, Zoller M, Adler E. Human receptors for sweet and umami taste. Proc Natl Acad Sci USA. 2002a;99:4692–4696. doi: 10.1073/pnas.072090199. [DOI] [PMC free article] [PubMed] [Google Scholar]
- Li X, Bachmanov AA, Li S, Chen Z, Tordoff MG, Beauchamp GK, de Jong PJ, Wu C, Chen L, West DB, Ross DA, Ohmen JD, Reed DR. Genetic, physical, and comparative map of the subtelomeric region of mouse chromosome 4. Mamm Genome. 2002b;13:5–19. doi: 10.1007/s0033501-2109-8. [DOI] [PMC free article] [PubMed] [Google Scholar]
- Long AD, Lyman RF, Langley CH, Mackay TF. Two sites in the Delta gene region contribute to naturally occurring variation in bristle number in Drosophila melanogaster. Genetics. 1998;149:999–1017. doi: 10.1093/genetics/149.2.999. [DOI] [PMC free article] [PubMed] [Google Scholar]
- Lush IE. The genetics of tasting in mice. VI. Saccharin, acesulfame, dulcin and sucrose. Genet Res. 1989;53:95–99. doi: 10.1017/s0016672300027968. [DOI] [PubMed] [Google Scholar]
- Lush IE, Hornigold N, King P, Stoye JP. The genetics of tasting in mice. VII. Glycine revisited, and the chromosomal location of Sac and Soa. Genet Res. 1995;66:167–174. doi: 10.1017/s0016672300034510. [DOI] [PubMed] [Google Scholar]
- Maizel JV, Jr, Lenk RP. Enhanced graphic matrix analysis of nucleic acid and protein sequences. Proc Natl Acad Sci USA. 1981;78:7665–7669. doi: 10.1073/pnas.78.12.7665. [DOI] [PMC free article] [PubMed] [Google Scholar]
- Max M, Shanker YG, Huang L, Rong M, Liu Z, Campagne F, Weinstein H, Damak S, Margolskee RF. Tas1r3, encoding a new candidate taste receptor, is allelic to the sweet responsiveness locus Sac. Nat Genet. 2001;28:58–63. doi: 10.1038/ng0501-58. [DOI] [PubMed] [Google Scholar]
- Montmayeur JP, Liberles SD, Matsunami H, Buck LB. A candidate taste receptor gene near a sweet taste locus. Nat Neurosci. 2001;4:492–498. doi: 10.1038/87440. [DOI] [PubMed] [Google Scholar]
- Nelson G, Hoon MA, Chandrashekar J, Zhang Y, Ryba NJ, Zuker CS. Mammalian sweet taste receptors. Cell. 2001;106:381–390. doi: 10.1016/s0092-8674(01)00451-2. [DOI] [PubMed] [Google Scholar]
- Nelson G, Chandrashekar J, Hoon MA, Feng L, Zhao G, Ryba NJP, Zuker CS. An amino acid taste receptor. Nature. 2002;416:199–202. doi: 10.1038/nature726. [DOI] [PubMed] [Google Scholar]
- Pelz WE, Whitney G, Smith JC. Genetic influences on saccharin preference of mice. Physiol Behav. 1973;10:263–265. doi: 10.1016/0031-9384(73)90308-9. [DOI] [PubMed] [Google Scholar]
- Phillips PC. From complex traits to complex alleles. Trends Genet. 1999;15:6–8. doi: 10.1016/s0168-9525(98)01622-9. [DOI] [PubMed] [Google Scholar]
- Phillips TJ, Crabbe JC, Metten P, Belknap JK. Localization of genes affecting alcohol drinking in mice. Alcohol Clin Exp Res. 1994;18:931–941. doi: 10.1111/j.1530-0277.1994.tb00062.x. [DOI] [PubMed] [Google Scholar]
- Quandt K, Frech K, Karas H, Wingender E, Werner T. MatInd and MatInspector: new fast and versatile tools for detection of consensus matches in nucleotide sequence data. Nucleic Acids Res. 1995;23:4878–4884. doi: 10.1093/nar/23.23.4878. [DOI] [PMC free article] [PubMed] [Google Scholar]
- Ramirez I, Fuller JL. Genetic influence on water and sweetened water consumption in mice. Physiol Behav. 1976;16:163–168. doi: 10.1016/0031-9384(76)90300-0. [DOI] [PubMed] [Google Scholar]
- Rana BK, Shiina T, Insel PA. Genetic variations and polymorphisms of G protein-coupled receptors: functional and therapeutic implications. Annu Rev Pharmacol Toxicol. 2001;41:593–624. doi: 10.1146/annurev.pharmtox.41.1.593. [DOI] [PubMed] [Google Scholar]
- Sainz E, Korley JN, Battey JF, Sullivan SL. Identification of a novel member of the T1R family of putative taste receptors. J Neurochem. 2001;77:896–903. doi: 10.1046/j.1471-4159.2001.00292.x. [DOI] [PubMed] [Google Scholar]
- Schwartz S, Zhang Z, Frazer KA, Smit A, Riemer C, Bouck J, Gibbs R, Hardison R, Miller W. PipMaker—a web server for aligning two genomic DNA sequences. Genome Res. 2000;10:577–586. doi: 10.1101/gr.10.4.577. [DOI] [PMC free article] [PubMed] [Google Scholar]
- Stockton MD, Whitney G. Effects of genotype, sugar, and concentration on sugar preference of laboratory mice (Mus musculus) J Comp Physiol Psychol. 1974;86:62–68. doi: 10.1037/h0035929. [DOI] [PubMed] [Google Scholar]
- Wade CM, Kulbokas EJ, Kirby AW, Zody MC, Mullikin JC, Lander ES, Lindblad-Toh K, Daly MJ. The mosaic structure of variation in the laboratory mouse genome. Nature. 2002;420:574–578. doi: 10.1038/nature01252. [DOI] [PubMed] [Google Scholar]
- Wingender E, Chen X, Hehl R, Karas H, Liebich I, Matys V, Meinhardt T, Pruss M, Reuter I, Schacherer F. TRANSFAC: an integrated system for gene expression regulation. Nucleic Acids Res. 2000;28:316–319. doi: 10.1093/nar/28.1.316. [DOI] [PMC free article] [PubMed] [Google Scholar]
- Zehnder M, Delaleu N, Du Y, Bickel M. Cytokine gene expression—part of host defense in pulpitis. Cytokine. 2003;22:84–88. doi: 10.1016/s1043-4666(03)00116-9. [DOI] [PubMed] [Google Scholar]