Abstract
Angiogenesis, defined as the growth of new blood vessels from pre-existing vessels, involves endothelial cells, pericytes, smooth muscle cells, immune cells, and the coordination with lymphatic vessels and nerves. The multi-cell, multi-system interactions necessitate the investigation of angiogenesis in a physiologically relevant environment. Thus, while the use of in vitro cell-culture models have provided mechanistic insights, a common critique is that they do not recapitulate the complexity associated within a microvascular network. The objective of this protocol is to demonstrate the ability to make time-lapse comparisons of intact microvascular networks before and after angiogenesis stimulation in cultured rat mesentery tissues. Cultured tissues contain microvascular networks that maintain their hierarchy. Immunohistochemical labeling confirms the presence of endothelial cells, smooth muscle cells, pericytes, blood vessels and lymphatic vessels. In addition, labeling tissues with BSI-lectin enables time-lapse comparison of local network regions before and after serum or growth factor stimulation characterized by increased capillary sprouting and vessel density. In comparison to common cell culture models, this method provides a tool for endothelial cell lineage studies and tissue specific angiogenic drug evaluation in physiologically relevant microvascular networks.
Keywords: microcirculation, microvascular network, angiogenesis, endothelial cell, pericyte, time lapse
Introduction
Microvascular network growth and remodeling are common denominators for tissue function, wound healing, and multiple pathologies as well as a key process in microvascular remodeling is angiogenesis, defined as the growth of new blood vessels from existing ones1,2. For tissue engineering new vessels or designing angiogenic based therapies, understanding the importance of the cellular dynamics involved in angiogenesis is critical. However, this process is complex. It can vary at specific locations within a microvascular network and involves multiple cell types (i.e. endothelial cells, smooth muscle cells, pericytes, macrophages, stem cells) and multiple systems (lymphatic networks and neural networks). Although in vitro models have contributed tremendously to examining the relationship between different cells involved in angiogenesis3, their findings and physiological relevance can be undermined due to their limited complexity and the fact that they do not closely reflect an in vivo scenario. To overcome these limitations, three-dimensional culture systems3, ex vivo tissue models4, microfluidic systems5,6, and computational models7 have been developed and introduced in recent years. However, there is still a need for a model with time-lapse capability to investigate angiogenesis in intact microvascular networks ex vivo. The establishment of new time-lapse models for angiogenesis studies with that level of complexity will provide an invaluable tool to understand the underlying mechanisms regulating angiogenesis and to improve therapies.
A potential model than enables the ex vivo investigation of angiogenesis across an intact microvascular network is the rat mesentery culture model8. In recent work, we have demonstrated that blood and lymphatic microvascular networks remain viable after culture. More importantly, the rat mesentery culture model can be used to investigate functional pericyte-endothelial cell interactions, blood and lymphatic endothelial cell connections, and time-lapse imaging. The objective of this paper is to provide our protocol for the time-lapse imaging method. Our representative results document the multiple cell types that remain viable after the stimulation of angiogenesis with serum and offer examples of using this method for quantifying tissue specific angiogenic responses as well as endothelial cell tracking studies.
Protocol
All animal experiments and procedures were approved by the Tulane University’s Institutional Animal Care and Use Committee (IACUC).
-
1. Surgical Procedure Setup
-
1.1)
Autoclave instruments, surgical supplies, and culture supplies prior to surgery. Surgical supplies for each rat include: 1 drape, 1 drape with pre-cut hole (0.5 in × 1.5 in) in the center, gauze pads, and 1 absorbent underpad. Surgical instruments include: 1 scalpel with a number 10 blade, 2 pairs of tweezers, and a pair of fine scissors. Culture supplies include: 1 drape, 1 pair of tweezers, and prepared 6-well plate inserts with polycarbonate filters.
-
1.2)
Sterilize a plexiglass platform, a surgical stage and a surgical benchtop space with 70% ethanol. Keep the surgical stage in a sterile bowl until use.
-
1.2.1)
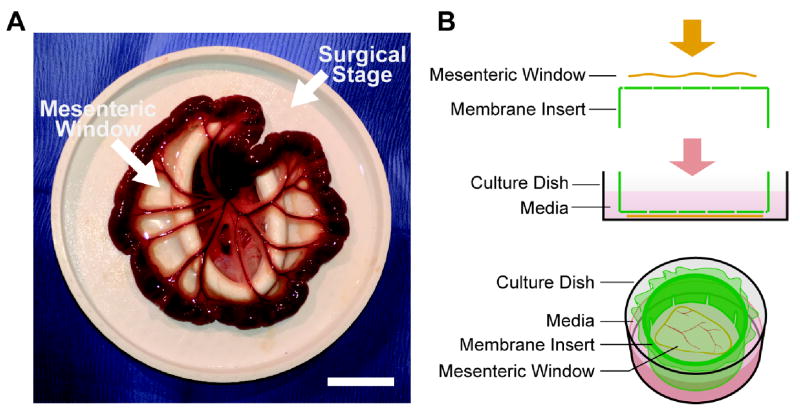
Create a surgical stage by drilling an approximately 2 in by 1 in hole in the center of a 100 mm culture dish. Next, use sandpaper to smooth any sharp edges and add a layer of silicone glue to the hole’s edges to create a raised surface for the tissues.
-
1.2.2)
Alternatively, design the surgical stage using CAD software and make by 3-D printing (Figure 1).
-
1.2.1)
-
1.3)
Place a sterile absorbent underpad down and lay a plexiglass platform on top of it. Place the drape, without a pre-cut hole, over a heated pad next to the absorbent underpad.
-
1.4)
Pre-warm sterile phosphate-buffered saline (PBS), media and saline to 37 °C. Place media and PBS in separate culture dishes atop the heating pad and place saline in a 50 mL conical tube next to the surgical setup.
-
1.5)
Make sure all packages are opened prior to the beginning of the surgery to ensure sterile handling of all materials. A complete list of the common tools used in this procedure are listed in the Table of Specific Surgical Materials and Tools.
-
1.1)
-
2. Mesentery Tissue Harvesting
-
2.1)
Use adult male Wistar rats (350 ± 25 g; 6-8 weeks of age). Other strains and ages of rats can be substituted.
-
2.2)
Anesthetize the rat via an intramuscular injection of ketamine (80 mg/kg body weight) and xylazine (8 mg/kg body weight). Confirm the rat is under anesthesia by pinching between the toes to check for a reflex response; there should be none.
-
2.3)
Shave the abdominal region and remove remaining hair using hair removal cream. Wipe abdominal skin twice with 70% isopropyl alcohol followed by povidone-iodine and transfer animal to the sterile surgical setup and place atop the plexiglass platform.
-
2.4)
Using a scalpel blade, make a 0.75 in – 1.25 in incision in the gut starting 1 in below the sternum. Be careful not to puncture the bowel or mesentery (1 layer of skin, 1 layer of connective tissue, and 1 layer of muscle).
-
2.5)
Place a drape with a pre-cut hole over the incision and place a sterile surgical stage atop the drape. Ensure the opening aligns with the incision. Use sterile cotton-tipped applicators to locate and pull out the ileum through the surgical stage opening.
-
2.5)
Pull 6-8 mesenteric windows through the stage using cotton-tipped applicators, and be careful not to touch the windows (Figure 1). Tissues are typically harvested from the ileum region of the small intestine starting near the cecum. Keep exposed tissues moist with warmed sterile saline as needed using a sterile syringe to drip the solution.
-
2.6)
Euthanize the rat via intracardiac injection of pentobarbital sodium (0.2 mL per rat). Before removing mesenteric windows, ensure the rat is euthanized by palpating the heart; there should be no pulse.
-
2.7)
Remove desired mesentery tissues by using tweezers to grab the fat pad and fine scissors to cut the window. Leave a border of fat (0.2 mm) around the window. Wash tissues once in warmed sterile PBS and once in media.
-
2.8)
Return exteriorized ileum to the abdominal cavity and dispose of animal according to institutional guidelines.
-
2.1)
-
3. Mesentery Tissue Culture for Time-Lapse Studies
-
3.1)
Transfer autoclaved culture supplies (see section 1.1) and tissues to a sterile laminar flow hood.
-
3.2)
Use tweezers to transfer each tissue atop a polycarbonate filter membrane. Grab tissues by the fat pad to avoid damaging the vasculature.
-
3.3)
Quickly spread the tissue using the fat pad, being careful not to touch the window. Invert the insert with the tissue into the bottom of a 6-well plate and cover with 3 mL of media (Figure 1.). Typical media used for this procedure includes Minimum Essential Media (MEM) with 1% Penicillin Streptomycin (PenStrep) and 10% Fetal Bovine Serum (FBS). Media can be supplemented with other serums and/or growth factors to stimulate angiogenesis.
-
3.4)
Repeat steps 3.2 – 3.3 for each tissue and culture in standard incubator conditions (5% CO2, 37 °C) for up to 5 days.
-
3.1)
-
4. Time-Lapse Imaging of Mesentery Tissue
-
4.1)
On the day of imaging, supplement the media in each well with conjugated BSI-Lectin and incubate under standard culture conditions for 30 minutes. Wash tissues twice with lectin-free media. BSI-Lectin stain will remain visible on the mesentery tissue for up to 3 days in culture.
-
4.2)
Transfer the plate to a microscope stage. Identify blood and lymphatic vessels based on their morphology and network structure.
-
4.3)
Locate a desired network region on each tissue and take images. Take note of the imaging location to ensure the same region will be captured for subsequent images. If using a motorized stage, document the coordinates.
-
4.4)
Return tissues to the incubator and continue to culture until desired end point. Repeat steps 4.1 – 4.3 as needed depending on desired experimental time points.
-
4.1)
-
5. Tissue Immunolabeling
-
5.1) BSI-Lectin Labeling
-
5.1.1)
Incubate tissues for 30 min at 37 °C with 1:40 FITC-conjugated lectin in media (2.5 mL antibody solution per well in 6-well plate) followed by two rinses with media. For rinses, add media and then immediately replace.
-
5.1.1)
-
5.2) Live/Dead Labeling
-
5.2.1)
Incubate tissues for 10 min at 37 °C with 1:500 2 mM ethidium homodimer-1 and 1:500 1 mM calcein AM in media (2.5 mL antibody solution per well in 6-well plate) followed by two rinses with media.
-
5.2.1)
-
5.3) BSI-Lectin/NG2 Labeling
-
5.3.1)
Spread tissues on a microscope slide (1-2 tissues/slide) and allow to dry. Remove excess fat with a scalpel by pressing down firmly to excise the fat.
-
5.3.2)
Fix tissues in cold methanol for 30 min at -20 °C. Wash tissues with PBS (3 × 10 min).
-
5.3.3)
For primary antibody labeling incubate tissues for 1 h at room temperature with 1:100 rabbit polyclonal NG2 antibody and 5% normal goat serum (NGS). Wash tissues with PBS (3 × 10 min).
-
5.3.4)
For secondary antibody labeling incubate tissues for 1 h at room temperature with 1:100 goat anti-rabbit CY2-conjugated antibody (GAR-CY2) and 5% NGS. Wash tissues with PBS (3 × 10 min).
-
5.3.5)
Incubate tissues for 30 min at room temperature with 1:40 FITC-conjugated lectin in PBS followed by two rinses with PBS. For rinses, add PBS and then immediately replace.
-
5.3.6)
To mount the slides, cover tissues with 50:50 PBS and glycerol solution and place coverslip on top. Seal the slide edges using nail polish.
-
5.3.1)
-
5.4) LYVE-1/PECAM Labeling
-
5.4.1)
Spread tissues on a microscope slide (1-2 tissues/slide) and allow to dry. Remove excess fat with a scalpel by pressing down firmly to excise the fat.
-
5.4.2)
Fix tissues in cold methanol for 30 min at -20 °C. Wash tissues with PBS + 0.1% saponin (3 × 10 min).
-
5.4.3)
For primary antibody labeling incubate tissues for 1 h at room temperature with 1:200 mouse monoclonal biotinylated CD31 antibody and 1:100 rabbit polyclonal LYVE-1 antibody in PBS + 0.1% saponin + 2% bovine serum albumin (BSA) + 5% NGS. Wash tissues with PBS + 0.1% saponin (3 × 10 minutes).
-
5.4.4)
For secondary antibody labeling, incubate tissues for 1 h at room temperature with 1:500 CY3-conjugated streptavidin antibody and 1:100 GAR-CY2 in PBS + 0.1% saponin + 2% BSA + 5% NGS. Wash tissues with PBS + 0.1% saponin (3 × 10 minutes).
-
5.4.5)
To mount slides, cover tissues with 50:50 PBS and glycerol solution and place a coverslip on top. Seal the slide edges using nail polish.
-
5.4.1)
-
5.5) BrdU/BSI-Lectin Labeling
-
5.5.1)
Add 1 mg/mL BrdU to media and replace tissue media with BrdU solution. Incubate for 2 h at 37 °C.
-
5.5.2)
Spread tissues on a microscope slide (1-2 tissues/slide) and allow to dry. Remove excess fat with a scalpel by pressing down firmly to excise the fat.
-
5.5.3)
Fix tissues in cold methanol for 30 min at -20 °C. Wash tissues with PBS (3 × 10 min).
-
5.5.4)
Denature tissue DNA in 2 M HCl for 1 h at 37 °C. Wash tissues in PBS + 0.1% saponin (3 × 10 min).
-
5.5.5)
For primary antibody labeling, incubate tissues for 1 h at room temperature with 1:100 monoclonal mouse anti-BrdU in PBS + 0.1% saponin + 2% BSA + 5% NGS. Wash tissues with PBS + 0.1% saponin (3 × 10 min).
-
5.5.6)
For secondary antibody labeling, incubate tissues for 1 h at room temperature with 1:100 goat anti-mouse Cy3-conjugated antibody (GAM-Cy3) in PBS + 0.1% saponin + 2% BSA + 5% NGS. Wash tissues with PBS + 0.1% saponin (3 × 10 min).
-
5.5.7)
Incubate tissues for 30 min at room temperature with 1:40 FITC-conjugated lectin in PBS followed by two rinses with PBS.
-
5.5.8)
To mount slides, cover tissues with 50:50 PBS and glycerol solution and place coverslip on top. Seal the slide edges using nail polish.
-
5.5.1)
-
5.6) BSI-Lectin/CD11b labeling
-
5.6.1)
Spread tissues on a microscope slide (1-2 tissues/slide) and allow to dry. Remove excess fat with a scalpel by pressing down firmly to excise the fat.
-
5.6.2)
Fix tissues in cold methanol for 30 min at -20 °C. Wash tissues with PBS + 0.1% saponin (3 × 10 min).
-
5.6.3)
For primary antibody labeling incubate tissues for 1 h at room temperature with 1:100 mouse anti-rat CD11b in PBS + 0.1% saponin + 2% BSA + 5% NGS. Wash tissues with PBS + 0.1% saponin (3 × 10 minutes).
-
5.6.4)
For secondary antibody labeling incubate tissues for 1 h at room temperature with 1:100 GAM-Cy3 in PBS + 0.1% saponin + 2% BSA + 5% NGS. Wash tissues with PBS + 0.1% saponin (3 × 10 minutes).
-
5.6.5)
Incubate tissues for 30 min at room temperature with 1:40 FITC-conjugated lectin in PBS followed by two rinses with PBS.
-
5.6.6)
To mount slides, cover tissues with 50:50 PBS and glycerol solution and place coverslip on top. Seal the slide edges using nail polish.
-
5.6.1)
-
Figure 1. Mesenteric windows were located by pulling out the small intestine through a surgical stage.
The surgical stage was designed and made by 3-D printing. The elliptical hole in the center is approximately 2 in by 1 in (A). The mesenteric windows were then spread out on top of a membrane insert, and the insert was inverted and put into a well (B). Scale bar = 2 cm.
Table.
Table of Specific Reagents
| Name | Company | Catalog Number | Comments/Description |
|---|---|---|---|
| Beuthanasia | Schering-Plough Animal Health Corp. Union (Ordered from MWI Veterinary Supply) | MWI #: 011168 | Active Ingredient: Per 100mL, 390 mg pentobarbital sodium, 50mg phenytoin sodium |
| Ketamine | Fort Dodge Animal Health (Ordered from MWI Veterinary Supply) | MWI #: 000680 | Kateset 100 mg/ml |
| Xylazine | LLOYD. Inc. (Ordered from MWI Veterinary Supply) | MWI #: 000680 | Anased 100 mg/ml |
| Saline | Baxter | 2F7122 | |
| PBS | Invitrogen | 14040-133 | |
| MEM | Invitrogen | 11095080 | |
| PenStrep | Invitrogen | 15140-122 | |
| FBS | Invitrogen | 16000-044 | |
| BSA | Jackson ImmunoResearch | 001-000-162 | |
| Saponin | SIGMA | S7900-100G | |
| Isopropyl Alcohol | Fisher Scientific | S25372 | |
| Povidone-Iodine | Operand | 82-226 | |
| Hydrochloric Acid | SIGMA | 320331 | |
| Methanol | Fisher Scientific | 67-56-1 | |
| Glycerol | Fisher Scientific | 56-81-5 | |
| FITC-conjugated Lectin | SIGMA | L9381-2MG | |
| Anti-NG2 Chondroitin Sulfate Proteoglycan Antibody | SIGMA | AB5320 | |
| PECAM (CD31) Antibody | BD Biosciences | 555026 | |
| LYVE-1 Antibody | AngioBio Co. | 11-034 | |
| Goat Anti-Rabbit Cy2-conjugated Antibody | Jackson ImmunoResearch | 111-585-144 | |
| Goat Anti-Mouse Cy3-conjugated Antibody | Jackson ImmunoResearch | 115-227-003 | |
| Streptavidin Cy3-conjugated Antibody | Jackson ImmunoResearch | 016-160-084 | |
| Live/Dead Viability/Cytotoxicity Kit | Invitrogen | L3224 | |
| Normal Goat Serum | Jackson ImmunoResearch | 005-000-121 | |
| 5-Bromo-2’-Deoxyuridine | SIGMA | B5002 | |
| Monoclonal Mouse Anti-Bromodeoxyuridine | |||
| Clone Bu20a | Dako | M074401-8 | |
| Mouse Anti-Rat CD11b | AbD Serotec | MCA275R | |
| Drape | Cardinal Health | 4012 | 12"×12" Bio-Shield Regular Sterilization Wraps |
| Scalpel Handle | Roboz Surgical Instrument | RS-9843 | Scalpel Handle, #3; Solid; 4" Length |
| Sterile Surgical Blade | Cincinnati Surgical | 0110 | Stainless Steel; Size 10 |
| Culture Dish (60mm) | Thermo Scientific | 130181 | 10/Sleeve |
| Graefe Forcep (curved tweezers) | Roboz Surgical Instrument | RS-5135 | Micro Dissecting Forceps; Serrated; Slight Curve; 0.8mm Tip Width; 4" Length |
| Graefe Forcep (straight tweezers) | Roboz Surgical Instrument | RS-5130 | Micro Dissecting Forceps; Serrated, Straight; 0.8mm Tip Width; 4" Length |
| Noyes Micro Scissor | Roboz Surgical Instrument | RS-5677 | Noyes Micro Dissecting Spring Scissors; Straight, Sharp-Blunt Points; 13mm Cutting Edge; 0.25mm Tip Width, 4 1/2" Overall Length |
| Gauze Pads | FisherBrand | 13-761-52 | Non-Sterile Cotton Gauze Sponges; 4"x4" 12-Ply |
| Cotton-Tippled Applicators | FisherBrand | 23-400-124 | 6" Length; Wooden Shaft; Single Use Only |
| 6-Well Plate | Fisher Scientific | 08-772-49 | Flat Bottom with Low Evaporation Lid; Polystyrene; Non-Pyrogenic |
| Sterile Syring 5ml | Fisher Scientific | 14-829-45 | Luer-Lok Tip |
| Sterile Bowl | Medical Action Industries Inc. | 01232 | 32 oz. Peel Pouch; Blue; Sterile Single Use |
| 6-Well Plate Inserts (CellCrown Inserts) | SIGMA | Z681792-3EA | 6-Well Plate Inserts; Non-Sterile |
| Polycarbonate Filter Membrane | SIGMA | TMTP04700 | Isopore Membrane Filter; Polycarbonate; Hydrophilic; 5.0 μm, 47 mm, White Plain |
Representative Results
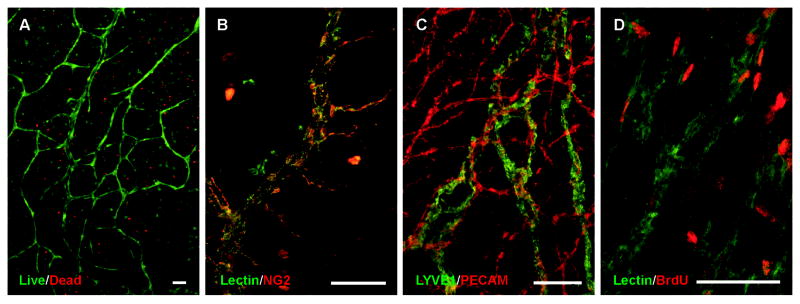
After 3 days in culture, tissues were labeled with a live/dead viability/cytotoxicity kit to demonstrate the viability of the microvasculature in the rat mesentery culture model (Figure 2A). The majority of cells present in the mesentery remained viable in the culture where endothelial cells were identified based on their location in microvascular segments. Endothelial cell proliferation was also confirmed by lectin/BrdU labeling (Figure 2D). Smooth muscle cell and pericyte presence along vessels was confirmed with NG2 labeling (Figure 2B). Labeling for LYVE1 and PECAM identified branching lymphatic and blood microvascular networks and confirmed the maintained lymphatic versus blood endothelial cell phenotype (Figure 2C).
Figure 2. Blood vessels remain viable in the rat mesentery culture model.
Live/dead assay performed after culture showed a high ratio of live cells (green) to dead cells (red) specifically along the blood vessels (A). Mesentery tissues were labeled with lectin and anti-NG2, to identify pericytes (red) alongside vessels (green) and to confirm that different types of cells are present in the post-culture tissues (B). Tissues were also labeled against PECAM/LYVE-1 to identify blood (red) vessels from lymphatic (green) vessels (C). To investigate if microvascular cells undergo proliferation in culture, mesentery tissues were labeled with lectin/anti-BrdU. On capillary segments labeled with lectin (green), multiple cells were confirmed to be proliferative (red), another indicator that cells in the rat mesentery culture model undergo normal cell life cycles (D). Scale bars = 100 μm.
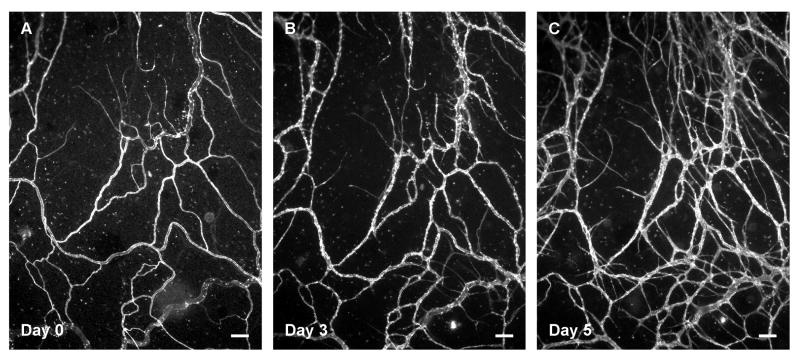
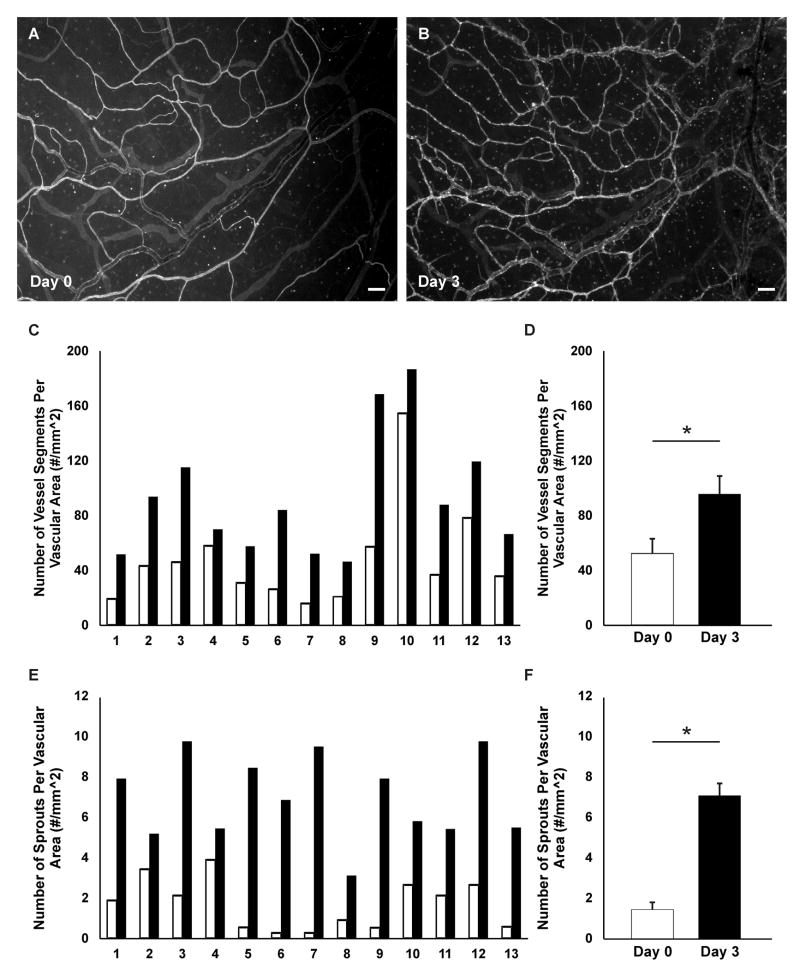
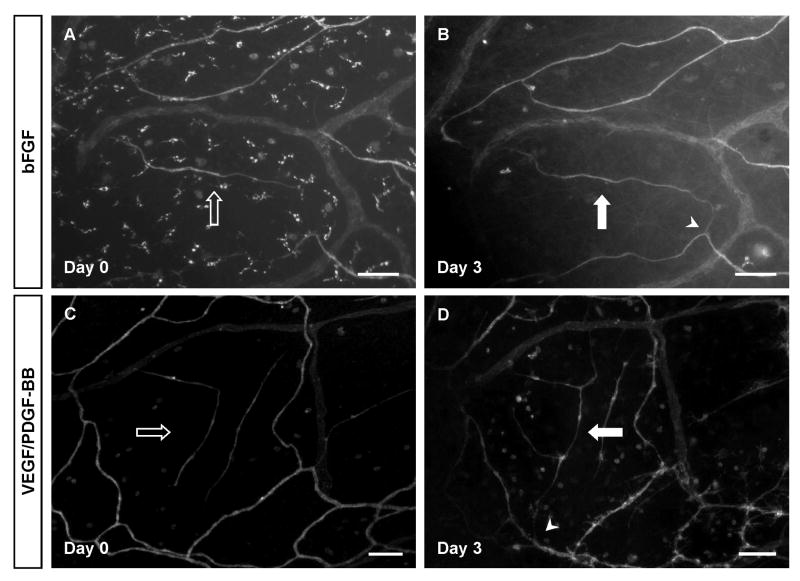
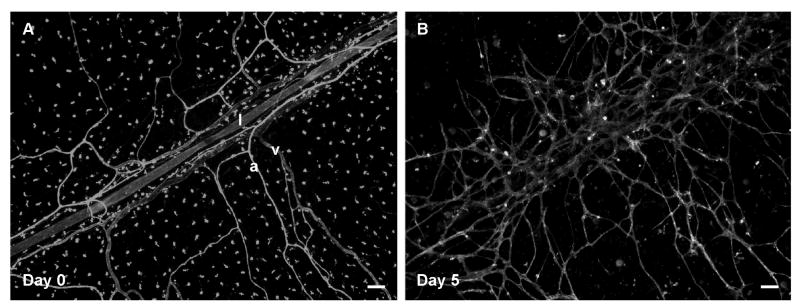
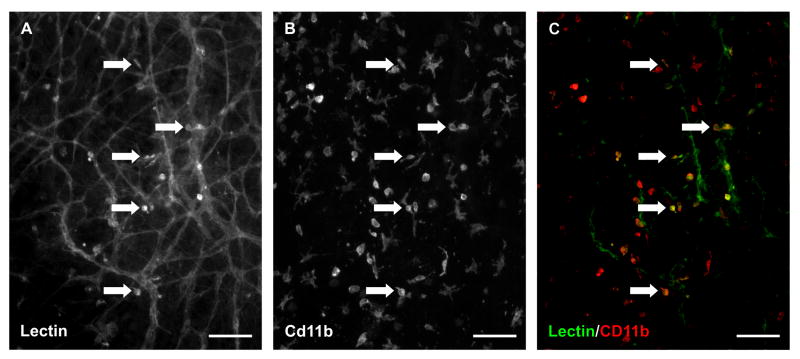
The time-lapse feature of this model was utilized by labeling the microvascular networks with BSI-lectin at different time points and imaging the same region within the network over time; this capability is particularly valuable for investigating tissue specific angiogenic responses. The supplementation of media with 10% serum caused a robust angiogenic response after 3 days of stimulation. Additionally, new vessel segments and capillary sprouts were identified by day 5 of stimulation (Figure 3). The time-lapse imaging method allowed for the quantitative comparison of network regions before and after stimulation (Figure 4). For this representative study, which corroborates our previous results9, the number of vessels per vascular area and the number of capillary sprouts per vascular area were quantified from one 4x image per tissue. Blood vessel segments were defined as lectin-positive blood endothelial cell segments present between two branch points and capillary sprouts were defined as blind ended segments originating from a host vessel. Time-lapse comparison of network regions also enabled tracking of endothelial cell segments (Figure 5) and identification of blood/lymphatic vessel mis-patterning (Figure 6). Labeling of cultured tissues for lectin and CD11b additionally confirmed the presence of interstitial resident macrophages (Figure 7) in remodeling networks.
Figure 3. Time-lapse imaging of the rat mesentery enables observing microvascular remodeling over the course of the culture.
A robust angiogenic response was observed after 3 (B) and 5 days (C) of culture with 10% serum stimulation. Scale bars = 100 μm.
Figure 4. Microvascular networks in the rat mesentery culture model were imaged before and after angiogenesis.
Comparison of the same network labeled with lectin on day 0 and day 3 (A, B) post-stimulation with 10 % serum identifies new vessels. Lectin also labels a population of unidentified interstitial cells. Quantification of vessel density (C, D) and the number of capillary sprouts per vascular area (E, F) confirmed an increase in both metrics for each tissue. C, E) Before (day 0) and after (day 3) comparisons per tissue. D, F) Comparison between day 0 and day 3 averages using a paired Student’s t-test confirmed a significant difference in both the average number of vessel segments (p < 0.0001) and the average number of sprouts (p < 0.00001) per vascular area. White bars represent day 0, and black bars represent day 3. Values are averages ± SEM. For this representative analysis, 13 tissues were harvested from 2 rats. Scale bars = 100 μm.
Figure 5. The rat mesentery culture model can be used for investigating vascular island fate and incorporation into nearby networks.
Using time-lapse imaging, vascular islands were identified on day 0 and their connection to the nearby network was confirmed by day 3 post-angiogenic stimulation. Mesentery tissues were stimulated with bFGF (A, B) and VEGF/PDFG-BB (C, D). Hollow arrows show disconnected segments on day 0 and solid arrows represent island connection to the network. Arrowheads indicate the location of connections between a vascular island and the nearby network. Scale bars = 100 μm.
Figure 6. Time-lapse images demonstrate the ability to observe lymphatic and blood vessel patterning.
Lymphatic (l) vessels can be distinguished from arterioles (a) and venules (v) based on labeling morphology on day 0 (A). On day 5 post-stimulation with 10% serum, lymphatic morphology is lost and vessels appear to have integrated with the nearby angiogenic blood vessels. Scale bars = 100 μm.
Figure 7. Macrophages remain present in cultured rat mesenteric tissues.
Lectin/CD11b co-labeling of tissues cultured for 3 days with 10% serum suggest that lectin positive interstitial cells are a subset of macrophages. A) A representative image of BSI-lectin labeling. B) The same image showing Cd11b labeling. C) The merged image. The arrows identify examples of co-labeling. Scale bars = 100 μm.
Discussion
This protocol documents a method for using the rat mesentery culture model as an ex vivo tool for time-lapse imaging of microvascular network growth. Previous work in our laboratory has established the use of our model for 1) angiogenesis8, 2) lymphangiogenesis8, 3) pericyte-endothelial cell interactions8, and 4) anti-angiogenic drug testing9. The ability for imaging cultured rat mesentery tissues at multiple time points offers a quantitative assay for evaluating tissue-specific growth responses and the tracking of cell-cell interactions during various angiogenic stimuli. The increased proliferation of endothelial cells during angiogenesis and the presence of pericytes is consistent with our previous work8 and validate the dynamic interactions between multiple cell types during angiogenesis in cultured rat mesenteric tissues.
Compared to commonly used tissue culture models and in vitro cell culture systems, the rat mesentery culture model is unique because growth occurs within an intact, real microvascular network. Ex vivo models take advantage of the existing vascular structure in the tissues to enable angiogenesis studies. The aortic ring assay was established to study angiogenic sprouting from aortic segments in a collagen gel10. While sprouting in the aortic ring involves multiple cell types, capillary sprouts grow out of the excised segments of the aorta, which is very different from the in vivo scenario. The brain slice model is another ex vivo model, but it is void of lymphatic vessels. Moreover, the brain slice model has not been shown to be capable of time-lapse imaging before and after angiogenic stimulation11. Another ex vivo model that has been recently introduced is the retina culture model. The advantage of the retina model is the fact that angiogenesis occurs from intact microvascular networks within the tissue12,13. For these models, GFP-transgenic mice strains are used to be able to observe capillary sprouting over time, but unfortunately, the mouse mesentery is avascular14, eliminating the GFP-transgenic mice mesentery substitution for rat mesentery, as utilized in our model. Furthermore, we show that a simple lectin labeling of rat mesentery cultures is sufficient to determine network growth at different time points and in comparison to the other ex vivo models, our model allows for simultaneous observation of both blood and lymphatic endothelial cells.
BSI-lectin was used in this paper to visualize microvascular networks and detect angiogenic responses. Lectin is a protein structure that binds to glycoproteins on endothelial cells and was selected for this protocol due to its short incubation time compared to endothelial antibody markers. Lectin is less expensive than antibodies and it does not require fixing or cause cell apoptosis; it can also be easily mixed in the culture media and replaced with fresh media after the incubation period ends. While future studies are needed to elucidate the potential effects of the lectin labeling technique on the angiogenic process, our representative results (Figure 4) demonstrate that robust angiogenesis can be induced and previous work9 demonstrates that angiogenesis in lectin labeled networks can be inhibited via targeting Vascular Endothelial Growth Factor (VEGF). Antibody markers can potentially be used as an alternative labeling approach when there is a need for more specific markers, or when there is a need to investigate other cell types that are present in the microvascular networks such as smooth muscle cells, pericytes, and nerves. Another potential method for visualizing cells would be gene transfection.
The advantage of using the time-lapse rat mesentery model has been highlighted in the representative results for this protocol. The comparison of images before and after treatment reduces issues of variability that influence non-paired statistical analysis. The explant specific responses varied from 20% to 233% increase in vessel density and from 40% to 3500% increase in sprout density. The specific causes for this variation remain unknown, but measuring growth in the same tissue over time present the ability to confirm tissue specific responses.
Comparative analysis of images at different time points during microvascular growth also allows for tracking endothelial cells. For example, our lab has identified vascular islands as endothelial cell segments in the vicinity of microvascular networks that are disconnected from nearby networks15,16. To confirm that these islands connect to the nearby network in response to angiogenic stimuli, the rat mesentery culture model was used. As shown in Figure 5, vascular islands were tracked after tissue stimulation with basic Fibroblast Growth Factor (bFGF) or VEGF plus Platelet-Derived Growth Factor (PDGF). We have also shown similar results post serum stimulation (data not shown here). After the stimulation of angiogenesis, the originally disconnected vascular islands can be found connected to nearby networks.
Other potential applications of the rat mesentery culture model could leverage the ability to investigate the relationships between lymphatic and blood vessels and their respective endothelial cells and the tracking of interstitial cell fate. Time-lapse images of the same microvascular networks before and after stimulation with 10% serum in this model provided examples of potential lymphatic-to-blood vessel integration (Figure 6). Before stimulation, lymphatic and blood vessels were distinguished based on vessel morphology. After stimulation, lymphatic versus blood vessel identity became less clear. The potential for lymphatic/blood endothelial cell interactions is supported by the observation of PECAM+/LYVE-1- blood endothelial cells connecting with PECAM+/LYVE-1+ lymphatic endothelial cells (data not shown here). These observations support the use of the rat mesentery culture model for investigating lymphatic/blood endothelial cell plasticity. Figure 6A also highlights the lectin labeling of apparent interstitial cells. While this labeling is inconsistent and heterogeneous from tissue to tissue, it does emphasize the presence of endogenous tissue resident cells. CD11b labeling of cultured tissues (Figure 7) suggests that these lectin-positive interstitial cells could be a sub-set of macrophages. Given the emerging interest in macrophage involvement in angiogenesis20, an additional strength of the model could be its use to track macrophage dynamics over time.
Much like other ex vivo models, a current limitation of studying angiogenesis in the rat mesentery culture model is the lack of blood flow. Shear stress caused by blood flow has been shown to play a role in endothelial cell morphology and proliferation as well as angiogenesis17-19. For the representative results presented in Figure 4, the angiogenic responses could be associated with the serum conditions alongside the absence of shear stress and the absence of shear stress may alone even be sufficient to induce an angiogenic response in cultured networks. However, we know that based on our initial publication characterizing the rat mesentery culture model8, that media supplementation causes increased angiogenesis versus media alone. Future studies incorporating flow within the cultured microvascular networks are undoubtedly needed to more closely mimic the in vivo scenario. Potential approaches for incorporating flow might include cannulation of network feeding arterioles or even cannulation of further upstream arteries within the fat border of mesenteric windows. However, despite the lack of flow, the viability of multiple cell types, the maintenance of blood and lymphatic microvascular networks, and cell proliferation during angiogenesis supports the rat mesentery culture model’s relative increased level of complexity compared to cell based in vitro models. We speculate the lack of flow becomes a more significant issue during longer culture periods, as tissues that are cultured for longer than approximately 10 days display a reduced network hierarchy.
In conclusion, this protocol describes a simple, reproducible ex vivo method for imaging angiogenic responses in intact microvascular networks. Such a method offers an alternative to cell based in vitro models for evaluating angiogenic cell dynamics at specific locations within a network environment. The method also offers a novel tool for investigating angiogenesis, lymphangiogenesis and blood/lymphatic mis-patterning simultaneously.
Acknowledgments
This work was supported by National Institutes of Health Grant 5-P20GM103629 to WLM and the Tulane Center for Aging. We would like to thank Matthew Nice for his help with editing the protocol text.
Footnotes
A complete version of this article that includes the video component is available at http://dx.doi.org/10.3791/55183.
Disclosures:
The authors declare that they have no competing financial interests.
Contributor Information
Mohammad S. Azimi, Email: mazimi@tulane.edu, Biomedical Engineering, Tulane University, New Orleans, Louisiana, United States.
Jessica M. Motherwell, Email: jmotherw@tulane.edu, Biomedical Engineering, Tulane University, New Orleans, Louisiana, United States.
Walter L. Murfee, Email: wmurfee@tulane.edu, Biomedical Engineering, Tulane University, New Orleans, Louisiana, United States.
References
- 1.Carmeliet P, Jain RK. Angiogenesis in cancer and other diseases. Nature. 2000;407(6801):249–257. doi: 10.1038/35025220. [DOI] [PubMed] [Google Scholar]
- 2.Carmeliet P. Angiogenesis in life, disease and medicine. Nature. 2005;438(7070):932–936. doi: 10.1038/nature04478. [DOI] [PubMed] [Google Scholar]
- 3.Kaunas R, Kang H, Bayless KJ. Synergistic Regulation of Angiogenic Sprouting by Biochemical Factors and Wall Shear Stress. Cell Mol Bioeng. 2011;4(4):547–559. doi: 10.1007/s12195-011-0208-5. [DOI] [PMC free article] [PubMed] [Google Scholar]
- 4.Pitulescu ME, Schmidt I, Benedito R, Adams RH. Inducible gene targeting in the neonatal vasculature and analysis of retinal angiogenesis in mice. Nat Protoc. 2010;5(9):1518–1534. doi: 10.1038/nprot.2010.113. [DOI] [PubMed] [Google Scholar]
- 5.Song JW, Munn LL. Fluid forces control endothelial sprouting. Proc Natl Acad Sci U S A. 2011;108(37):15342–15347. doi: 10.1073/pnas.1105316108. [DOI] [PMC free article] [PubMed] [Google Scholar]
- 6.Chan JM, et al. Engineering of in vitro 3D capillary beds by self-directed angiogenic sprouting. PLoS One. 2012;7(12):e50582. doi: 10.1371/journal.pone.0050582. [DOI] [PMC free article] [PubMed] [Google Scholar]
- 7.Peirce SM, Mac Gabhann F, Bautch VL. Integration of experimental and computational approaches to sprouting angiogenesis. Curr Opin Hematol. 2012;19(3):184–191. doi: 10.1097/MOH.0b013e3283523ea6. [DOI] [PMC free article] [PubMed] [Google Scholar]
- 8.Stapor PC, Azimi MS, Ahsan T, Murfee WL. An angiogenesis model for investigating multicellular interactions across intact microvascular networks. Am J Physiol Heart Circ Physiol. 2013;304(2):H235–245. doi: 10.1152/ajpheart.00552.2012. [DOI] [PMC free article] [PubMed] [Google Scholar]
- 9.Azimi MS, et al. An ex vivo model for anti-angiogenic drug testing on intact microvascular networks. PLoS One. 2015;10(3):e0119227. doi: 10.1371/journal.pone.0119227. [DOI] [PMC free article] [PubMed] [Google Scholar]
- 10.Nicosia RF, Ottinetti A. Growth of microvessels in serum-free matrix culture of rat aorta. A quantitative assay of angiogenesis in vitro. Lab Invest. 1990;63(3):115–122. [PubMed] [Google Scholar]
- 11.Hutter-Schmid B, Kniewallner KM, Humpel C. Organotypic brain slice cultures as a model to study angiogenesis of brain vessels. Front Cell Dev Biol. 2015;3:52. doi: 10.3389/fcell.2015.00052. [DOI] [PMC free article] [PubMed] [Google Scholar]
- 12.Sawamiphak S, Ritter M, Acker-Palmer A. Preparation of retinal explant cultures to study ex vivo tip endothelial cell responses. Nat Protoc. 2010;5(10):1659–1665. doi: 10.1038/nprot.2010.130. [DOI] [PubMed] [Google Scholar]
- 13.Unoki N, Murakami T, Ogino K, Nukada M, Yoshimura N. Time-lapse imaging of retinal angiogenesis reveals decreased development and progression of neovascular sprouting by anecortave desacetate. Invest Ophthalmol Vis Sci. 2010;51(5):2347–2355. doi: 10.1167/iovs.09-4158. [DOI] [PubMed] [Google Scholar]
- 14.Norrby K. In vivo models of angiogenesis. J Cell Mol Med. 2006;10(3):588–612. doi: 10.1111/j.1582-4934.2006.tb00423.x. [DOI] [PMC free article] [PubMed] [Google Scholar]
- 15.Kelly-Goss MR, Sweat RS, Azimi MS, Murfee WL. Vascular islands during microvascular regression and regrowth in adult networks. Front Physiol. 2013;4:108. doi: 10.3389/fphys.2013.00108. [DOI] [PMC free article] [PubMed] [Google Scholar]
- 16.Kelly-Goss MR, et al. Cell proliferation along vascular islands during microvascular network growth. BMC Physiol. 2012;12:7. doi: 10.1186/1472-6793-12-7. [DOI] [PMC free article] [PubMed] [Google Scholar]
- 17.Skalak TC, Price RJ. The role of mechanical stresses in microvascular remodeling. Microcirculation. 1996;3:2, 143–165. doi: 10.3109/10739689609148284. [DOI] [PubMed] [Google Scholar]
- 18.Kadohama T, Nishimura K, Hoshino Y, Sasajima T, Sumpio BE. Effects of different types of fluid shear stress on endothelial cell proliferation and survival. J Cell Physiol. 2007;212(1):244–251. doi: 10.1002/jcp.21024. [DOI] [PubMed] [Google Scholar]
- 19.Milkiewicz M, Brown MD, Egginton S, Hudlicka O. Association between shear stress, angiogenesis, and VEGF in skeletal muscles in vivo. Microcirculation. 2001;8(4):229–241. doi: 10.1038/sj/mn/7800074. [DOI] [PubMed] [Google Scholar]
- 20.Corliss BA, Azimi MS, Munson JM, Peirce SM, Murfee WL. Macrophages: An Inflammatory Link Between Angiogenesis and Lymphangiogenesis. Microcirculation. 2016;23(2):95–121. doi: 10.1111/micc.12259. [DOI] [PMC free article] [PubMed] [Google Scholar]


