

Abstract
Introduction
Since the Affordable Care Act was passed, more than 12 million individuals have enrolled in the health insurance marketplace. Without support, many struggle to make an informed plan choice that meets their health and financial needs.
Methods
We designed and evaluated a decision aid, Show Me My Health Plans (SMHP), that provides education, preference assessment, and an annual out-of-pocket cost calculator with plan recommendations produced by a tailored, risk-adjusted algorithm incorporating age, gender, and health status. We evaluated whether SMHP compared to HealthCare.gov improved health insurance decision quality and the match between plan choice, needs, and preferences among 328 Missourians enrolling in the marketplace.
Results
Participants who used SMHP had higher health insurance knowledge (LS-Mean = 78 vs. 62; P < 0.001), decision self-efficacy (LS-Mean = 83 vs. 75; P < 0.002), confidence in their choice (LS-Mean = 3.5 vs. 2.9; P < 0.001), and improved health insurance literacy (odds ratio = 2.52, P <0.001) compared to participants using HealthCare.gov. Those using SMHP were 10.3 times more likely to select a silver- or gold-tier plan (P < 0.0001).
Discussion
SMHP can improve health insurance decision quality and the odds that consumers select an insurance plan with coverage likely needed to meet their health needs. This study represents a unique context through which to apply principles of decision support to improve health insurance choices.
Keywords: vulnerable populations, health literacy, public health, shared decision making, decision aids
Since the Affordable Care Act (ACA) was passed, the number of nonelderly Americans without health insurance has dropped from 50 million in 2010 to approximately 30 million.1,2 More than 12 million individuals have enrolled through the health insurance marketplace, a group of private insurance plans from which individuals can choose.3 For many, enrolling in a marketplace plan was their first experience making a health insurance decision.4
Given the complex nature of health insurance information, many individuals struggle to make an informed choice. Limited health insurance literacy and health numeracy5,6 hinder one’s ability to interpret, communicate, and act on complex and quantitative health information. Only about one quarter of previously uninsured individuals feel confident that they understand health insurance details.7,8 Knowledge gaps persist even among educated individuals reporting a good understanding of health insurance.9 Individuals with low numeracy have difficulty calculating out-of-pocket costs across plans,10 regardless of whether plain language summaries are displayed.11,12 When individuals do not understand information or are faced with difficult trade-offs, they might ignore key information13 or make a decision dominated by a single factor, even when these mental short-cuts are not in their best interest.14
Without appropriate support, many consumers will select a plan without acceptable coverage for their health status.15 For example, almost one quarter of individuals who enrolled in the ACA marketplace through 2015 enrolled in a high-deductible plan without a health savings account,16 many without considering their health care utilization or the cost of this care.17 Deductibles are often quite high relative to consumers’ incomes, even among those eligible for cost-sharing reductions.18 Although some of these decisions result from affordability concerns, others result from inadequate assistance. Many state-run and federal websites lack plain language guidance and fail to provide annual out-of-pocket cost estimators, even with expanded decision support in the third enrollment period.19,20 Choosing a health insurance plan with a focus on immediate rather than long-term costs could result in financial distress or failure to receive needed care, particularly among the disproportionately low-income population served by the ACA.
Drawing on a model of information processing and empirical decision-making research,21 we developed a health insurance decision aid called Show Me My Health Plans (SMHP) to assist individuals enrolling in the health insurance marketplace in Missouri.22 A modified version of SMHP can be accessed at showmehealthplans.org, and screen shots are shown in Online Appendix A. Specifically, SMHP 1) simplifies information with plain language and graphics; 2) assesses knowledge through an interactive quiz that provides feedback about correct or incorrect responses to ensure comprehension of key material; 3) incorporates individual and dependent health status to personalize annual out-of-pocket cost estimates; 4) assesses preferences for plan features through a rating system (from 1 = not at all important to 5 = very important) and a ranking system (asking users to order features from most to least important); and 5) helps individuals weigh information appropriate to their needs with a summary plan-sorting page, highlighting “good fit” plans generated from a tailoring algorithm.
SMHP’s development is detailed in a previously published article.22 Briefly, it was based on formative work with uninsured participants, health providers, community advisors, and health policy experts with attention to health literacy, numeracy, and graphic literacy. The algorithm used to estimate individual or family expected annual out-of-pocket costs included estimates from the Medical Expenditure Panel Survey (MEPS) with an additional risk-adjustment factor based on age, gender, and medical conditions. MEPS data estimate the probability of incurring health care–related costs during a calendar year and the size of these costs. Due to the plethora of similar plans and the need to adjust for potential risk of unexpected expenses, the tailoring algorithm compared plans pairwise until all plans were ordered to generate an appropriate set of recommendations for individuals. Individuals could see all plans (ranging from 18 to 43 plans in 2015 and 30 to 46 plans in 2016 depending on county of residence) sorted by lowest to highest annual cost, as well as three “good fit” plans based on our algorithmic prediction of cost and potential risk. We expected these design elements to improve comprehension and use of information in choices.21
The current article reports findings from an experimental study designed to evaluate whether SMHP improved health insurance knowledge, self-efficacy for making a choice about a health insurance plan, confidence in that choice, and intended plan choice compared to HealthCare.gov.
METHODS
Participants
Eligible individuals were ages 18 to 64 years, English-speaking, not Medicaid-eligible, (therefore eligible for the ACA marketplace), and living in urban, suburban, and rural counties within 90 miles of St. Louis. A screening survey assessed eligibility using Missouri-specific criteria. The study was approved by the Human Research Protection Office at Washington University in St. Louis and registered with clinicaltrials.gov (protocol NCT02522624).
Data Collection
Recruitment occurred between October 2015 and January 2016 via community events, online advertisements, social service organizations, and the recruitment/retention arm of our Center for Community-Engaged Research.
Participants were computer-allocated to one of two study conditions: 1) SMHP or 2) HealthCare.gov (“See Plans and Prices” section). Group assignment was meant to be random, but due to a programming oversimplification, was alternating. However, researchers had no ability to manipulate assignment order, participants were recruited in multiple locations simultaneously by different staff, and participants arrived at recruitment locations at random with no obvious patterns. The end result is therefore taken to be random for this analysis.
Participants first completed a survey assessing federal poverty level (FPL) and health insurance literacy. They then used SMHP or HealthCare.gov. Those recruited prior to 2016 open enrollment saw plan information from 2015; those recruited during 2016 open enrollment saw 2016 plan data. Participants completed a post-tool survey about confidence in plan choice, decision self-efficacy, health insurance literacy, objective numeracy, and sociodemographics. They received a gift card, a glossary of insurance terms, and information about marketplace enrollment locations. Participants could complete the study at recruitment sites or by appointment at the university.
Measures
Knowledge
Eight questions developed in our past work assessed health insurance knowledge.7,12 Online Appendix B shows these items and the percentage of people answering each item correctly in each group.
Health Literacy Skills
Two items from the Health Insurance Literacy Measure (HILM)23 assessed confidence estimating costs (HILM 1) and understanding terms (HILM 2). The Single Item Literacy Screener24 assessed broader health literacy.
Numeracy Skills
Four items from a validated objective numeracy scale25 assessed numeracy skills.
Demographics
We asked about insurance status, age, gender, race/ethnicity, education, income, household size, and individual and dependent (if applicable) health and smoking status. FPL was categorized into <100% FPL, 100% to 249% FPL, 250% to 400% FPL, and >400% FPL based on subsidy and cost-sharing reduction qualifications. In Missouri and states that did not expand Medicaid, those earning 100% to 249% FPL qualify for subsidies and cost-sharing reduction; those earning 250% to 400% FPL qualify for subsidies only. Those earning <100% FPL do not qualify for Medicaid based on income alone, nor are cost-sharing reduction or subsidies provided.
Confidence in Choice
The four-item SURE Decisional Conflict Scale26 assessed confidence in choice. Higher values indicate more confidence.
Decision Self-Efficacy
The Decision Self-Efficacy Scale27 measured participants’ perceived ability to understand insurance information and resist unwanted decision pressure. Higher values indicate more confidence in one’s decision-making ability.
Intended Plan Choice
Participants indicated the plan they would choose that day. We categorized plans by governmental classifications of metal level (catastrophic, bronze, silver, gold28).
Match With Preferences
After the educational component of the intervention, prior to seeing plans, participants rated how important each of 12 features (e.g., premium, deductible, copayments) was to their choice from 1 (not at all important) to 5 (very important). They also ranked features from most to least important. In analyses, we examined the match between choice and individuals’ most important features, features defined as those rated 4 or 5 and rank-ordered first or second. Of those most important features, all cost-related features were scored a 2 if in the lowest 25% relative to other plans shown, a 1 if in lowest 50%, and a 0 if neither. Other non-quantifiable features (e.g., valuing having fixed costs through copayments rather than a percentage of a bill through coinsurance) were given a 2 if the plan choice included that feature and a 0 if not. For example, consider a participant who rated cost of premium a 5, and cost of deductible as a 4, and ranked cost of premium and cost of deductible as their top two important plan features. If the plan that participant selected had a premium cost in the lowest 25% compared to all their other plan options (assigned a “2”) and had a deductible cost that was in the lowest 50% compared to all their other plan options (assigned a “1”), this participants preference match score would be a 3. This process helped in the case when individuals were forced to make trade-offs between features such as cost of premium and cost of deductible, where both are not expected to be in the lowest 25% of plan options because as one lowers, the other rises. If there was only one dominant important feature (e.g., only one factor rated a 4 or 5 and ranked a top feature, with all others rated a 3 or below), that top feature’s score was multiplied by 2 to yield a total score out of 4. Scores of 3 or 4 were considered a good match, scores of 1 or 2 a moderate match, and scores of 0 a poor match.
Match With Algorithmic Predictions
We examined how many SMHP users selected one of three “good fit” plans as predicted by the algorithm (those using HealthCare.gov did not see an algorithmic prediction).
Data Analysis
Descriptive statistics were compared between groups using the chi-square statistic or Fisher’s exact test for categorical variables and the Kruskal-Wallis test for continuous variables. Primary outcomes included knowledge, decision self-efficacy, and confidence in choice. Secondary outcomes included improvement in HILM and intended plan choice metal level. Improvement in HILM was defined as moving from “not confident” pre-intervention to “a little confident” or “very confident” post-intervention, or from “a little confident” pre-intervention to “very confident” post-intervention. Multivariable linear regression models examined the relation between group and continuous outcomes, and multivariable logistic regression models examined the relation between group and categorical outcomes, controlling for FPL and objective numeracy. We examined data with and without participants who viewed 2015 plan information; because results did not change, results of the full sample are reported. Significance of a = 0.05 was used and all tests were two-sided. The percentage of missing data in multivariable analyses ranged from 1.2% to 5.2%; number of observations included is displayed in Table 3. Statistical package SAS version 9.3 was used for analyses.
Table 3.
Multivariable Analyses Examining Study Group on Outcomes, Controlling for Objective Numeracy and Federal Poverty Level (N = 327)
| Objective Knowledge (n = 323) | Decision elf-Efficacy (n = 323) | Confidence in Choice (SURE)a (n = 322) | Health Insurance Literacy: Postexposure Confidence Improvement
|
Metal Level: Silver Level (or Higher) Plan Selected (n = 310) | |||
|---|---|---|---|---|---|---|---|
| HILM 1: Estimating Cost of Care (n = 322) | HILM 2: Understanding Terms (n = 322) | ||||||
| Group b | HealthCare.gov | 61.7 (58.2–65.3) | 75.3 (70.9–79.6) | 2.9 (2.7–3.1) | Ref | Ref | Ref |
| Show Me My Health Plans | 77.8 (74.4–81.1) | 83.0 (79.0–87.1) | 3.5 (3.3–3.7) | 1.48 (0.92–2.36) | 2.52 (1.58–4.01) | 10.32 (5.94–17.95) | |
| P | <0.001 | 0.002 | <0.001 | 0.10 | <0.001 | <0.001 | |
| Percent of federal poverty levelb | ≥400 | 69.1 (61.4–76.8) | 79.7 (70.4–89.0) | 3.2 (2.7–3.7) | Ref | Ref | Ref |
| 250–399 | 73.5 (66.4–80.5) | 83.0 (74.4–91.5) | 3.3 (2.9–3.8) | 0.52 (0.14–1.85) | 0.77 (0.22–2.66) | 0.30 (0.07–1.27) | |
| 100–249 | 70.1 (66.8–73.5) | 78.6 (74.6–82.7) | 3.2 (3.0–3.4) | 1.21 (0.46–3.17) | 1.63 (0.61–4.36) | 2.70 (0.89–8.18) | |
| <100 | 66.3 (63.6–69.0) | 75.3 (72.0–78.6) | 3.1 (2.9–3.3) | 0.82 (0.32–2.12) | 1.43 (0.54–3.74) | 2.50 (0.84–7.44) | |
| P | 0.16 | 0.30 | 0.82 | 0.26 | 0.39 | 0.001 | |
| Numeracyc | 20592.61 | 24.12 | 2.75 | 20.06 (0.12) | 0.061 (0.11) | 0.09 (0.12) | |
| P | <0.001 | 0.82 | 0.15 | 0.58 | 0.57 | 0.46 | |
Note: HILM = Health Insurance Literacy Measure; CI = confidence interval; OR = odds ratio.
Higher SURE values indicate more choice confidence.
Group and percent of federal poverty level results are presented as least-squares means
(95% CI) for objective knowledge, decision self-efficacy, and confidence in choice. Health insurance literacy and metal level results are presented as OR (95% CI).
Numeracy results are presented as type III sum of squares for objective knowledge, decision self-efficacy, and confidence in choice. Health insurance literacy and metal level results are presented as coefficient (SE).
RESULTS
Participant Characteristics
A total of 393 eligible individuals were approached; 328 (83%) enrolled (Figure 1). The final sample included 164 individuals using SMHP and 163 using HealthCare.gov (Table 1). No significant differences existed between groups across demographic variables except those using SMHP had higher objective numeracy than those using HealthCare.gov (mean = 2.6 v. 2.3, P = 0.03); numeracy was included in multivariable analyses. FPL was also included in multivariable analyses given that FPL is directly related to premium subsidy eligibility, cost-sharing reduction eligibility, and cost-related plan decisions. We added age, education, and race to exploratory analyses; since results did not change when we added these variables to our models, results are reported for the a priori planned analyses, controlling for numeracy and FPL.
Figure 1.
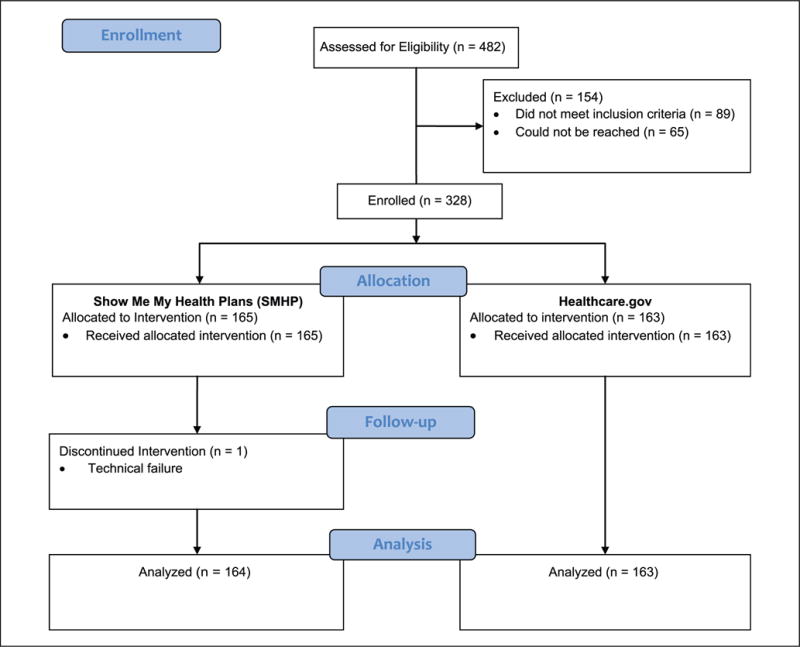
CONSORT flow diagram
Table 1.
Participant Characteristics (N = 327)
| Characteristic Show Me | My Health Plans (n = 164), n (%) | HealthCare.gov (n = 163), n (%) | P |
|---|---|---|---|
| Age, years, mean (SD) | 43.1 (13.2) | 41.4 (12.5) | 0.21 |
| Gender | 0.79 | ||
| Male | 67 (40.9) | 69 (42.3) | |
| Female | 97 (59.2) | 94 (57.7) | |
| Education level | 0.42 | ||
| Less than high school | 12 (7.3) | 15 (9.2) | |
| High school or GED | 111 (67.7) | 99 (60.7) | |
| College and higher | 41 (25.0) | 49 (30.1) | |
| Percent of federal poverty levela | 0.05 | ||
| <100 | 72 (43.9) | 94 (59.1) | |
| 100–249 | 64 (39.0) | 47 (29.6) | |
| 250–399 | 15 (9.1) | 10 (6.3) | |
| 400+ | 13 (7.9) | 8 (5.0) | |
| Urbanicity | 0.80 | ||
| Rural | 9 (5.5) | 11 (6.7) | |
| Suburban | 97 (59.1) | 99 (60.7) | |
| Urban | 58 (35.4) | 53 (32.5) | |
| Race | 0.33 | ||
| African American only | 96 (58.5) | 107 (65.6) | |
| Caucasian only | 46 (28.1) | 41 (25.2) | |
| Other (including mixed) | 22 (13.4) | 15 (9.2) | |
| Hispanic ethnicity: No | 156 (95.1) | 159 (97.6) | 0.24 |
| Number of people covered | 0.26 | ||
| 1 | 97 (59.2) | 106 (65.0) | |
| 2 | 32 (19.5) | 21 (12.9) | |
| 3+ | 35 (21.3) | 36 (22.1) | |
| Smoking status: Yes | |||
| Participant | 55 (33.5) | 47 (28.8) | 0.36 |
| Dependent (n = 124) | 10 (14.9) | 9 (15.8) | 0.89 |
| Chronic condition(s), mean (SD), range | |||
| Participant (n = 207) | 2.27 (1.53), 1–8 | 2.17 (1.35), 1–9 | 0.90 |
| Participant + dependents (n = 107) | 2.69 (2.35), 1–16 | NA | |
| Insurance status: Uninsured | 85 (51.8) | 93 (57.1) | 0.34 |
| Health literacy (SILS)b | 0.18 | ||
| Adequate | 139 (84.8) | 128 (79.0) | |
| Limited | 25 (15.2) | 34 (21.0) | |
| Objective numeracy (Lipkus), mean (SD), range | 2.6 (1.1), 0–4 | 2.3 (1.2), 0–4 | 0.03 |
Note: GED = General Educational Development; SILS = Single Item Literacy Screener; SNS = Subjective Numeracy Scale.
Four HealthCare.gov participants did not report federal poverty level data (n = 159).
One HealthCare.gov participant did not complete the SILS (n = 162).
Time Spent Using SMHP
Participants spent approximately 21.2 minutes (SD 8.8, range 6.1–60.7) using SMHP, including completing research-specific questions. They spent approximately 2.9 minutes (SD 2.6, range 0.3–19.1) on the final plan-sorting page.
Improvement in Decision Quality: Knowledge, Confidence in Choice, Decision Self-Efficacy, and Health Insurance Literacy
After using SMHP or HealthCare.gov, participants using SMHP had higher health insurance knowledge (mean correct = 78% v. 59% using HealthCare.gov; P < 0.0001), higher decision self-efficacy (mean = 82 and 73, respectively, P <0.0001), and more confidence in their choice (mean = 3.5 and 2.9, respectively, P < 0.0001) compared to those using HealthCare.gov (Table 2). More SMHP users compared to HealthCare.gov users showed an improvement in confidence understanding health insurance terms (HILM2 54% v. 32%; P <0.0001). Controlling for objective numeracy and FPL (Table 3), all decision quality outcomes remained significant. Those using SMHP had higher knowledge (LS-Mean = 78 v. 62; P < 0.001), decision self-efficacy (LS-Mean = 83 v. 75; P < 0.002), health insurance literacy (odds ratio = 2.52, P < 0.001, on HILM2), and confidence in their choice (LS-Mean = 3.5 v. 2.9; P <0.001) compared to those using HealthCare.gov.
Table 2.
Bivariate Outcomes Postexposure by Study Condition (N = 327)
| Show Me My Health Plans (n = 164) | HealthCare.gov (n = 163) | P | |
|---|---|---|---|
| Objective knowledge score,a % (SD) | 77.6 (18.2) | 58.8 (21.0) | <0.001 |
| Confidence in choice (SURE),b mean (SD), range | 3.5 (0.9), 0–4 | 2.9 (1.3), 0–4 | <0.001 |
| Decision self-efficacy, mean (SD), range | 81.5 (22.5), 0–100 | 73.0 (20.4), 0–100 | <0.001 |
| Health Insurance Literacy Measure (HILM)c | |||
| Confidence estimating cost of care | |||
| HILM 1—Pre | 0.99 | ||
| Not confident | 38 (23.2) | 38 (23.5) | |
| A little confident | 85 (51.8) | 84 (51.9) | |
| Very confident | 41 (25.0) | 40 (24.7) | |
| HILM 2—Post | 0.003 | ||
| Not confident | 13 (7.9) | 24 (14.8) | |
| A little confident | 64 (39.0) | 81 (50.0) | |
| Very confident | 87 (53.0) | 57 (35.2) | |
| HILM 1 postexposure improvement | 0.06 | ||
| Yes | 66 (40.2) | 49 (30.3) | |
| No | 98 (59.8) | 113 (69.8) | |
| Confidence understanding health insurance terms | |||
| Pre | 0.68 | ||
| Not confident | 37 (22.6) | 37 (22.8) | |
| A little confident | 83 (50.6) | 75 (46.3) | |
| Very confident | 44 (26.8) | 50 (30.9) | |
| Post | <0.001 | ||
| Not confident | 3 (1.8) | 15 (9.3) | |
| A little confident | 61 (37.2) | 77 (47.5) | |
| Very confident | 100 (61.0) | 70 (43.2) | |
| HILM 2 postexposure improvement | <0.001 | ||
| Yes | 88 (53.7) | 51 (31.5) | |
| No | 76 (46.3) | 111 (68.5) | |
| Intended plan choice metal leveld | <0.001 | ||
| Catastrophic | 0 (0.0) | 5 (3.3) | |
| Bronze | 41 (25.3) | 108 (71.1) | |
| Silver | 121 (74.7) | 30 (19.7) | |
| Gold | 0 (0.0) | 9 (5.9) | |
| Platinum | 0 (0.0) | 0 (0.0) |
Objective knowledge score presents % (SD) of 8 items answered correctly.
Higher SURE values indicate more confidence in choice.
One HealthCare.gov participant did not complete the Health Insurance Literacy Measure (n = 162).
Intended plan choice metal level data were not available for two Show Me My Health Plans participants (n = 162) and for 11 HealthCare.gov participants (n = 152).
Intended Plan Choice
Intended plan choice was available for 314 of 327 participants. Others did not find an acceptable plan (1 SMHP, 51 HealthCare.gov), selected a dental-only plan (2 HealthCare.gov), selected a non-ACA plan (1 HealthCare.gov), selected a non-Missouri plan (1 HealthCare.gov), entered unidentifiable plan information (6 HealthCare.gov), or experienced technical failure (1 SMHP).
Metal Level
Because few individuals were eligible for catastrophic plans and few chose gold plans, we combined “Catastrophic or Bronze” and “Silver or Gold” for analyses. Among participants using SMHP, the majority (121/162, 74.7%) selected a silver or gold plan, compared to 30/152 (19.7%) using HealthCare.gov (P < 0.0001; Table 2). The majority using HealthCare.gov (108/152, 71.1%) selected a catastrophic or bronze plan, compared to 41/162 (25.3%) who used SMHP (P < 0.0001). Four HealthCare.gov participants who were ineligible for catastrophic coverage selected a catastrophic plan; no SMHP participants did so. Intended plan choice varied by FPL (P < 0.002); results were still significant when controlling for FPL. The odds of choosing a silver or gold plan were 10.3 times higher among those in the SMHP group compared to those in the HealthCare.gov group (95% confidence interval = 5.94–17.95; P < 0.0001; Table 3).
Match With Preferences and Algorithmic Prediction
The majority of SMHP participants selected plans that were good (85/162, 52.5%) or moderate (71/162, 43.8%) matches with their preferences and matched one of the algorithmic recommendations (134/162, 83.2%). The metal level plan choice of those using SMHP matched the metal level of the “good fit” plans recommended by the algorithm 87.6% of the time. Among participants using HealthCare.gov, we could only examine the preference match for the 60 participants covering themselves. We did not have data on health conditions of dependents in the HealthCare.gov group since they did not use SMHP. In that subset, 21/60 (35.0%) selected plans that were a good preference match, 29/60 (48.3%) selected plans that were a moderate preference match, and 10/60 (16.7%) selected plans that were a poor preference match. Mean preference match score was 2.59 (SD 0.99, range 0–4) among those using SMHP and 1.93 (SD 1.18, range 0–4) among those using HealthCare.gov. In exploratory analyses, we examined the preference match for the 60 participants covering themselves in the HealthCare.gov group to the 96 participants covering themselves in the SMHP group; there were statistically significant differences in the match between preferences and choice between groups (χ2 = 10.92, P = 0.004).
DISCUSSION
Although the ACA took an important step by improving access to quality health insurance, that access needs to be supplemented by education to support individuals in choosing a plan that meets their needs and preferences. To our knowledge, this study was the first to experimentally evaluate a decision aid systematically developed to facilitate comprehension and choices in the federal health insurance marketplace. Results suggest that SMHP can significantly improve health insurance decision quality by improving knowledge, decision self-efficacy, health insurance literacy, and confidence in plan choice. It may also facilitate a match between choice and preferences.
Furthermore, SMHP can significantly improve the odds that individuals enrolling in the marketplace choose silver plans offering the level of coverage likely needed to meet their health needs. In our study, almost two thirds of participants had chronic conditions with a mean of 2.2 conditions (range 1–9). According to HealthCare.gov, bronze-level plans are meant for very healthy people expecting to incur few medical costs. Silver plans are described as the “marketplace standard” level of insurance likely to meet the average consumer’s needs; available subsidies are tied to the second-lowest silver plan’s premium. Given the high number of participants selecting silver plans in the SMHP group, SMHP may have better matched plan choices with coverage needs. Because national enrollment numbers in silver plans are around 69% and many consumers nationally enroll with the help of an assister or broker,29 SMHP could potentially reduce the likelihood that individuals require in-person assistance to enroll in a health plan that meets their needs.
Although some interventions have been or are being developed to facilitate marketplace choices, SMHP is unique in that it uses a tailored, risk-adjusted algorithm to recommend marketplace plans appropriate for users’ individual circumstances.22 By incorporating personalized MEPS data derived from individuals’ age, gender, and health status, plan recommendations are tailored to individual needs. While many enroll in the marketplace with application counselors or in-person assisters, even certified application counselors report difficulty helping consumers navigate the process of selecting a plan (Housten et al., 2016).30 Many feel that the time they have to work with individuals is insufficient to fully support plan selection given the multitude of plan choices that can overwhelm even educated consumers. SMHP can prepare individuals in advance for visits with assisters, help structure conversations with assisters during in-person meetings, or supplement in-person meetings with assisters, depending on user needs. Stakeholder feedback was incorporated throughout development, resulting in a tool that consumers, counselors, and policy makers find useful during consumer enrollment (A. J. Housten and others, unpublished data).
These findings should be interpreted within the context of several study limitations. The state of Missouri did not expand Medicaid. Although that should not affect plan choices of individuals with incomes >100% FPL, it likely affected choices of individuals making <100% FPL since they do not qualify for premium subsidies (written assuming states would expand Medicaid, the ACA did not provide subsidies for that group). Given the added difficulty they faced deciding on a plan, our findings on participants making <100% FPL are not generalizable to Medicaid expansion states. We controlled for FPL in multivariable analyses to account for the impact of FPL on outcomes.
In addition, due to the plethora of plans available (up to 42 options for St. Louis City and County, for example) and the scope of this study, recruitment was limited to a 90-mile radius of St. Louis. Nonetheless, our study did include participants in urban, suburban, and rural counties; over half were African American and the majority had no more than a high school degree. Future work could incorporate additional plan information to achieve a representation of the entire state. Moreover, it is possible that asking choice intentions rather than following people through actual enrollment does not accurately represent enrollment choices. Because the HealthCare.gov cost calculator was not available at the time of our study, we could not compare its efficacy with that of SMHP. However, the HealthCare.gov cost calculator does not personalize expenses based on health status, beyond asking individuals about whether they expect low, medium, or high health care utilization. Like SMHP, it informs individuals about whether they qualify for lower costs on coverage based on FPL. Rather than using annual costs like SMHP, though, it displays list of plans available from lowest to highest monthly premium costs.
Finally, we cannot determine if any one element of SMHP (i.e., the educational component, the cost calculator, the values clarification component) improved decision quality more than others. Although there is some evidence suggesting that decision quality can be best improved by combining educational interventions with default options and cost calculators,31,32 future work could compare the efficacy of each element of SMHP. As our theoretical framework21 and literature suggests, for example, health insurance literacy interventions, independent of cost calculators or default options, may increase participants’ knowledge of health insurance terms and costs, and improve their health insurance decisions.12,15,21,33,34 However, whether knowledge and confidence alone is sufficient to improve choice needs empirical testing. A large body of research investigating choices among Medicare enrollees suggests that individuals frequently choose more costly plans than they should, primarily attending to monthly premium costs rather than considering the full complexity of plan features, even when they are knowledgeable and make active insurance choices.32 Thus, appropriate default options, displaying annual costs rather than monthly costs, and personalizing decision support, as the cost calculator of SMHP does, appear to be necessary components of health insurance decision interventions,32,35,36 particularly among vulnerable populations (e.g., non-white, lower education, lower income, more unmet health needs36).
In conclusion, current ACA marketplace platforms might not adequately support consumers in choosing a health insurance plan. More participants in the SMHP group understood important yet challenging health insurance concepts such as deductibles and network coverage despite information described on the federal website about these concepts. Several HealthCare.gov participants chose plans that were not even available to them (e.g., catastrophic plans, non–Missouri-based plans). Consumer-friendly tools like SMHP could support health plan selection, knowledge about plan details, and increase access to affordable care for individuals across the income spectrum.37 These results may also be useful to consider when designing interventions to support choice in employer-sponsored markets or other countries with private health insurance systems. Future research should continue this line of work exploring ways to facilitate health insurance choices in vulnerable populations with limited financial resources and high health care needs.
Acknowledgments
This research was supported by the National Institute on Minority Health and Health Disparities of the National Institutes of Health under Award Number R01MD008808. The funding agreement ensured the authors’ independence in designing the study, interpreting the data, writing, and publishing the report. The authors would like to thank the following individuals for their contributions to the work: Carey Kebodeaux, MPH, Washington University School of Medicine, St. Louis, MO, for study coordination, data collection, and data management; Norah Rast, Washington University School of Medicine, St. Louis, MO, for data collection and data entry; Amanda Lee, MPH, Washington University School of Medicine, St. Louis, MO, for data collection; Denise Monti, Washington University School of Medicine, St. Louis, MO, for data collection and data entry; the Center for Health Communication Research at the University of Michigan, for tool design and programming assistance. Dr. Politi has recently consulted for Merck & Co and had an investigator-initiated grant from Merck & Co, both on topics unrelated to this article. Dr. Ubel has recently consulted for Humana Inc. and Genomic Health.
Footnotes
The authors report no other conflicts of interest.
References
- 1.Uberoi N, Finegold K, Gee E. Health insurance coverage and the Affordable Care Act, 2010–2016. [cited 2016 Mar 3]. Available from: https://aspe.hhs.gov/sites/default/files/pdf/187551/ACA2010-2016.pdf.
- 2.Department of Health and Human Services. Overview of the uninsured in the United States: a summary of the 2011 Current Population Survey. [cited 2011 Sep]. Available from: https://aspe.hhs.gov/basic-report/overview-uninsured-united-states-summary-2011-current-population-survey.
- 3.Department of Health and Human Services. Health Insurance Marketplaces 2016 open enrollment period: final enrollment report. [cited 2016 Nov 3]. Available from: https://aspe.hhs.gov/health-insurance-marketplaces-2016-open-enrollment-period-final-enrollment-report.
- 4.Carman KG, Eibner C, Paddock SM. Trends in health insurance enrollment, 2013–2015. Health Aff (Millwood) 2015;34(6):1044–8. doi: 10.1377/hlthaff.2015.0266. [DOI] [PubMed] [Google Scholar]
- 5.Golbeck AL, Ahlers-Schmidt CR, Paschal AM, Dismuke SE. A definition and operational framework for health numeracy. Am J Prev Med. 2005;29(4):375–6. doi: 10.1016/j.amepre.2005.06.012. [DOI] [PubMed] [Google Scholar]
- 6.Long SK, Shartzer A, Politi M. Low levels of self-reported literacy and numeracy create barriers to obtaining and using health insurance coverage. [cited 2014 Oct 27]. Available from: http://hrms.urban.org/briefs/Low-Levels-of-Self-Reported-Literacy-and-Numeracy.html.
- 7.Politi MC, Kaphingst KA, Kreuter M, Shacham E, Lovell MC, McBride T. Knowledge of health insurance terminology and details among the uninsured. Med Care Res Rev. 2014;71(1):85–98. doi: 10.1177/1077558713505327. [DOI] [PubMed] [Google Scholar]
- 8.Paez KA, Mallery CJ. A little knowledge is a risky thing: wide gap in what people think they know about health insurance and what they actually know. [cited 2014 Oct 22]. Available from: http://www.air.org/resource/little-knowledge-risky-thing-wide-gap-what-people-think-they-know-about-health-insurance.
- 9.Wong CA, Asch DA, Vinoya CM, et al. Seeing health insurance and HealthCare.gov through the eyes of young adults. J Adolesc Health. 2015;57(2):137–43. doi: 10.1016/j.jadohealth.2015.04.017. [DOI] [PubMed] [Google Scholar]
- 10.Levitt L. Why health insurance literacy matters. JAMA. 2015;313(6):555–6. doi: 10.1001/jama.2014.17419. [DOI] [PubMed] [Google Scholar]
- 11.Quincy L. What’s behind the door: consumer difficulties selecting health plans. [cited 2012 Jan]. Available from: https://www.mnsure.org/assets/MR-CUConsumerSelect_tcm34-183778.pdf.
- 12.Politi MC, Kaphingst KA, Liu JE, et al. A randomized trial examining three strategies for supporting health insurance decisions among the uninsured. Med Decis Making. 2015;36(7):911–22. doi: 10.1177/0272989X15578635. [DOI] [PubMed] [Google Scholar]
- 13.Hibbard JH, Slovic P, Jewett JJ. Informing consumer decisions in health care: implications from decision-making research. Milbank Q. 1997;75(3):395–414. doi: 10.1111/1468-0009.00061. [DOI] [PMC free article] [PubMed] [Google Scholar]
- 14.Hibbard JH, Jewett JJ, Engelmann S, Tusler M. Can Medicare beneficiaries make informed choices? Health Aff (Millwood) 1998;17(6):181–93. doi: 10.1377/hlthaff.17.6.181. [DOI] [PubMed] [Google Scholar]
- 15.Barnes AJ, Hanoch Y, Rice T. Determinants of coverage decisions in health insurance marketplaces: consumers’ decision-making abilities and the amount of information in their choice environment. Health Serv Res. 2015;50(1):58–80. doi: 10.1111/1475-6773.12181. [DOI] [PMC free article] [PubMed] [Google Scholar]
- 16.Cohen RA, Martinez ME. Health insurance coverage: early release of estimates from the National Health Interview Survey, January–March 2015. [cited 2015 Aug]. Available from: http://www.cdc.gov/nchs/data/nhis/earlyrelease/insur201508.pdf.
- 17.Sinaiko AD, Mehrotra A, Sood N. Cost-sharing obligations, high-deductible health plan growth, and shopping for health care: enrollees with skin in the game. JAMA Intern Med. 2016;176(3):395–7. doi: 10.1001/jamainternmed.2015.7554. [DOI] [PMC free article] [PubMed] [Google Scholar]
- 18.Collins SR, Rasmussen PW, Beutel S, Doty MM. The problem of underinsurance and how rising deductibles will make it worse. Findings from the Commonwealth Fund Biennial Health Insurance Survey, 2014. Issue Brief (Commonw Fund) 2015;13:1–20. [PubMed] [Google Scholar]
- 19.Wong C, Nirenburg G, Polsky D, Town R, Baker T. Insurance plan presentation and decision support on HealthCare.gov and state-based web sites created for the Affordable Care Act. Ann Intern Med. 2015;163(4):327–8. doi: 10.7326/L15-5127. [DOI] [PubMed] [Google Scholar]
- 20.Wong CA, Polsky DE, Jones AT, Weiner J, Town RJ, Baker T. For third enrollment period, marketplaces expand decision support tools to assist consumers. Health Aff (Millwood) 2016;35(4):680–7. doi: 10.1377/hlthaff.2015.1637. [DOI] [PubMed] [Google Scholar]
- 21.Hibbard JH, Peters E. Supporting informed consumer health care decisions: data presentation approaches that facilitate the use of information in choice. Annu Rev Public Health. 2003;24:413–33. doi: 10.1146/annurev.publhealth.24.100901.141005. [DOI] [PubMed] [Google Scholar]
- 22.Politi MC, Barker AR, Kaphingst KA, McBride T, Shacham E, Kebodeaux CS. Show me my health plans: a study protocol of a randomized trial testing a decision support tool for the federal health insurance marketplace in Missouri. BMC Health Serv Res. 2016;16(1):55. doi: 10.1186/s12913-016-1314-9. [DOI] [PMC free article] [PubMed] [Google Scholar]
- 23.Paez KA, Mallery CJ, Noel H, et al. Development of the Health Insurance Literacy Measure (HILM): conceptualizing and measuring consumer ability to choose and use private health insurance. J Health Commun. 2014;19(Suppl 2):225–39. doi: 10.1080/10810730.2014.936568. [DOI] [PMC free article] [PubMed] [Google Scholar]
- 24.Morris NS, MacLean CD, Chew LD, Littenberg B. The Single Item Literacy Screener: evaluation of a brief instrument to identify limited reading ability. BMC Fam Pract. 2006;7:21. doi: 10.1186/1471-2296-7-21. [DOI] [PMC free article] [PubMed] [Google Scholar]
- 25.Lipkus IM, Samsa G, Rimer BK. General performance on a numeracy scale among highly educated samples. Med Decis Making. 2001;21(1):37–44. doi: 10.1177/0272989X0102100105. [DOI] [PubMed] [Google Scholar]
- 26.Legare F, Kearing S, Clay K, et al. Are you SURE? Assessing patient decisional conflict with a 4-item screening test. Can Fam Physician. 2010;56(8):e308–14. [PMC free article] [PubMed] [Google Scholar]
- 27.O’Connor AM. Validation of a decisional conflict scale. Med Decis Making. 1995;15(1):25–30. doi: 10.1177/0272989X9501500105. [DOI] [PubMed] [Google Scholar]
- 28.Patient Protection and Affordable Care Act, Pub L No 111-148. 2010 [Google Scholar]
- 29.Pollitz K, Tolbert J, Ma R. Survey of Health Insurance Marketplace Assister Programs and Brokers. 2015 [cited 2015 Aug 6]. Available from: http://kff.org/health-reform/report/2015-survey-of-health-insurance-marketplace-assister-programs-and-brokers/
- 30.Housten AJ, Furtado K, Kaphingst KA, Kebodeaux C, McBride T, Cusanno B, Politi MC. Stakeholders’ perceptions of ways to support decisions about health insurance marketplace enrollment: a qualitative study. BMC Health Serv Res. 2016;16(1):634. doi: 10.1186/s12913-016-1890-8. [DOI] [PMC free article] [PubMed] [Google Scholar]
- 31.Johnson EJ, Hassin R, Baker T, Bajger AT, Treuer G. Can consumers make affordable care affordable? The value of choice architecture. PLoS One. 2013;8(12):e81521. doi: 10.1371/journal.pone.0081521. [DOI] [PMC free article] [PubMed] [Google Scholar]
- 32.Handel B, Kolstad J. Getting the most from marketplaces: smart policies on health insurance choice. [cited 2015 Oct]Available from: http://www.hamiltonproject.org/assets/files/smart_policies_on_health_insurance_choice_final_proposal.pdf.
- 33.Brown V, Russell M, Ginter A, et al. Smart Choice Health InsuranceÓ: A new, interdisciplinary program to enhance health insurance literacy. Health Promot Pract. 2016;17(2):209–16. doi: 10.1177/1524839915620393. [DOI] [PubMed] [Google Scholar]
- 34.Barthlomae S, Russell M, Braun B, McCoy T. Building health insurance literacy: evidence from the Smart Choice Health Insuranceä program. J Fam Econ Issues. 2016;37(2):140–55. [Google Scholar]
- 35.Pacific Business Group on Health. Consumer choice of health plan: decision support rules for health exchanges, Installments I, II, & III. [cited 2012 Nov 30]. Available from: www.pbgh.org/storage/documents/pbgh_planchoicerules01-03_120312.pdf.
- 36.Barnes AJ, Hanoch Y, Rice T, Long SK. Moving beyond blind men and elephants: providing total estimated annual costs improves health insurance decision making. Med Care Res Rev. doi: 10.1177/1077558716669210. [DOI] [PubMed] [Google Scholar]
- 37.Shartzer A, Long SK, Anderson N. Access to care and affordability have improved following Affordable Care Act implementation; problems remain. Health Aff (Millwood) 2016;35(1):161–8. doi: 10.1377/hlthaff.2015.0755. [DOI] [PubMed] [Google Scholar]