Abstract
Photothrombosis of blood vessels refers to the activation of a circulating photosensitive dye with a green light to induce clotting in vivo (Watson et al., 1985). Previous studies have described how a focused green laser could be used to noninvasively occlude pial arterioles and venules at the brain surface (Schaffer et al., 2006; Nishimura et al., 2007; Shih et al., 2013). Here we show that small regions of the capillary bed can similarly be occluded to study the ischemic response within the capillary system of the mouse cerebral cortex. The advantage of this approach is that the ischemic zone is restricted to a diameter of approximately 150–250 μm. This permits higher quality two-photon imaging of degenerative processes that would be otherwise difficult to visualize with models of large-scale stroke, due to excessive photon scattering. A consequence of capillary occlusion is leakage of the blood-brain barrier (BBB). Here, through the use of two-photon imaging data sets, we show how to quantify capillary leakage by determining the spatial extent and localization of intravenous dye extravasation.
Keywords: Blood-brain barrier, Photothrombosis, Ischemia, Two-photon imaging, Capillary, Stroke
Background
Numerous animal models exist to induce ischemia on a large scale via occlusion major cerebral arteries (Carmichael, 2005). However, there are some aspects of stroke that are not accessible to in vivo two-photon imaging. In regions experiencing more severe ischemia, cells swell due to ionic imbalance, and this edematous process contributes to increased light scattering, greatly reducing the quality and depth of in vivo two-photon imaging. A smaller zone of ischemia would reduce photon scattering, and still allow neurovascular changes associated with ischemia to be more clearly visualized over time in vivo.
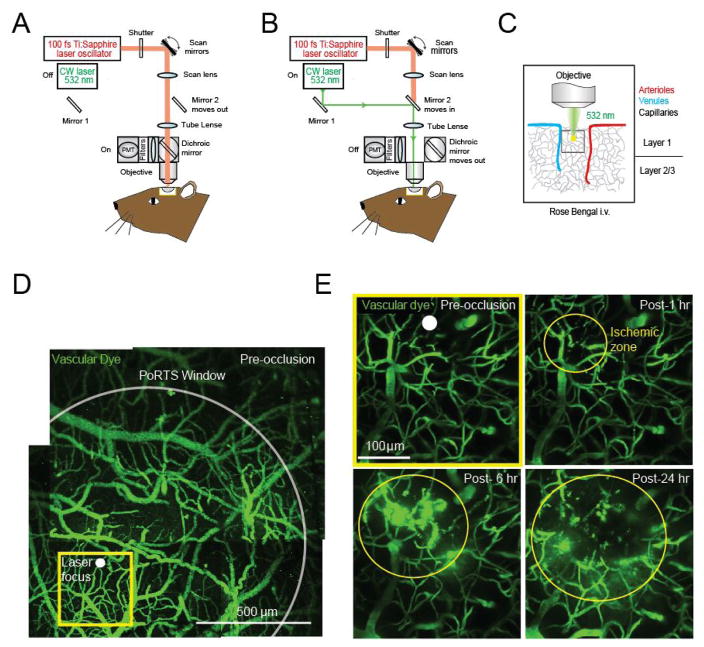
We recently showed that spatially restricted regions of ischemia could be generated by focused photothrombotic irradiation of the cortical capillary bed (Underly et al., 2017). Capillary occlusions were highly reproducible, could be targeted to specific locations, and initiated at precise times through a cranial imaging window. The resulting ischemic zone occupied less than 1% of the area accessible through a typically cranial window (Figures 1D and 1E), allowing multiple strokes to be examined in one window.
Figure 1. Photothrombotic occlusion of capillaries in mouse cortex.
A. Schematic illustrating two-photon imaging laser and B. photothrombotic green laser beam paths in a typical two-photon imaging microscopy. C. The objective brings the green laser to a focus in upper layers of cortex allowing for photothrombotic irradiation of capillaries. D. Wide-field vascular map of the imaging area contained within the PoRTS window, obtained by montaging several maximally z-projected images collected using a 4x objective. E. Magnified region within the window, visualized with a 20x objective (projected over 100 μm of depth, beginning ~10 μm below the pial surface), showing ischemic damage to capillaries over 24 h.
Here, we describe the steps involved in inducing photothrombotic occlusion in a small region of the capillary bed during in vivo two-photon imaging. We build upon a previous protocol in which individual cortical penetrating arterioles were occluded, rather than capillaries (Taylor and Shih, 2013). We also demonstrate the analysis of BBB leakage produced as a consequence of capillary occlusion using Imaris, a 3-D visualization software.
Materials and Reagents
Filter paper (GE Healthcare, catalog number: 1001-0155)
Cotton swabs (Fisher Scientific, catalog number: 23-400-119)
Cover glass (thickness: No. 0) (Thomas Scientific, catalog number: 6661B40)
0.3 ml insulin syringes (BD, catalog number: 328438)
Petri dish
An adult mouse of any common laboratory strain, ~25 to 35 g in weight
-
Isoflurane (Patterson Veterinary Supply, catalog number: 07-806-3204)
Manufacture: Zoetis, catalog number: 10015516.
Phosphate buffered saline (PBS) (Sigma-Aldrich, catalog number: P4417-50TAB)
Agarose type 3-A (Sigma-Aldrich, catalog number: A9793)
Fluorescein-dextran (2 MDa; 5% w/v in saline) (Sigma-Aldrich, catalog number: FD2000S)
Rose Bengal (1.25% w/v in saline) (Sigma-Aldrich, catalog number: 330000-1G)
Buprenorphine hydrochloride (Buprenex®) (Patterson Veterinary Supply, catalog number: 07-891-9756)
Sodium chloride (NaCl) (Sigma-Aldrich, catalog number: S7653-1KG)
Potassium chloride (KCl) (Sigma-Aldrich, catalog number: P9333-500G)
Calcium chloride (CaCl2) (Sigma-Aldrich, catalog number: C1016-100G)
Magnesium chloride (MgCl2) (Sigma-Aldrich, catalog number: M8266-100G)
Glucose (Sigma-Aldrich, catalog number: G8270)
HEPES (Sigma-Aldrich, catalog number: H7006)
Artificial cerebral spinal fluid (ACSF) (see Recipes)
Equipment
Heating pad with feedback regulation (FHC, catalog number: 40-90-2-07)
Heating pad control system (FHC, catalog number: 40-90-8D)
Rectal Thermistor Probe (FHC, catalog number: 40-90-5D-02)
Isoflurane vaporizer (Datex-Ohmeda, model: IsoTec4)
Induction chamber (VetEquip, catalog number: 941444)
Dental drill (Osada, model: EXL-M40)
-
Auxiliary equipment for two-photon microscope (Sutter Moveable Objective System [Taylor and Shih, 2013])
Objective lens 4x, 0.16 NA (Olympus, model: UPLSAPO)
Objective lens 20x, 1.0 NA, Water immersion (Olympus, model: XLUMPlanFI)
Green laser 532 nm (Beta Electronics, model: MGM20). Details for how the green laser line is directed into the Sutter MOM imaging beam path was described in a separate protocol (Taylor and Shih, 2013)
-
Computer specifications (for Imaris)
16 GB RAM
3.3 GHz CPU
AMD Radeon RX 480 4GB or better
1280 × 1024 Resolution Monitor
Software
-
Imaris (Bitplane)
Imaris 7.6 (or current)
Imaris Batch Module
Fiji software (https://imagej.net/Fiji/Downloads)
Procedure
A. Cranial windows
In order to perform photothrombotic occlusion of capillaries, a cranial imaging window must be generated in the mouse skull. Both thinned skull windows (Drew et al., 2010; Yang et al., 2010) and windows involving full removal of skull can be used (Holtmaat et al., 2009). Occlusions can also be performed through windows that are acute (< 24 h) or chronic. Images shown in this protocol used polished and reinforced thinned-skull windows (PoRTs), and a video and detailed written procedure for this window type is available (Shih et al., 2012a and 2012b).
B. Two-photon microscope and laser for photothrombosis
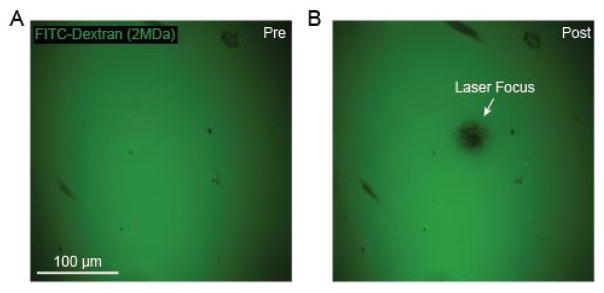
Our system passes a green laser beam through to the imaging objective via the two-photon imaging beam path (Figures 1A and 1B). The microscope we use is a Sutter Moveable Objective Microscope, and details for how to introduce a green laser has been described previously (Taylor and Shih, 2013). The green laser greatly under-fills the back aperture of the 20x objective (Olympus; XLUMPlanFI), yielding a fixed laser focus with ~20–40 μm diameter at the imaging plane. The power of the green laser is ~1 mW at the sample. Prior to initiating photothrombotic occlusion, the location of the green laser focus should be determined. To do this, we place a small piece of filter paper in a Petri dish, apply 25 μl of fluorescein-dextran onto the filter paper and cover with a cover glass. The filter paper is imaged using the 20x objective, and then irradiated with the green laser. The green laser photobleaches the fluorescent dye at its focus, providing a target location relative to the imaging field (Figures 2A and 2B). This is also described in-depth in a previous protocol (Taylor and Shih, 2013). The filter set we use to detect fluorescein-dextran emission is 525/70m-2P (Chroma Corp).
Figure 2. Green laser focusing for targeted photothrombosis.
A. FITC-Dextran on filter paper prior to irradiation with green laser; B. Photobleached region of filter paper following irradiation with green laser light revealing the laser focus.
C. Targeted photothrombotic occlusion
Anesthetize the mouse and affix the animal’s head to a stable imaging apparatus under the two-photon microscope. For anesthesia, the data shown here is collected from a C57BL/6 mouse under 0.75 to 1.5% isoflurane supplied in medical air. However, other types of anesthesia can also be used. Typically, a custom machined aluminum flange is attached to the head using dental cement during a pre-surgical procedure. Later, the metal flange can be secured to a custom holder using screws. There are many variations of head fixation that are compatible to this protocol. See methods in Shih et al. (2012a) for one method for head fixation of mice.
Administer 25 μl of 5% w/v fluorescein-dextran (2 MDa) into the infraorbital vein. Using a 0.3 ml insulin syringe, carefully inset the needle tip 3 mm into the corner of the eye closest to the animal’s midline. To ensure that the needle does not penetrate too deeply, place a mark on the needle 3 mm from the tip using a black marker. The needle should go behind the eye, slightly pushing the eye laterally. Inject the contents of the syringe over a period of 20 sec. None of the solution should accumulate outside the eye, when correctly administered. Withdraw the syringe and carefully clean the eye with a moistened cotton swab. Ophthalmic ointment should then be applied to both eyes to avoid desiccation. A video for this procedure is also available (Shih et al., 2012b). This procedure should be done under anesthesia, and with care to avoid damage to the eye. The vasculature should be clearly visible with two-photon imaging immediately after injection. Too deep insertion of the needle will result in fluorescein-dextran within the cranium and increased subdural fluorescence during two-photon imaging.
Starting at a low magnification with the 4x objective, obtain z-stacks of the vasculature over the entire cortical area accessible through the cranial window. These images, when montaged, provide a map of the cortical vasculature for navigation at higher magnification (Figure 1D).
Change to the 20x objective and focus on the larger vessels at the pial surface. Use the map collected at lower magnification to determine your location within the imaging window.
Locate a region of capillaries without larger vessels overlying them (Figure 1E). When finding a capillary location of interest, target a region at least 20 μm away from larger penetrating vessels, which may lead to larger strokes if inadvertently occluded.
Place the target of the green laser over the region of the capillary bed that is to be irradiated (Figures 1D and 1E; white dot).
-
Inject 25–50 μl of 1.25% Rose Bengal into the infraorbital vein, using the same method describe above for fluorescein-dextran.
IMPORTANT: Check to be sure that the field of view and green laser focus has not shifted prior to beginning laser irradiation.
-
Initiate photothrombosis by turning on the green laser light (Figure 1B) (1 mW at the sample) and allowing irradiation for 25 sec.
IMPORTANT: The Rose Bengal dye will only remain in the blood stream for ~5–10 min, with rapid removal from the blood plasma over this period. Thus, it is important to perform irradiation as quickly as possible after administering Rose Bengal.
D. Imaging the evolution of capillary ischemia
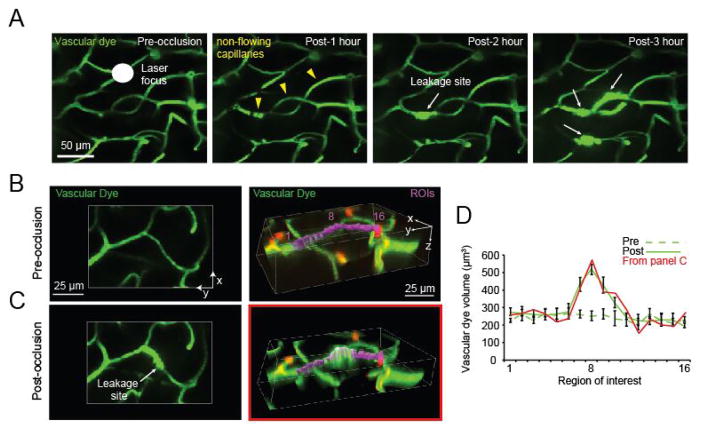
One can expect to observe complete cessation of blood flow in ~10 capillary segments within a 211 × 211 × 150 μm cube of tissue immediately after the 25 sec irradiation (Figure 3A; yellow arrowheads). A capillary segment is defined as a length of capillary between branch-points. The integrity of the capillary wall is typically maintained in for the first 0.5–1 h after which localized sites of dye leakage begin to appear from non-flowing capillaries (Figure 3A; white arrows). The number of these leakage sites increases gradually over a period of 3 h. For each imaging time-point, we collect image z-stacks of the irradiated region. While our studies have characterized changes occurring in the first 3 h post-occlusion (Underly et al., 2017), the precise experimental time-line and imaging interval can be adapted based on the experimental question.
Figure 3. In vivo observation and post-hoc quantification of capillary leakage.
A. In vivo tracking of capillary leakage over 3 h following photothrombotic irradiation of cortical capillaries; B. Two-dimensional (left) and 3-dimensional (right) representation of capillaries before irradiation. Sixteen ROIs (purple) are strung along a capillary segment in the 3-dimensional panel, with ROI 8 positioned at the central point of leakage. C. The same vessels are shown 1 h after irradiation, when fluorescein-dextran leakage is evident. D. Graph of fluorescein-dextran volumes pre (dotted line) and post (solid line) irradiation, corresponding to the capillary leakage site. The post-irradiation dye volume trace for data of panel C is shown as solid red line.
E. Image processing
Imaris supports numerous imaging formats, but Fiji software can be used to convert formats not compatible with Imaris to .tif files. Ensure that the pixel/micron ratios for x–y and z planes are correctly entered into Imaris. The ratios can be modified in Image Properties within the Imaris software. It is also important to consider your file names as Imaris will combine similar file names not separated into different folders.
Begin by identifying the initial regions of dye leakage by utilizing the two-dimensional .tif stacks in Fiji. These are regions in which the intravascular dye has begun to expand beyond the initial (pre-image) border of the blood vessels, and are associated with a region of high intensity fluorescence (Figure 3A; white arrows).
Using Imaris, open the image stacks containing the fluorescein channel, captured during or after dye leakage has begun.
-
With an image rendered in 3-dimensions in Imaris, string regions of interest (ROIs) along the vasculature where leakage is occurring (Figures 3B and 3C; purple, right column).
These ROIs are created by using the ‘Surface’ feature in Imaris and selecting the ‘region of interest’ option.
Start by placing an initial region identified at the site of leakage. Then string ROIs outward from this central point, without overlap, to sample surrounding regions of the capillary segment. These ROIs should be appropriately sized so that the depth of the ROI is never completely filled to avoid a volume ceiling effect which would prevent finding the region of peak dye extravasation.
Data analysis
With ROIs volumetrically rendered (the concluding step in Surface creation) a graphical representation of the volumes can be produced. This can be done by graphing the dye leakage volumes within each ROI (found in the ‘statistics tab’ of Imaris). By having several ROIs strung along the capillary, areas with a significant increase in leakage can be differentiated by showing a significant change in volume between ROIs from images prior to, and following, capillary occlusion (Figure 3D). This difference can be found by performing t-tests comparing each of the corresponding ROIs (ROI 1 pre vs. ROI 1 post, etc.). An ANOVA may be necessary instead of a t-test if the number of groups or times used during experimentation fit the criteria for an ANOVA.
Notes
In regard to the capillary occlusions and dye leakage, there is a lot of variability in the volume of dye depending on the time of sampling. It is important to image at time points (every 15 min or more) frequent enough to capture the formation of the event.
Recipes
-
Fluorescein-dextran
5% (w/v) in sterile PBS
Preloaded as aliquots in 0.3 ml insulin syringes
Stored at −20 °C
-
Rose Bengal
1.25% solution (w/v) in sterile PBS
Preloaded as aliquots in 0.3 ml insulin syringes
Stored at −20 °C
-
Artificial cerebral spinal fluid (ACSF)
125 mM NaCl
5 mM KCl
10 mM glucose
3.1 mM CaCl2
1.3 mM MgCl2
10 mM HEPES (pH 7.4)
Maintain at 4 °C
Acknowledgments
Our work is supported by grants to A.Y.S. from the NINDS (NS085402, NS096997), National Science Foundation (1539034), the Dana Foundation, the American Heart Association (14GRNT20480366), Alzheimer’s Association NIRG award, South Carolina Clinical and Translational Institute (UL1TR000062), Charleston Conference on Alzheimer’s Disease New Vision Award, and an Institutional Development Award (IDeA) from the NIGMS under grant number P20GM12345.
References
- 1.Carmichael ST. Rodent models of focal stroke: size, mechanism, and purpose. NeuroRx. 2005;2(3):396–409. doi: 10.1602/neurorx.2.3.396. [DOI] [PMC free article] [PubMed] [Google Scholar]
- 2.Drew PJ, Shih AY, Driscoll JD, Knutsen PM, Blinder P, Davalos D, Akassoglou K, Tsai PS, Kleinfeld D. Chronic optical access through a polished and reinforced thinned skull. Nat Methods. 2010;7(12):981–984. doi: 10.1038/nmeth.1530. [DOI] [PMC free article] [PubMed] [Google Scholar]
- 3.Holtmaat A, Bonhoeffer T, Chow DK, Chuckowree J, De Paola V, Hofer SB, Hubener M, Keck T, Knott G, Lee WC, Mostany R, Mrsic-Flogel TD, Nedivi E, Portera-Cailliau C, Svoboda K, Trachtenberg JT, Wilbrecht L. Long-term, high-resolution imaging in the mouse neocortex through a chronic cranial window. Nat Protoc. 2009;4(8):1128–1144. doi: 10.1038/nprot.2009.89. [DOI] [PMC free article] [PubMed] [Google Scholar]
- 4.Nishimura N, Schaffer CB, Friedman B, Lyden PD, Kleinfeld D. Penetrating arterioles are a bottleneck in the perfusion of neocortex. Proc Natl Acad Sci U S A. 2007;104(1):365–370. doi: 10.1073/pnas.0609551104. [DOI] [PMC free article] [PubMed] [Google Scholar]
- 5.Schaffer CB, Friedman B, Nishimura N, Schroeder LF, Tsai PS, Ebner FF, Lyden PD, Kleinfeld D. Two-photon imaging of cortical surface microvessels reveals a robust redistribution in blood flow after vascular occlusion. PLoS Biol. 2006;4(2):e22. doi: 10.1371/journal.pbio.0040022. [DOI] [PMC free article] [PubMed] [Google Scholar]
- 6.Shih AY, Blinder P, Tsai PS, Friedman B, Stanley G, Lyden PD, Kleinfeld D. The smallest stroke: occlusion of one penetrating vessel leads to infarction and a cognitive deficit. Nat Neurosci. 2013;16(1):55–63. doi: 10.1038/nn.3278. [DOI] [PMC free article] [PubMed] [Google Scholar]
- 7.Shih AY, Driscoll JD, Drew PJ, Nishimura N, Schaffer CB, Kleinfeld D. Two-photon microscopy as a tool to study blood flow and neurovascular coupling in the rodent brain. J Cereb Blood Flow Metab. 2012a;32(7):1277–1309. doi: 10.1038/jcbfm.2011.196. [DOI] [PMC free article] [PubMed] [Google Scholar]
- 8.Shih AY, Mateo C, Drew PJ, Tsai PS, Kleinfeld D. A polished and reinforced thinned-skull window for long-term imaging of the mouse brain. J Vis Exp. 2012b;(61) doi: 10.3791/3742. [DOI] [PMC free article] [PubMed] [Google Scholar]
- 9.Taylor ZJ, Shih AY. Targeted occlusion of individual pial vessels of mouse cortex. Bio Protoc. 2013;3(17) doi: 10.21769/bioprotoc.897. [DOI] [PMC free article] [PubMed] [Google Scholar]
- 10.Underly RG, Levy M, Hartmann DA, Grant RI, Watson AN, Shih AY. Pericytes as inducers of rapid, matrix metalloproteinase-9 dependent capillary damage during ischemia. J Neurosci. 2017;37:129–140. doi: 10.1523/JNEUROSCI.2891-16.2016. [DOI] [PMC free article] [PubMed] [Google Scholar]
- 11.Watson BD, Dietrich WD, Busto R, Wachtel MS, Ginsberg MD. Induction of reproducible brain infarction by photochemically initiated thrombosis. Ann Neurol. 1985;17(5):497–504. doi: 10.1002/ana.410170513. [DOI] [PubMed] [Google Scholar]
- 12.Yang G, Pan F, Parkhurst CN, Grutzendler J, Gan WB. Thinned-skull cranial window technique for long-term imaging of the cortex in live mice. Nat Protoc. 2010;5(2):201–208. doi: 10.1038/nprot.2009.222. [DOI] [PMC free article] [PubMed] [Google Scholar]


