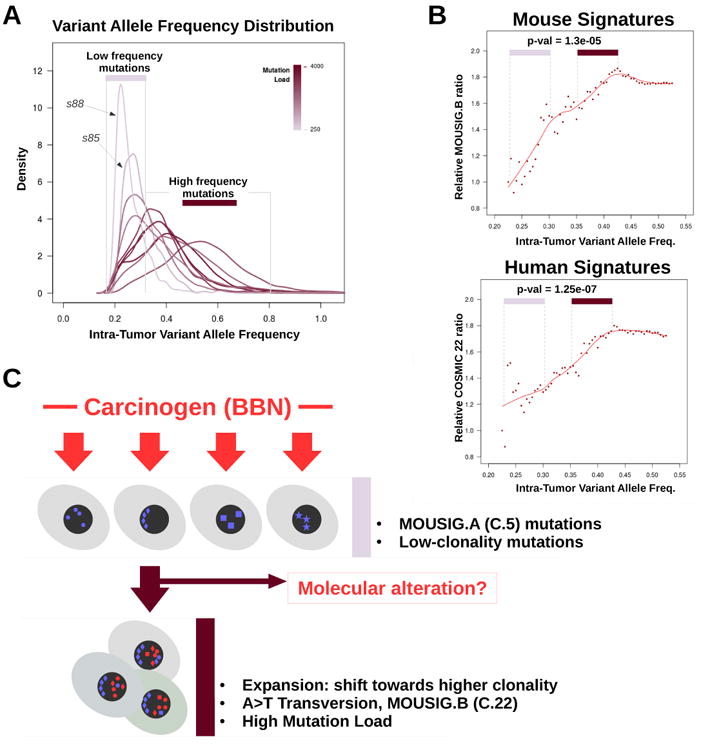
Figure 4. Relationship Between Mutation Load and Intra-tumor Variant Allele Frequencies in BBN Tumors.

(A) Density plot showing the distributions of intra-tumor variant frequencies for each BBN tumor. Peaks shifting toward the right side of the x-axis indicate accumulation of mutations that are shared by a larger fraction of cancer cells in the tumor (clonal expansion). Line color corresponds to mutation load. Area under the curve (AUC) of each line was set to unity. (B) Scatterplot showing the relative abundance of MOUSIG-B (top) or COSMIC-22 (bottom) signatures as function of the intra-tumor variant allele frequency. Points in the frequency ranges of 0.225-0.300 (low frequency mutations) and 0.350-0.425 (high frequency mutations) were compared via t-test, and p-values were 1.3e-05 and 1.27e-07, respectively. Trendlines were computed using LOESS (red lines). (C) Diagram summarizing the hypothesized model that may explain genetic instability in the BBN model. Geometric shapes represent mutations acquired as consequence of processes linked to MOUSIG-A (blue) and MOUSIG-B (red) mutational signatures.
