Abstract
Background and Purpose
Intracranial dAVFs carry a risk of significant neurological complication but can be difficult to detect on structural MRI and TOF-MRA. The purpose of this study was to assess the accuracy and added value of 3D pseudocontinuous arterial spin labeling (PCASL) MRI for detection of these lesions.
Materials and Methods
This retrospective study included 39 patients with a dAVF and 117 controls who had undergone both DSA and MRI with PCASL. Two neuroradiologists blinded to the DSA results independently assessed MRI with and without PCASL. They recorded specific signs, including venous ASL signal, and the likelihood of a dAVF using a 5-point Likert scale. Logistic regression and receiver operating characteristic analyses were performed to determine the accuracy of specific signs and the added value of PCASL. Interobserver agreement was determined using k statistics.
Results
Identification of venous ASL signal had a high sensitivity (94%) and specificity (88%) for the presence a dAVF. Receiver operating characteristic analysis showed significant improvement in diagnostic performance with addition of PCASL in comparison with structural MRI (Δarea under the curve 0.179) and a trend toward significant improvement in comparison with structural MRI with time-of-flight MRA (Δarea under the curve 0.043). Interobserver agreement for the presence of a dAVF improved substantially and was almost perfect with addition of PCASL (κ 0.92).
Conclusion
Venous ASL signal has high sensitivity and specificity for the presence of a dural arteriovenous fistula and the addition PCASL increases confidence in the diagnosis of this entity on MRI.
Introduction
Dural arteriovenous fistulas (DAVFS) are intracranial arteriovenous shunting lesions characterized by direct connection between dural arteries and either a dural sinus or cortical vein1,2. Consequent increase in blood flow and pressure in draining veins can lead to complications, including cerebral edema, ischemia and hemorrhage2. The gold standard for the diagnosis of a dAVF, catheter-based DSA, is invasive, utilizes ionizing radiation, and carries a very small but not insignificant risk of permanent neurological injury3.
The clinical presentation of dAVFs is non-specific and broad, ranging from asymptomatic to pulsatile tinnitus, seizure, altered mental status, and/or intracranial hemorrhage4. In a number of these patients, an alternative etiology for the presentation is not identified by standard non-invasive imaging methods, and there remains clinical suspicion for a dAVF. A sensitive non-invasive imaging method for detection of dAVFs would help avoid exposing such patients to the risks (and costs) of diagnostic DSA. 3D TOF MRA, time-resolved contrast-enhanced MRA, and CTA techniques have been shown to have a high sensitivity and specificity for the identification of dAVFs5-10. The diagnosis of dAVFs in daily practice on these conventional imaging studies remains a challenge, however. Unlike AVMs - which often have a conspicuous nidus surrounded by brain tissue – dAVFs often manifest only subtle findings on structural imaging4,11. An easily applicable imaging method that increases the conspicuity of dAVFs would therefore be valuable.
ASL is a completely non-invasive MR imaging technique that is now widely available on clinical MRI scanners. ASL signal is not observed in cerebral veins under normal conditions due to T1 decay during capillary transit and exchange with the extravascular space of labeled blood water protons11,12. In conditions with arteriovenous shunting such as dAVFs, rapid transit of labeled blood directly from feeding arteries to draining veins results in high signal in venous structures11,12. This venous ASL signal is a conspicuous finding that can alert the reader to the presence of shunting. Conventional sequences can then be more closely scrutinized for structural signs of a dAVF. Preliminary studies indicate that ASL improves the detection of small intracranial shunting lesions and increases the reader's diagnostic confidence11. These prior investigations, however, included AVMs and only a small number of dAVFs11,12.
The purpose of this case-control study is to assess the value of an MRI protocol augmented with 3D pseudo-continuous ASL (PCASL) for the detection of dAVFs and to determine whether reader accuracy and confidence are improved over MRI with conventional structural sequences and TOF-MRA.
Methods
Patient Popluation
This retrospective study was approved by our institutional review board.
39 patients (15 female, 24 male, aged 8-86 years, mean age: 55 years) with a dAVF and 117 controls (51 female, 66 male, aged 4 months-80 years, mean age: 50) who underwent both DSA and MRI with 3D PCASL at our institution between 6/1/2009 (PCASL was used in routine brain MRI protocols from this date) and 9/30/2014 were included. To develop our study population, reports of consecutive cerebral DSAs performed during this time period were searched for the terms “dAVF”, “dural AVF”, “arteriovenous fistula”, “fistula” and “carotid cavernous”. This yielded 792 patients: 139 consecutive patients with a dAVF and 653 patients with no dAVF:
1. DAVF Cases
56 of 139 patients with a dAVF diagnosed on DSA also had an MRI with 3D PCASL. One patient was excluded due to markedly motion-degraded images, and 16 due to angiographically complete treatment of the fistula prior to the MRI. Of the 39 patients included in the study, MRI and DSA were performed prior to any treatment of the fistula in 26 and following partial treatment (with DSA evidence of residual shunting) in 13. Fistula Cognard grades13 were: I (10); IIa (7); IIb (7), II a+ b (8), III (6) and IV (1). Fistula locations were: transverse and/or sigmoid sinus (14); marginal sinus (2); superior sagittal sinus (3); torcula Herophilii (1); vein of Galen (3); sphenoparietal sinus (1); cavernous sinus (8); cortical vein (6 – 2 infratentorial); and tentorium cerebelli (1). Clinical presentations were: intracranial hemorrhage (12); pulsatile tinnitus (9); chemosis/proptosis (6); cranial nerve VI palsy (2); seizures (2); dementia (1); and follow up of previous dural venous sinus thrombosis (2) and meningioma resection (2).
2. Controls
653 patients who had undergone DSA due to a clinical presentation (eg pulsatile tinnitus or intracranial hemorrhage of unclear origin) potentially attributable to an intracranial vascular malformation did not have a dAVF. Patients with an AVM (which is also associated with arteriovenous shunting) on DSA were excluded. 219 of these patients had an MRI with PCASL, and 117 of these patients (three times the number of cases) were randomly selected as controls.
In patients with multiple imaging studies, the DSA and MRI examinations temporally closest to each other were selected (mean time interval 46 days for the control group and 57 days for the dAVF group).
Imaging Methods
68 (16 cases; 52 controls) MRIs were performed at 3T (Discovery 750w; GE Healthcare, Waukesha, WI) and 88 (23 cases and 65 controls) at 1.5T (Signa HDx; GE Healthcare, Waukesha, WI).
3D PCASL imaging (TR/TE: 4800/9.5 ms [1.5T], 5000/10.5 ms [3T]; 24 cm FOV) with background suppression was implemented using a labeling period of 1500 ms, a post label delay (PLD) of 2000 ms, the labeling plane at the level of the foramen magnum, and a segmented 3D stack-of-spirals FSE readout (spiral arms: 6 [1.5T]; 8 [3T]). In-plane spatial resolution was 3-4 mm and through-plane spatial resolution 4-6 mm, yielding 24-40 slices. Scan time was 3.5-6 minutes. No vascular crusher gradients were used. This acquisition complies with the consensus recommendations of the ASL community14. The presence of venous ASL signal was assessed on the label-control subtraction images and required no post-processing.
3D multi-slab TOF MRA (1.5T: TR/TE, 30/2.9 ms; FOV, 22 cm; matrix, 320 × 192; 1.4 mm slice thickness. 3T: TR/TE, 22/2.5 ms; FOV 24 cm; matrix 512 × 288; 1.2 mm slice thickness) was performed in 147 patients (36 cases and 111 control.
All 156 MRI examinations also included the following sequences: sagittal T1-weighted (1.5T: TR/TE, 600/15 ms; 3T: TR/TE/TI 1800/6.7/920 ms) and axial: T2-weighted FSE (TR/TE, 4800/84 ms [1.5T], 4000/100 ms [3T]), T2*-weighted GRE (TR/TE, 600/30 ms [1.5T], 600/15 ms [3T]), T2-weighted FLAIR (TR/TE/TI, 8802/110/2200 ms [1.5T], 9000/143/2300 [3T]) and diffusion-weighted (b = 1000 s/mm2; TR/TE, 6000/70 ms [1.5T]; 5000/83 ms [3T]) imaging performed with a 24 cm FOV 5 mm slice thickness.
Catheter-based DSA for clinical work-up of the dAVF was performed by one of three interventional neuroradiologists (with 5, 12 and over 20 years' experience respectively) in a dedicated biplane neuroangiography suite (Axiom Artis; Siemens, Erlangen, Germany). Imaging included at minimum antero-posterior and lateral views obtained following selective injection with iodinated contrast medium (iohexol, Omnipaque 300; GE Healthcare, Chalfont St. Giles, United Kingdom) of the internal carotid, external carotid and/or vertebral artery supplying the dAVF.
CTA was not included in this evaluation as it is not routinely performed for evaluation of suspected dAVF at our institution and it was therefore inconsistently available in the patients in the study population.
Image Interpretation
MRI
MRIs were independently reviewed in random order by two neuroradiologists (with 20 years and 5 years post-fellowship experience) blinded to the clinical data and DSA findings. Review of non-enhanced CT performed prior to MRI was not permitted, as it was unavailable in a large number of dAVF patients (n=31).
The readers rated the likelihood of a dAVF on a 5-point Likert scale (1. very unlikely; 2. unlikely; 3. equally likely and unlikely; 4. likely; and 5. very likely) based on sequences presented to them. The reads were performed in two separate sittings -with and without PCASL - two months apart to negate the effects of memory and learning:
First sitting: PCASL was omitted.
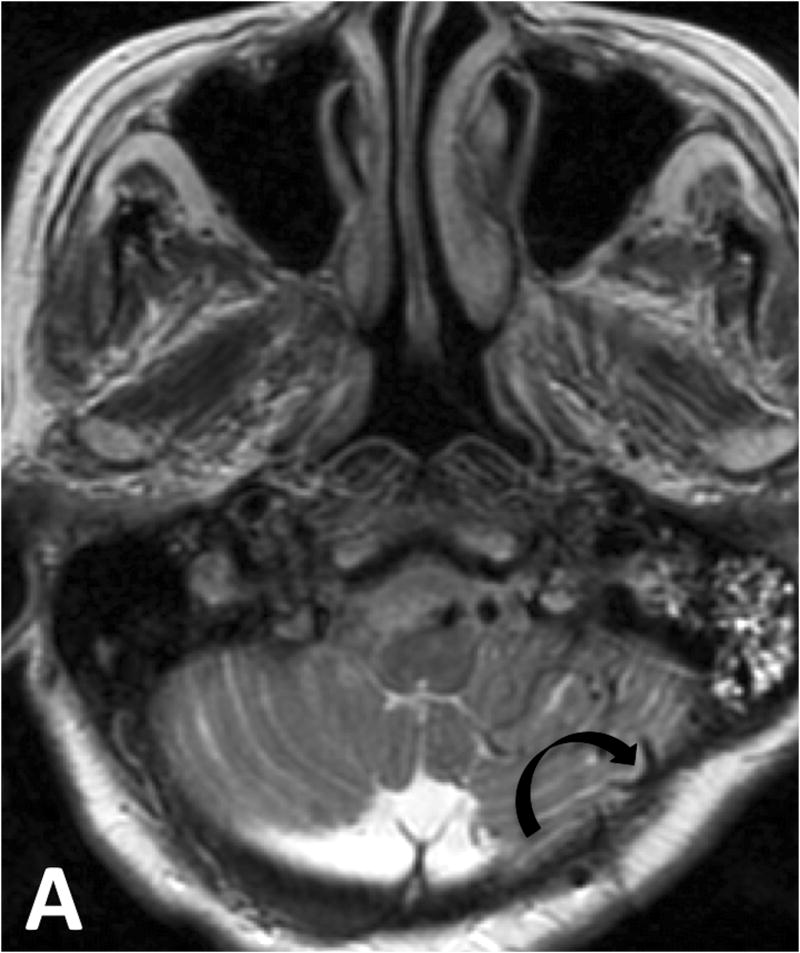
Step 1: Structural sequences (T1- and T2-weighted imaging, FLAIR and GRE) were reviewed first to establish the baseline accuracy of MRI for identification of dAVF. Presence or absence of each of the following signs was recorded: intracranial hemorrhage; white matter T2 hyperintensity with mass effect (edema); abnormal vessels (abnormal clusters of flow voids, serpiginous and/or dilated leptomeningeal or medullary vessels, and/or venous pouches) (Figure 1a); and enlarged (reader's subjective impression) dural venous sinus. dAVFs in the cavernous sinus may produce characteristic features suggestive of this diagnosis, therefore these signs were also specifically recorded: cavernous sinus enlargement, superior ophthalmic vein enlargement, proptosis, and/or orbital oedema. The overall likelihood of a dAVF was then rated on the 5-point Likert scale.
Step 2: In the 151 patients where TOF-MRA was performed, source images and MIPs were assessed next. The following signs were recorded as present or absent: hyperintense (signal higher than that of suppressed background tissue and similar to that within arteries hyperintense) dural venous sinus (Figure 1b) or cortical vein; nodular and/or curvilinear hyperintense structures5 (NCH) adjacent to a dural venous sinus, representing the fistula itself (Figure 1b); increased number or size of arteries near a dural venous sinus; and/or enlargement of external carotid artery branches5,6. The overall likelihood of a dAVF based on TOF-MRA and structural features was rated on the 5-point Likert scale.
Figure 1.
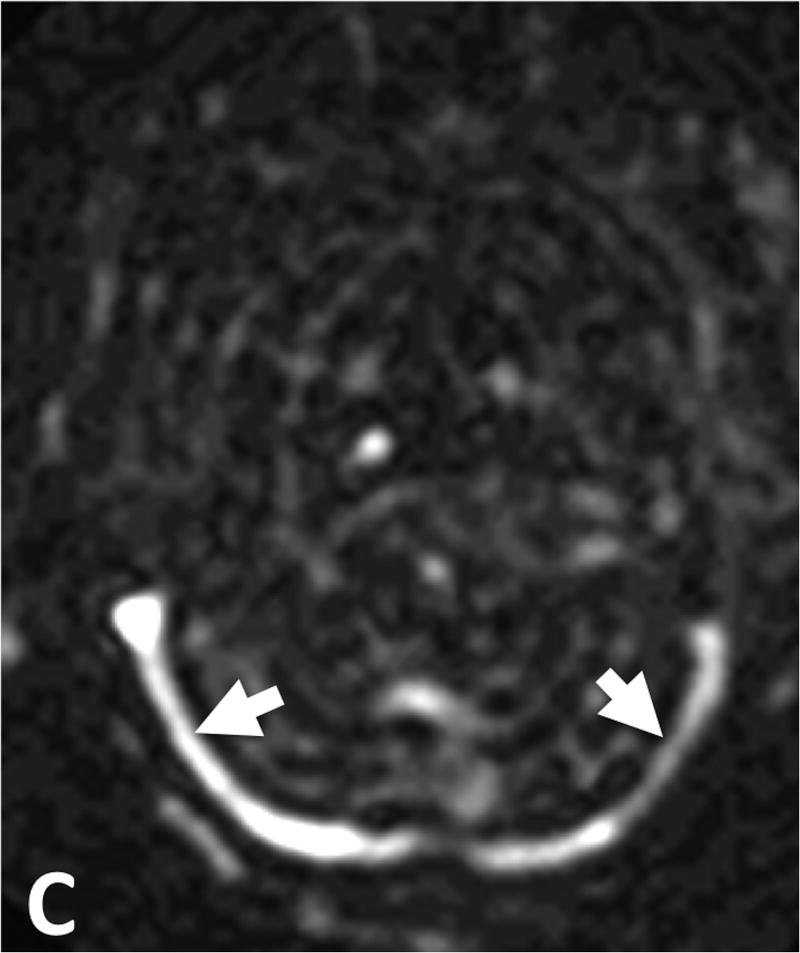
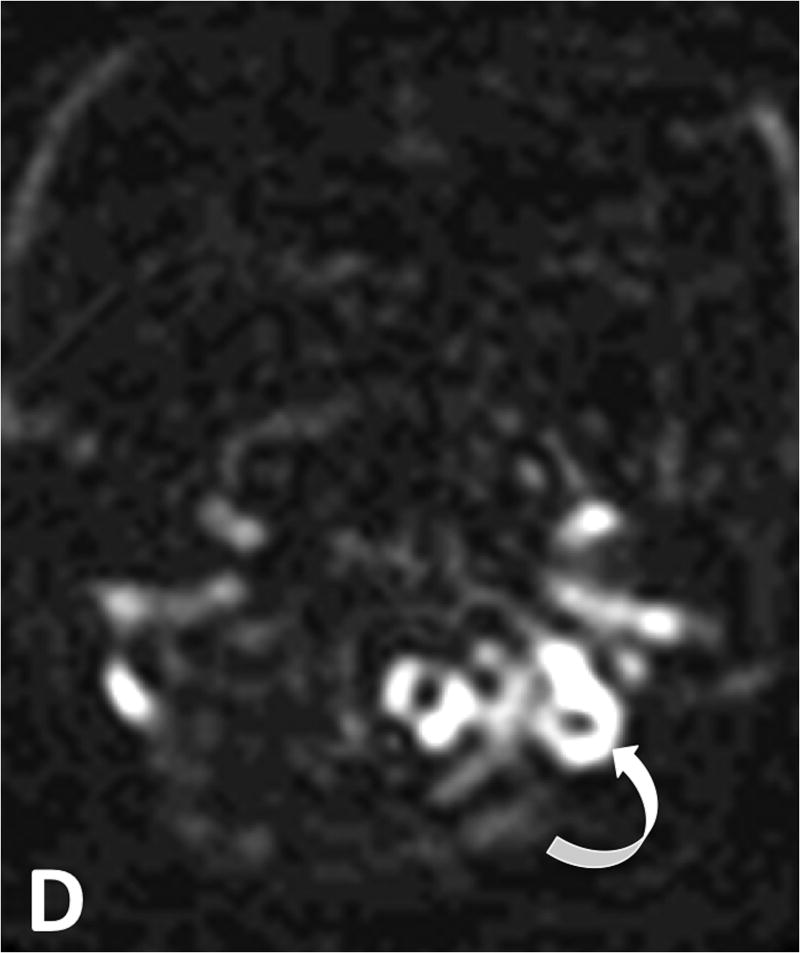
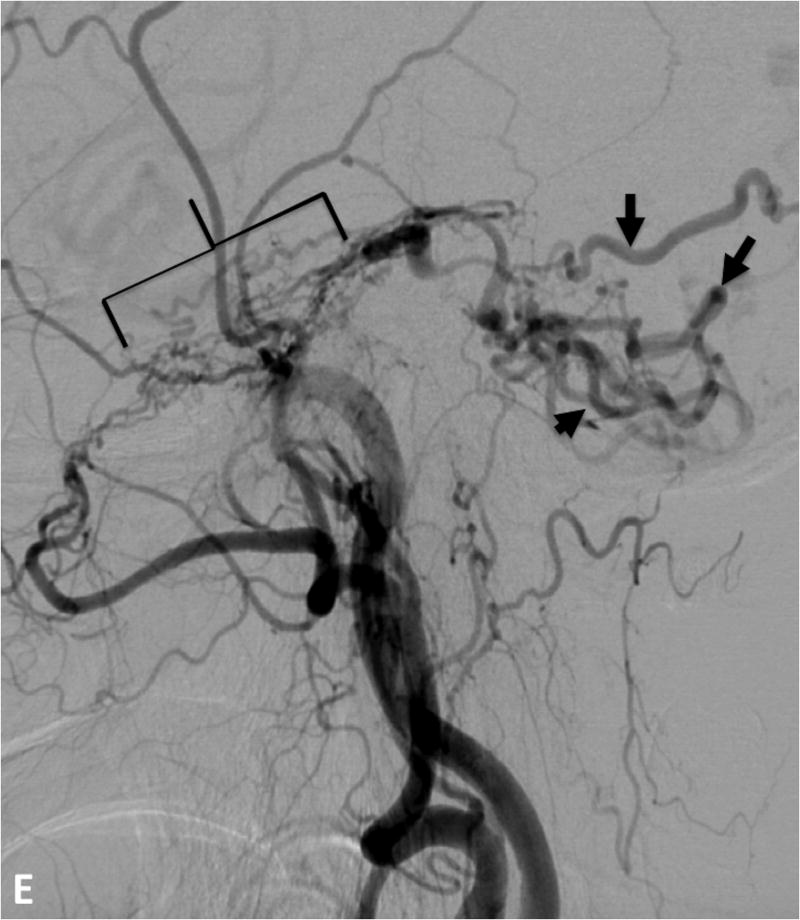
79 year-old woman presenting with ataxia. A. T2-weighted imaging demonstrates tortuous and ectatic pial veins (curved black arrow) along the inferior surface of the left cerebellar hemisphere. B. MIP TOF-MRA image demonstrates nodular and curvilinear hyperintensities immediately superior to the left petrous apex representing the left tentorial fistula (white circle) and high signal in the transverse sinuses (white arrow heads) C. PCASL image shows venous ASL signal in the transverse sinuses (white arrows) due to shunting. D. Further inferiorly venous ASL signal is seen in draining pial veins (white curved arrow). E. DSA image following left external carotid artery injection confirms a Cognard type IV left tentorial dAVF (bracket) with middle meningeal artery supply and drainage directly into ectatic cerebellar cortical veins (black arrows).
B) Second sitting: PCASL was first reviewed in conjunction with anatomical sequences. The presence or absence of venous ASL signal - defined as the presence of high signal intensity on PCASL images within a dural venous sinus (Figure 1c), deep venous structure, and/or cortical vein (Figure 1d) - was recorded. TOF-MRA (source and MIP images) was subsequently reviewed and the overall likelihood of a dAVF based on all sequences was rated.
The presence of a dAVF on angiography was considered the gold standard. Where there was discordance between the findings on MRI and angiography, the DSA and MRI were reviewed in consensus by the two neuroradiologists and an experienced neurointerventional radiologist.
Statistical Analysis
All statistical analyses were performed using SPSS (IBM SPSS Statistics 24.0.0.1, 64bit) and MedCalc (MedCalc Statistical Software Version 17.2, 64bit, Ostend, Belgium).
To test the added value of PCASL, sensitivity and specificity analyses (individual reader and pooled) were performed for: (i) conventional structural MRI (sMRI) alone; (ii) structural MRI and TOF MRA (sMRI/MRA); (iii) structural MRI, TOF MRA and PCASL (sMRI/MRA/PCASL) using ROC analyses by non-parametric estimation of the area-under-the-ROC-curve (AUC) and subsequent pairwise comparison using the DeLong algorithm.
Sensitivity, specificity, PPV and NPV for individual imaging features were computed using the readers' classification tables, with the reference standard being the presence or absence of dAVF. The likelihood of a dAVF (on DSA) based on the identification of an individual imaging feature was determined using univariate binary logistic regression. A likelihood-ratio test between multivariate binary logistic regression models was performed to determine whether addition of the venous ASL signal feature yielded a stronger association with the presence of a dAVF than structural features alone or structural plus TOF-MRA features [Appendix A].
Interobserver agreement between readers was assessed using the Cohen's kappa (κ) statistic for specific imaging features; and a linear weighted κ statistic for the likelihood of a dAVF. A kappa of at least 0.61 (substantial agreement) was made a prerequisite to pool reader scores for subsequent analysis.
Results
Individual Imaging Features
Venous ASL signal had the highest sensitivity (94%; 95% C.I. 88% – 99%) and NPV (98%; 95% C.I. 96%-100%) for dAVF of all the investigated specific features [Table 1]. Venous ASL signal and other signs of dAVF were not visible even on post hoc review of two false negative cases. Both were low flow dAVFs (one incidentally detected tentorial fistula in a patient undergoing DSA for evaluation of aneurysmal subarachnoid hemorrhage and one low flow cavernous sinus dAVF).
Table 1. Individual imaging features: univariate binary logistic regression analysis on DSA features and inter-reader agreement.
| Imaging Feature | OR | SE | Wald | p | Sensitivity [95% CI] % | Specificity [95% CI] % | PPV [95% CI] % | NPV [95% CI] % | Inter-observer agreement [95% CI] |
|---|---|---|---|---|---|---|---|---|---|
| Structural MRI | |||||||||
| ICH | 0.18 | 1.32 | 37.84 | 0.001 | 37.2 [26.5-47.9] | 23.1 [17.7–28.5] | 13.9 [9.2–18.6] | 52.4 [43.0–62.1] | 0.99 [0.97–1.00] |
| Vasogenic edema or gliosis | 0.36 | 1.37 | 10.59 | 0.001 | 20.8 [11.7–58.1] | 58.1 [51.8–64.4] | 14.0 [7.7–20.4] | 69.0 [62.6–75.5] | 1.00 [1.00–1.00] |
| Abnormal vessels | 5.57 | 1.32 | 37.24 | 0.001 | 59.0 [48.1–69.9] | 79.5 [74.3–84.7] | 48.9[38.8-59.0] | 85.3 [80.6-90.0] | 0.73 [0.67-0.79] |
| Enlarged sinus | 2.58 | 1.36 | 9.50 | 0.002 | 31.2 [20.8–41.5] | 79.9 [73.9–85.8] | 40.7 [28.1–53.2] | 72.4 [66.1–78.7] | 0.69 [0.61–0.76] |
| Enlarged SOV* | 3.68 | 1.62 | 7.36 | 0.007 | 12.7 [5.3–20.0] | 96.2 [93.7–98.6] | 52.6 [30.2–75.1] | 76.5 [71.7–81.4] | 0.83 [0.74–0.93] |
| Cavernous sinus enlargement | 34.80 | 2.14 | 21.85 | 0.001 | 23.1 [13.7–32.4] | 99.2 [98.0–100.3] | 90.0 [76.9–103.2] | 79.5 [74.8–84.1] | 0.89 [0.82–0.97] |
| Orbital edema/proptosis | 12.26 | 2.23 | 10.38 | 0.001 | 10.3 [3.5–17.0] | 99.2 [98.0–100.3] | 80.0 [55.2–104.8] | 76.8 [72.1–81.6] | 1.00 [1.00–1.00] |
| Time-of-Flight MRA | |||||||||
| NCH** | 114.70 | 1.88 | 56.75 | 0.001 | 61.1 [49.9-72.4] | 98.7 [97.1–100.2] | 93.6 [86.6–100.6] | 88.7 [84.7-92.6] | 0.87 [0.82–0.93] |
| Abnormal vessels | 6.00 | 1.34 | 37.28 | 0.001 | 59.7 [48.4–71.1] | 80.2 [74.9–85.4] | 49.4 [38.9-59.9] | 86.0 [81.3–90.7] | 0.38 [0.30–0.46] |
| Venous signal | 20.75 | 1.47 | 60.96 | 0.001 | 87.5 [79.9-95.1] | 74.8 [69.1–80.5] | 52.9 [44.0–61.9] | 94.9 [91.6–98.1] | 0.87 [0.83–0.91] |
| Enlarged extracranial arteries | 17.81 | 1.41 | 70.98 | 0.001 | 62.5 [51.3–73.7] | 91.4 [87.8–95.1] | 70.3 [59.1–81.5] | 88.3 [84.1–92.4] | 0.76 [0.69–0.83] |
| ASL | |||||||||
| Venous ASL signal | 103.20 | 1.65 | 84.95 | 0.001 | 93.6 [88.2–99.0] | 87.6 [83.4–91.8] | 71.5 [62.8–80.3] | 97.6 [95.6–99.7] | 0.94 [0.9 – 0.97] |
SOV = Superior ophthalmic vein
NCH =Nodular and/or curvilinear hyperintensities
Nodular and/or curvilinear hyperintensities (NCH) on TOF-MRA (Figure 1b) had a much lower sensitivity (61%; 95% C.I. 50% -72%]. Of the 36 patients with a fistula who had undergone TOF-MR, the fistula was located above the TOF-MRA slab in three on post hoc analysis. Of the 33 patients whose fistula was located within the TOF-MRA slab, NCH were not identified in 9 (reader 1) and 13 (reader 2) patients, and they were absent in 7 patients (21%) on post hoc review. Three were Cognard III fistulae with a single feeding artery.
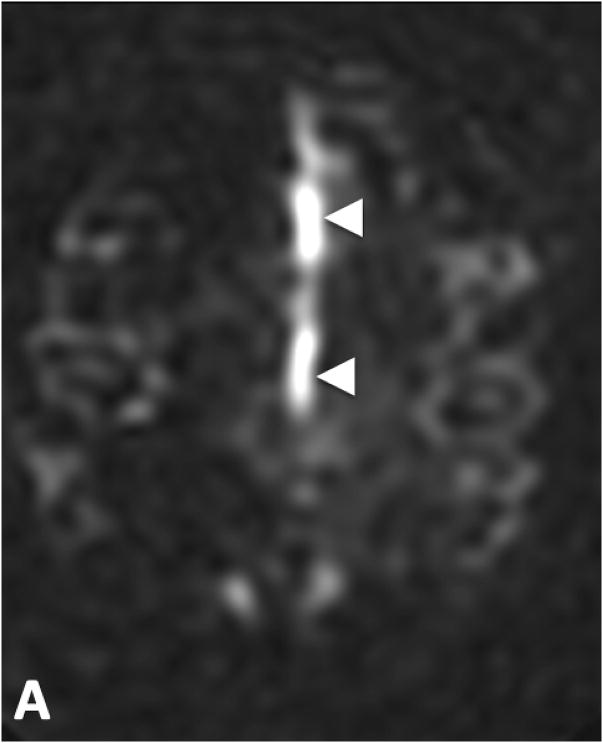
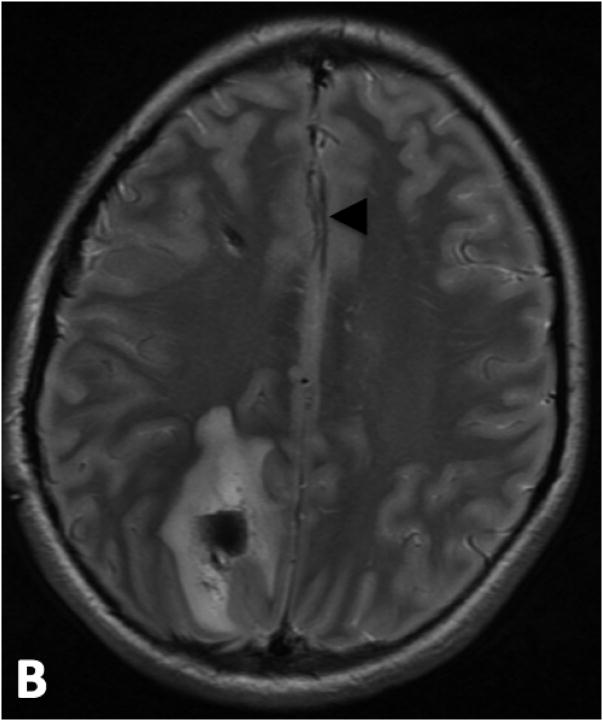
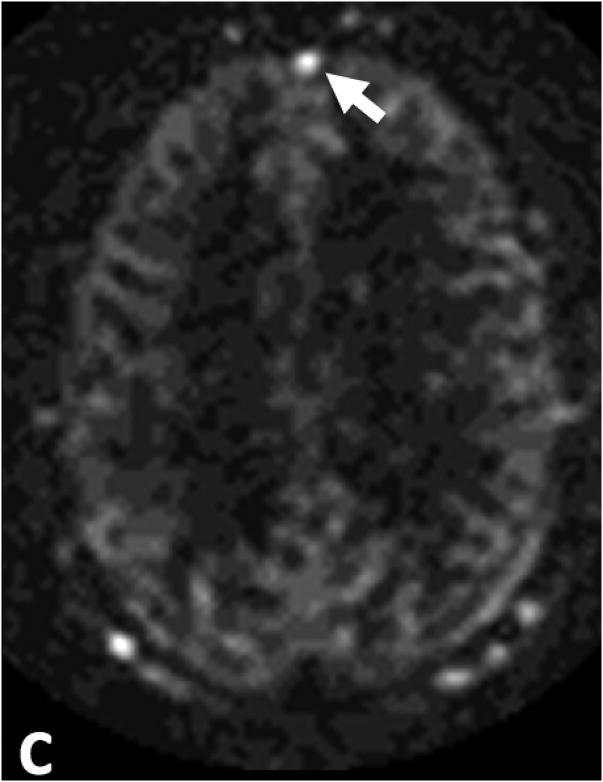
Univariate binary logistic regression analyses found extremely high odds ratios for both venous ASL signal (103) and NCH (114), reflecting their high specificity. There were a number of false positives for venous ASL signal in our cohort, and therefore its specificity (88%;95% C.I. 83%-92%) was lower than that of NCH (99%;95% C.I. 97%-100%). On post hoc review of these 16 false positive cases, cortical vein ASL signal was evident in 4 and dural venous sinus ASL signal was seen in 11. A definite cause for this ASL signal such as an AVM, hypervascular tumor or subacute stroke could not be discerned on review of these patients' clinical history and follow-up imaging including DSAs. In 3 patients, cortical vein ASL signal was observed immediately adjacent to parenchymal hematoma and we hypothesize that hematoma may have compressed and obscured (on DSA and conventional MRI) a small parenchymal AVM. The other most likely explanation for venous ASL signal in these cases, as well as 7 of the patients with dural sinus ASL signal, is seizure incited by parenchymal hematoma. In the 4 remaining patients, mild ASL signal in the anterior superior sagittal sinus [Figure 2c] was not associated with parenchymal hematoma and this is likely a normal variant. there may have been a small underlying AVMs in each of these cases, obscured and compressed by hematoma hence occult on DSA and structural MRI. Alternatively, subclinical seizures incited by hematoma would also account for the venous ASL signal.
Figure 2.
False positive venous ASL signal in two patients. A. ASL signal in the A3 branches of the anterior cerebral arteries (white arrow heads) was mistaken for venous ASL signal in a 15 year-old male patient who presented with a right parietal parenchymal hematoma. B. T2-weighted images show localization of this signal to the anterior cerebral arteries (black arrow heads). C. ASL signal in the anterior aspect of the superior sagittal sinus in a 70 year-old male with subarachnoid hemorrhage (white arrow). This patient had no evidence of a dAVF or shunting on DSA.
Arterial transit artifact15 was mistaken for venous ASL signal in 1 control [Figure 2a]. Venous hyperintensity on TOF-MRA had a lower specificity (75%; 95% C.I. 69%- 80%] than venous ASL signal due to a greater number of false positives (26 for reader 1 and 30 for reader 2).
Structural imaging signs of a fistula were of high specificity but low sensitivity and NPV. Although signs of a cavernous sinus dAVF had high specificity and odds ratios, fistulae in this location were too sparsely represented in our study cohort to draw meaningful conclusions related to these findings.
Agreement between the readers was almost perfect (κ > 0.81) for all individual features except three TOF-MRA parameters: enlarged sinus, enlarged extracranial arteries, and abnormal vessels (Table 1). Only fair agreement (κ > 0.21) was reached on the latter.
Overall assessment
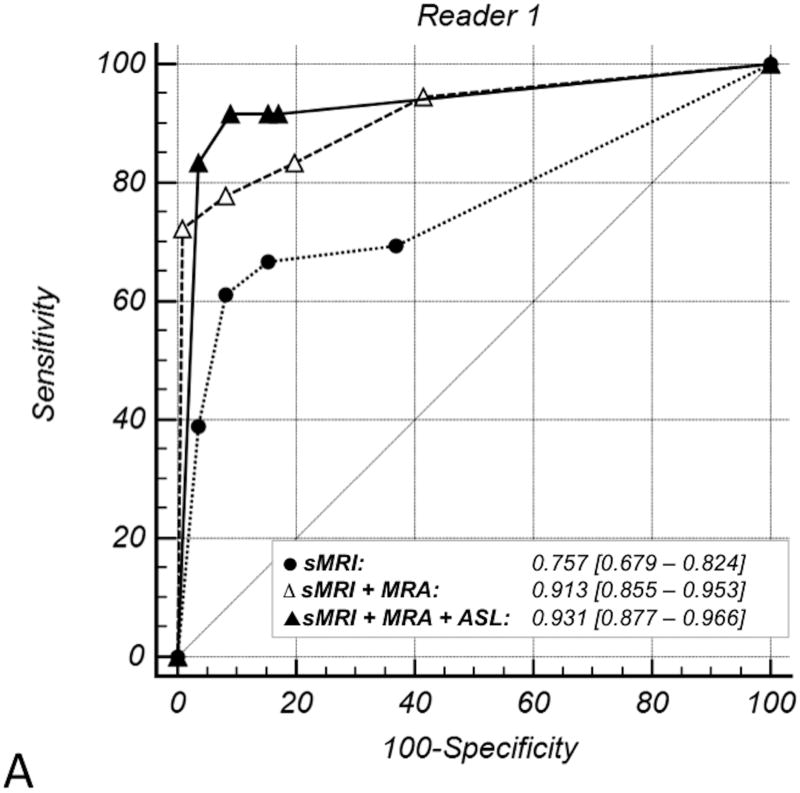
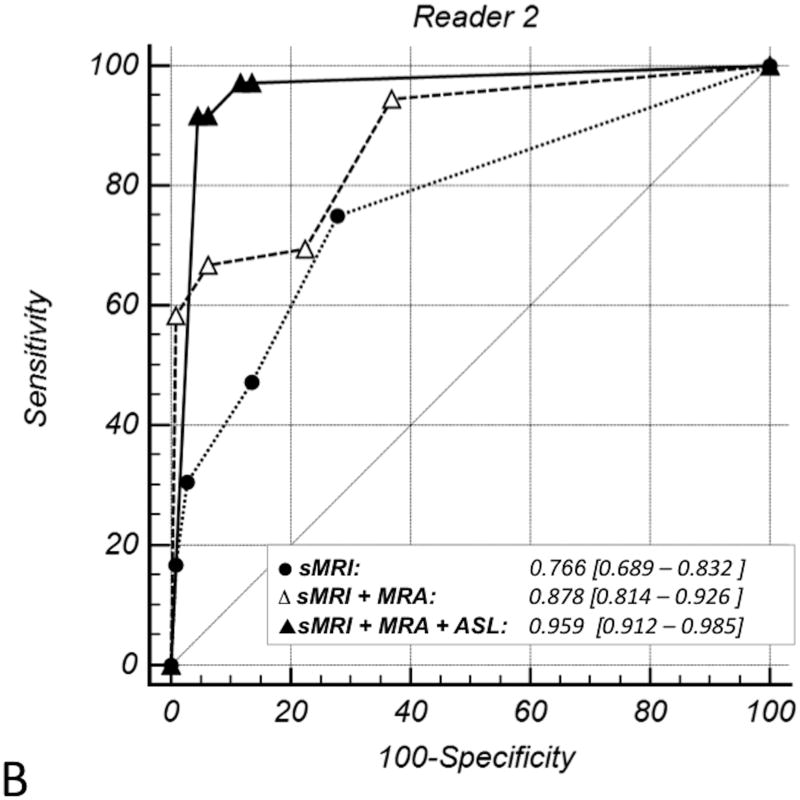
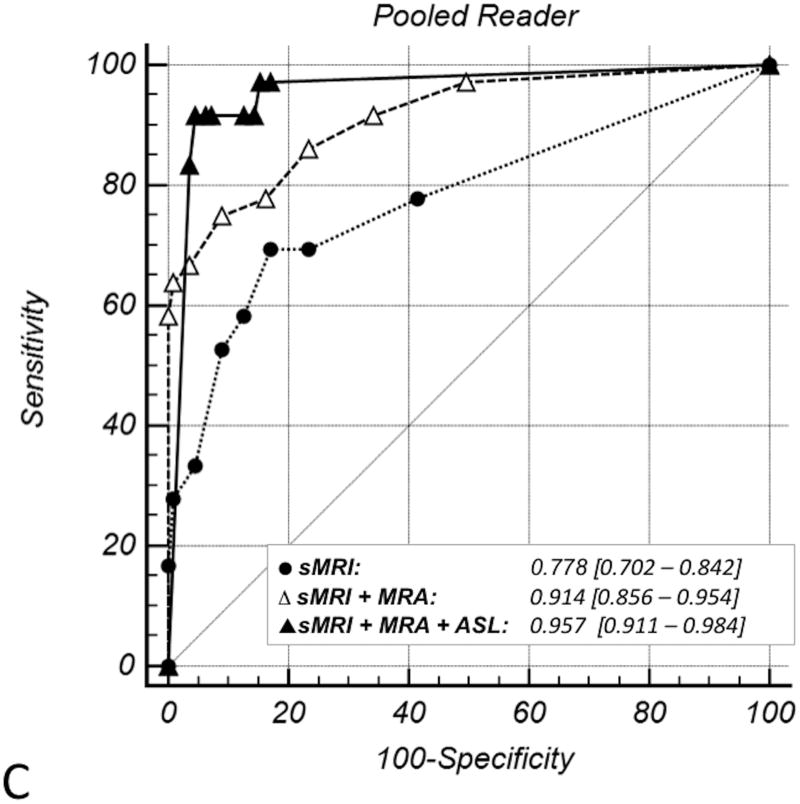
The ROC plots (Figure 3), their corresponding AUCs, and the substantial differences in the AUCs demonstrate improvement in diagnostic performance for detection of dAVFs with the addition of PCASL (Table 2). Diagnostic performance significantly improved with addition of TOF-MRA to sMRI (pooled ΔAUC 0.14; p < 0.01). Addition of PCASL significantly improved diagnostic performance over sMRI (pooled ΔAUC 0.179; p < 0.01). Improvement in diagnostic performance with addition of PCASL to sMRI/TOF-MRA reached statistical significance for reader 2 but not reader 1 (whose excellent diagnostic performance on sMRI and TOF-MRA left little room for improvement). When reader performance was pooled, a trend towards improvement was seen (with only 11% probability that the observed improvement in detection of dAVFs was due to chance).
Figure 3.
ROC curves for each reader's individual diagnostic performance (A and B) and their pooled diagnostic performance (C) with each of: structural MRI (sMRI – dotted line); structural MRI and TOF MRA (sMRI + MRA – dashed line); and structural MRI with TOF MRA and PCASL (sMRI +MRA + PCASL – solid line). The light gray diagonal is the line of no-discrimination. Curve symbols indicate true positive rate/false positive rate pairs computed at different discrimination thresholds. With addition of TOF MRA and then PCASL to structural MRI, the ROC curve becomes more well-rounded with incrementally higher AUC. This indicates increased diagnostic sensitivity for detection of a dAVF at a set specificity.
Table 2. Pairwise comparison of ROC Curves.
| Reader, Diagnostic Instrument | ΔAUC | SE | 95%C.I. | z | p |
|---|---|---|---|---|---|
| Reader 1 | |||||
| sMRI* vs. sMRI + MRA | 0.156 | 0.046 | 0.066 – 0.247 | 3.381 | <0.01 |
| sMRI vs. sMRI + MRA + PCASL | 0.174 | 0.047 | 0.082 – 0.266 | 3.701 | <0.01 |
| sMRI + MRA vs. sMRI+MRA + PCASL | 0.018 | 0.028 | -0.036 – 0.072 | 0.644 | 0.52 |
| Reader 2 | |||||
| sMRI vs. sMRI + MRA | 0.112 | 0.044 | 0.027 – 0.197 | 2.581 | <0.01 |
| sMRI vs. sMRI + MRA + PCASL | 0.193 | 0.043 | 0.108 – 0.277 | 4.475 | <0.01 |
| sMRI + MRA vs. sMRI + MRA + PCASL | 0.081 | 0.030 | 0.022 – 0.140 | 2.675 | <0.01 |
| Pooled Reader 1+2 | |||||
| sMRI vs. sMRI + MRA | 0.136 | 0.042 | 0.053 – 0.219 | 3.208 | <0.01 |
| sMRI vs. sMRI + MRA + PCASL | 0.179 | 0.045 | 0.091 – 0.267 | 3.965 | <0.01 |
| sMRI + MRA vs. sMRI + MRA + PCASL | 0.043 | 0.027 | -0.009 – 0.100 | 1.615 | 0.11 |
Structural MRI
These ROC analysis findings were corroborated by the multivariate binary logistic regression models indicating a significant contribution to diagnostic performance from the addition of TOF-MRA and PCASL features to sMRI (Appendix A). Applying a p=0.5 classification threshold (Table 3), sensitivity was poor for sMRI [33%; 95% C.I. 22%-44%], improved if TOF-MRA was added (sensitivity 76%; 95% C.I. 66% – 86%], and increased further with PCASL (sensitivity 89%; 95% C.I. 81% – 96%) at comparably high specificity (Appendix A). When used in combination, sMRI, MRA, and PCASL yielded a high NPV of 96.4% [96.4%; 95% C.I. 93.9% - 98.9%] which is crucial if MRI is to be used as a screening tool.
Table 3. Classification tables for the multivariate binary logistic regression models †.
| MRI sequences | Sensitivity [95% CI] % | Specificity [95% CI] % | PPV [95% CI] % | NPV [95% CI] % |
|---|---|---|---|---|
| Structural MRI Alone | 32.9 [22.3–43.5] | 97.0 [94.8-99.2] | 78.1 [63.8– 92.5] | 81.7 [77.1–86.2] |
| Structural MRI and TOF MRA | 75.7 [65.7–85.8] | 98.7 [97.1–100.2] | 94.6 [88.8–100.5] | 92.8 [89.5-96.1] |
| Structural MRI, TOF MRA and PCASL | 88.6 [81.1–96.0] | 96.4 [93.9–98.9] | 88.5 [81.1–96.0] | 96.4 [93.9-98.9] |
Classification table generated for a probability value of p=0.5 for each of the three multivariate models.
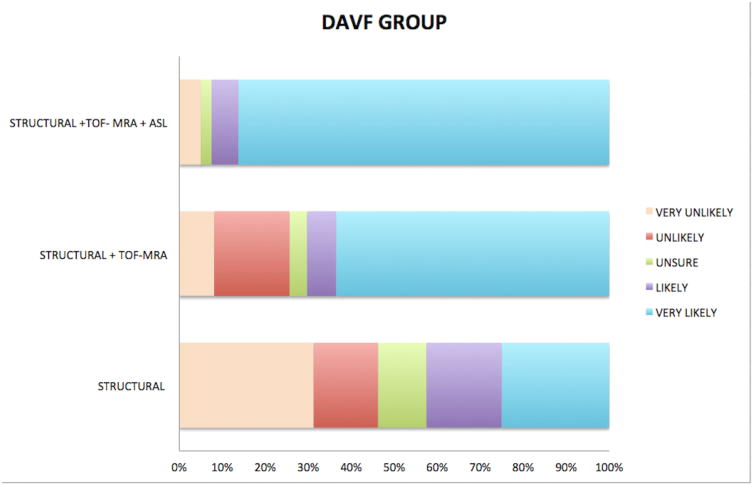
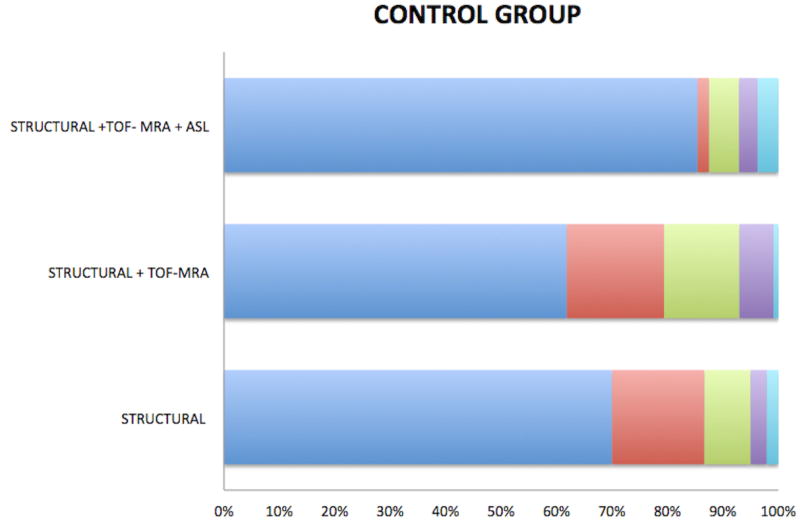
Incremental improvement in reader confidence in the presence or absence of a dAVF with the addition of PCASL is illustrated in Figure 4.
Figure 4.
Distribution of Likert scale scores for patients with (A) and without (B) a dAVF on: structural MRI alone (sMRI), structural MRI with TOF MRA (sMRI/MRA) and structural MRI with both TOF MRA and PCASL (sMRI/MRA/PCASL). A. In the dAVF group, there is marked incremental increase in reader accuracy and confidence in the presence of a dAVF – with a higher percentage considered “very likely” to have a dAVF - with addition of PCASL. B. In the control group, reader accuracy and confidence in the absence of a dAVF decreased with the addition of TOF MRA to sMRI due to a high number of false positives for venous hyperintensity on TOF MRA. Reader certainty as to the absence of a fistula increased (and was highest) following review of PCASL.
Interobserver agreement was good for structural imaging alone (κ 0.62; 95% C.I. -1.0 – 1.0) and improved with the addition of TOF-MRA (κ 0.72; 95% C.I. -1.0 - 1.0). It improved substantially and was almost perfect with the addition of PCASL (κ 0.92; 95% C.I. -0.23 - 1.0).
In four cases, a dAVF was present on DSA but considered unlikely on MRI until PCASL was reviewed. In one case the fistula was located outside the TOF-MRA slab. In the remaining three cases the fistula was not visible on TOF-MRA despite being located within the slab, and other MRA signs were also absent. Two of these cases were partially treated fistulae with low residual flow on DSA.
Discussion
This case-control study confirms that venous ASL signal has a high sensitivity and specificity and an even higher NPV than previously reported11 for detecting the presence of an intracranial dAVF. Identification of venous ASL signal improves diagnostic accuracy and increases confidence in the presence or absence of a dAVF. We have previously shown that MRI with PCASL can be used to accurately determine the grade of a dAVF16. In this study, we investigated the clinical utility of PCASL for detection of dAVFs.
A reliable non-invasive technique for detection of dAVFs can improve patient triage, expedite referral for treatment, and decrease the number of DSAs a patient with a dAVF undergoes by allowing diagnostic and therapeutic angiography to be performed at the same session. Perfect or almost perfect sensitivity and NPV are requisite given that failure to detect a dAVF has a greater potential for adverse consequences than a false positive. Unfortunately, conventional structural MRI is unreliable for the diagnosis of dAVF as seen in this study. TOF-MRA was also less sensitive than previously reported. For example, nodular/curvilinear hyperintensities have been previously reported to be 100% sensitive,5 but these were absent even on post hoc review in 21% of dAVFs. Three were high-grade fistulae with a single feeding artery draining directly into a non-ectatic cortical vein that would not be expected to manifest as nodular/curvilinear hyperintensities.
Venous ASL signal had a higher sensitivity for the presence of a dAVF than structural or TOF-MRA signs. There were only two cases where venous ASL signal was absent. The high conspicuity of venous ASL signal against the relatively flat background of normal ASL signal also makes it easy to detect when present. Nulling of static tissue signal by background suppression and subtraction of control from label images produces a high contrast-to-noise ratio with only labeled blood giving rise to signal on PCASL images15,16. 100% of the voxel is occupied by labeled blood in a draining vein in comparison with 2-5% in a tissue voxel16. There is also greater T1 decay of signal of labeled blood by the time it reaches the tissue in comparison with labeled blood shunted directly into venous structures. Consequently, there is a large contrast differential between the draining veins of a dAVF and adjacent brain parenchyma16. Absence of ASL signal in arteries under normal conditions also enhances the conspicuity of venous ASL signal. Conversely, high signal is seen in normal arteries on both TOF-MRA and contrast-enhanced MRA. A hyperintense cortical vein may therefore be dismissed or misclassified as an artery on these sequences.
PCASL is likely to be particularly beneficial to less experienced readers: the junior reader in this study had a lower sensitivity for detection of dAVFs on sMRI and TOFMRA and demonstrated greater improvement in diagnostic performance following addition of PCASL. The readers' confidence, and agreement regarding the presence or absence of a dAVF, also improved following review of PCASL. Inter-reader agreement for venous ASL signal was higher than for TOF-MRA signs. These findings suggest that venous ASL signal is not only easier to detect, but can also be interpreted with greater certainty. Even when present, findings on structural sequences and TOF-MRA are often subtle and equivocal, requiring careful scrutiny of images and high diagnostic skill to identify and interpret. This has relevance in routine clinical practice, where there is a broad range of reader experience levels and more likelihood that an unsuspected positive case will be mixed in with many negative cases. The high conspicuity of venous ASL signal may also enable detection of unsuspected dAVFs.
Venous ASL signal also had a high specificity for the presence of a dAVF. Theoretically, high signal is absent in venous structures on PCASL under normal conditions due to T1-decay of labeled blood during the time it takes to pass through the tissue capillary bed11,12. The shorter time labeled blood takes to reach veins when shunted directly precludes significant T1-decay. Venous ASL signal is therefore seen in conditions with arteriovenous shunting, including hypervascular tumors, seizures, stroke and AVMs11,12. False positive cases of venous ASL signal in this study were likely due to one of these alternative causes of shunting, such as seizure or an occult AVM obscured by hematoma. Four control patients with mild ASL signal in the anterior aspect of the superior sagittal sinus lacked a plausible alternative cause of shunting. The authors have observed mild ASL signal in this location in other patients without a shunting lesion. Readers should be cognizant of this potential normal variant.
Another advantage of PCASL is whole brain coverage in a reasonable scan time. Despite technological advances such as 3T and parallel imaging, coverage of TOFMRA often does not extend to the vertex due to clinical time constraints. dAVFs located superior to the imaged slabs may therefore be missed.
Venous ASL signal was absent in two low flow dAVFs, likely due to an inadequate volume of shunted blood to produce perceptible signal in draining veins. Two other low flow fistulae were detected on PCASL but missed on TOF-MRA (likely due to signal saturation). There were too few (4) low flow dAVFs in this study to draw meaningful conclusions regarding this population. Long-label long-delay PCASL may allow detection of these low flow fistulae, as more labeled blood would be present in draining veins at a later time-point of imaging15.
Another potential pitfall of PCASL is high signal in arterial structures in conditions with delayed transit of labeled blood such as steno-occlusive disease11,15. Cognizance of this arterial transit artifact15 [Figure 2a] and careful cross-reference with other sequences is necessary to avoid false positives.
Contrast-enhanced MRA has been reported to be accurate for detection of dAVFs5,7,17. The diagnosis requires identification of early venous filling which is likely more challenging than identification of the conspicuous venous ASL sign, given the compromise between spatial and temporal resolution required to perform clinical CE-MRA; even with highly constrained reconstruction techniques, spatial and temporal resolution are much lower than that of DSA18. CE-MRA also requires administration of gadolinium-based contrast, adding to cost. Gadolinium is also associated with a risk of anaphylaxis, nephrogenic systemic fibrosis and deposition. Other advanced techniques for detection and characterization of dAVFs such as 4D ASL-based MRA18 are still research tools that are not available for clinical use.
PCASL is also available on both 1.5T and 3T clinical units and is feasible within the constraints of everyday clinical practice. Given its utility for detection of intracranial shunting, we recommend its routine inclusion in the MRI protocol for patients with intracranial hemorrhage and pulsatile tinnitus. It should also be added to the protocol for those patients with clinical or non-invasive imaging findings raising suspicion for a dAVF.
The major limitation of this study is the small number of low flow dAVFs, which may potentially be occult on pcASL. Its retrospective nature also limited us to review of routine MR sequences performed at our institution. Prospective enrollment would enable inclusion and comparative assessment of CTA, contrast-enhanced MRA and alterative ASL techniques (eg long-label long delay which may be more sensitive for shunting).
In conclusion, venous ASL signal has high sensitivity and specificity for the presence of a dAVF, hence its identification increases confidence in the presence or absence of a dAVF on non-invasive imaging. It is also a highly conspicuous finding that is easy to detect and has the potential to increase diagnostic performance, particularly of less experienced readers. False positives can occur and are likely due to alternative causes of intracranial shunting. False negatives also occur, with some small and low flow fistulae occult on MRI with PCASL such that sensitivity is imperfect when compared to the gold standard of DSA. We therefore do not advocate replacing DSA for the screening of dAVFs at this stage if clinical suspicion of a dAVF is high, but MRI with PCASL can help refine triage and expedite management by increasing confidence in the diagnosis.
Acknowledgments
Grant Support: Drs Amukotuwa and Bammer are supported by the National Institutes of Health (NIBIB): grants 3R01EB002711-06S1 and 5R21EB021029. Dr Calamante is supported by the National Health and Medical Research Council of Australia grant APP1117724.
The authors would like to thank Dr. Jarrett Rosenberg for his feedback on the statistical analyses.
Disclosures: Shalini Amukotuwa—RELATED: Grant: NIBIB, Comments: Grant numbers 5R21EB021029, 3R01EB002711-06S1 (Drs. Bammer and Amukotuwa supported by these grants)*. Fernando Calamante—RELATED: Grant: National Health and Medical Research Council of Australia; UNRELATED: Grant: Australian Research Council; Payment for lectures including service on speakers bureaus: Siemens*. Greg Zaharchuk—UNRELATED: Grants/grants pending: GE Healthcare, NIH. Roland Bammer—RELATED: Grant: National Institutes of Health (NIBIB)*; Support for travel to meetings for the study or other purposes: National Institutes of Health (NIBIB)*.
*money paid to institution
Abbreviations
- dAVF
dural arteriovenous fistula
- ASL
arterial spin labeling
- pcASL
pseudocontinuous ASL
- PLD
post label delay
- NCH
Nodular and/or curvilinear hyperintensities
- NPV
negative predictive value
- PPV
positive predictive value
- ROC
receiver operating characteristic
- AUC
area under the ROC curve
- sMRI
structural MRI
Appendix
Results of Multivariate Binary Logistic Regression.
| Assessment of presence of DAVF | OR | SE | Wald | p† | 95% C.I. of OR‡ | |
|---|---|---|---|---|---|---|
| Structural MRI | ||||||
| ICH | 0.153 | 0.367 | 26.108 | <0.001 | 0.0747 – 0.3149 | |
| Structural MRI Alone | Vasogenic oedema or gliosis | 0.625 | 0.402 | 1.365 | 0.243 | 0.2841 – 1.3749 |
| Abnormal vessels | 8.091 | 0.362 | 33.443 | <0.001 | 3.9835 – 16.4343 | |
| Enlarged sinus | 1.085 | 0.389 | 0.0442 | 0.833 | 0.5065 – 2.3250 | |
|
| ||||||
| Structural MRI | ||||||
| ICH | 0.168 | 0.570 | 9.802 | 0.002 | 0.0550 – 0.5132 | |
| Vasogenic oedema or gliosis | 0.562 | 0.651 | 0.782 | 0.376 | 0.1571 – 2.0137 | |
| Abnormal vessels | 7.537 | 0.555 | 13.222 | <0.001 | 2.5373 – 22.3870 | |
| Enlarged sinus | 0.057 | 0.925 | 9.648 | 0.002 | 0.0092 – 0.3463 | |
| Structural MRI Alone plus | Time-of-Flight MRA | |||||
| TOF MRA | Fistula | 152.821 | 1.151 | 19.080 | <0.001 | 15.9993 –1459.697 |
| Abnormal vessels | 0.747 | 0.557 | 0.275 | 0.600 | 0.2507 – 2.2253 | |
| Venous signal | 11.123 | 0.556 | 18.749 | <0.001 | 3.7380 – 33.0985 | |
| Enlarged extra-cranial vessels | 4.919 | 0.630 | 6.386 | 0.012 | 1.4297 – 16.9207 | |
|
| ||||||
| Structural MRI | ||||||
| ICH | 0.388 | 0.694 | 1.861 | 0.173 | 0.0995 – 1.5120 | |
| Vasogenic oedema or gliosis | 0.357 | 0.781 | 1.738 | 0.187 | 0.0772 – 1.6510 | |
| Abnormal vessels | 2.635 | 0.670 | 2.095 | 0.148 | 0.7095 – 9.7874 | |
| Enlarged sinus | 0.083 | 1.133 | 4.842 | 0.028 | 0.0090 – 0.7615 | |
| Structural MRI Alone plus | Time-of-Flight MRA | |||||
| TOF MRA plus ASL | NCH* | 58.757 | 1.324 | 9.462 | 0.002 | 4.3837 – 787.5378 |
| Abnormal vessels | 0.768 | 0.654 | 0.163 | 0.687 | 0.2132 – 2.7670 | |
| Venous signal | 8.872 | 0.641 | 11.589 | <0.001 | 2.5247 – 31.1798 | |
| Enlarged extra-cranial vessels | 4.400 | 0.755 | 3.855 | 0.050 | 1.0025 – 19.2997 | |
| ASL | ||||||
| Venous ASL signal | 28.888 | 0.676 | 24.748 | <0.001 | 7.6773 – 108.7008 | |
The Wald test statistics tests the Null Hypothesis that in the test population there is no difference in the logarithm of the odds for detecting a DAVF on DSA for the dependent variable (i.e. state variable) to be true vs. false, i.e. OR=1. If the Wald test is below the standard significance level (p<0.001) one can reject the Null hypothesis.
There is a 95% chance that the point estimate of the OR lies within this interval and a 5% that the true value is either below or above this interval.
Nodular and curvilinear hyperintensities
Classification Tables for the Multivariate Binary Logistic Regression Models and Corresponding Diagnostic Performance Indicators.
| DSA=0 | DSA =0 | DSA=1 | DSA =1 | Sensitivity | Specificity | PPV | NPV | |
|---|---|---|---|---|---|---|---|---|
| Assessment of presence of DAVF | Predicted = 0 (TN) † | Predicted = 1 (FP) † | Predicted = 0 (FN) † | Predicted = 1 (TP) † | [95% C.I. in %]‡ | [95% C.I. in %]‡ | [95% C.I. in %]‡ | [95% C.I. in %]‡ |
| Structural MRI Alone | 227 | 7 | 51 | 25 | 32.89% [22.33 – 43.46] | 97.01% [94.83 – 99.19] | 78.13% [63.80 – 92.45] | 81.65% [77.10 – 86.20] |
| Structural MRI plus TOF MRA | 219 | 3 | 17 | 53 | 75.71% [65.67 – 85.76] | 98.65% [97.13 – 100.17] | 94.64% [88.75 – 100.54] | 92.80% [89.50 – 96.10] |
| Structural MRI plus TOF MRA plus ASL | 214 | 8 | 8 | 62 | 88.57% [81.12 – 96.02] | 96.40% [93.94 – 98.85] | 88.57% [81.12 – 96.02] | 96.40% [93.94 – 98.85] |
Classification table was generated for a probability value of p=0.5 for each of the three multivariate models.
There is a 95% chance that the point estimate (z) of the sensitivity, specificity, PPV or NPV lies within this interval and a 5% that the true value is either below or above this interval. The 95% C.I. were computed based on z ± 1.96 × Standard Error.
Pairwise Likelihood Ratio Tests for the Multivariate Models.
| Reader, Diagnostic Instrument | -444 | χ2 | 4 | Δdf |
|---|---|---|---|---|
| sMRI | 260.18 | |||
| sMRI + MRA | 117.09 | |||
| sMRI + MRA + ASL | 84.23 | |||
| sMRI vs sMRI + MRA | 143.09 | <0.001* | 4 | |
| sMRI + MRA vs sMRI + MRA + ASL | 32.86 | <0.001* | 1 | |
| sMRI vs sMRI + MRA + ASL | 175.95 | <0.001* | 8 |
Indicates significance (p<0.001), i.e. that the null hypothesis (difference in -2LLs equals “0”) is rejected and that the -2LLs are different.
Contributor Information
Shalini A Amukotuwa, Email: shalinia@student.unimelb.edu.au, Stanford University, Stanford, California, United States 94305 and Florey Department of Neuroscience and Mental Health, University of Melbourne, Melbourne, VIC, Australia 3052 t: (+613) 4215 0000; f: (+613) 9035 7307.
Gregory Zaharchuk, Email: gregz@stanford.edu, Stanford University, Stanford, California, United States 94305 t: (650) 725-6765; f: (650) 498-5374.
Michael P Marks, Email: mmarks@stanford.edu, Stanford University, Stanford, California, United States 94305 t: (650) 723-6767; f: (650) 498-5374.
Fernando Calamante, Email: fernando.calamante@florey.edu.au, Florey Department of Neuroscience and Mental Health, University of Melbourne, Melbourne, VIC, Australia 3052. t: (+613) 9035 7041; f: (+613) 9035 7307.
Roland Bammer, Email: rbammer@stanford.edu, Stanford University, Stanford, California, United States 94305 (650) 725-6765; f: (650) 498-5374.
Nancy Fischbein, Email: fischbein@stanford.edu, Stanford University, Stanford, California, United States 94305 t: (650) 725-6765; f: (650) 498-5374.
References
- 1.Newton T, Cronqvist S. Involvement of the dural arteries in intra-cranial arteriovenous malformations. Radiology. 1969;90:27–35. doi: 10.1148/93.5.1071. [DOI] [PubMed] [Google Scholar]
- 2.Cognard C, Casasco A, Toevi M, et al. Dural arteriovenous fistulas as a cause of intracranial hypertension due to impairment of cranial venous outflow. J Neurol Neurosurg Psychiatry. 1998;65(3):308–16. doi: 10.1136/jnnp.65.3.308. [DOI] [PMC free article] [PubMed] [Google Scholar]
- 3.Cloft HJ, Joseph GJ, Dion JE. Risk of cerebral angiography in patients with subarachnoid hemorrhage, cerebral aneurysm, and arteriovenous malformation: a meta-analysis. Stroke. 1999;30:317–20. doi: 10.1161/01.str.30.2.317. [DOI] [PubMed] [Google Scholar]
- 4.Miller TR, Gandhi D. Intrancranial dural arteriovenous fistulae: clinical presentation and management strategies. Stroke. 2015;46:2017–2025. doi: 10.1161/STROKEAHA.115.008228. [DOI] [PubMed] [Google Scholar]
- 5.Noguchi K, Melhem ER, Kanazawa T, Kubo M, Kuwayama N, Seto H. Intracranial dural arteriovenous fistulas: evaluation with combined 3D time-of-flight MR angiography and MR digital subtraction angiography. AJR. 2004;182(1):183–90. doi: 10.2214/ajr.182.1.1820183. [DOI] [PubMed] [Google Scholar]
- 6.Kwon BJ, Han MH, Kang HS, et al. MR imaging findings of intracranial dural arteriovenous fistulas: relations with venous drainage patterns. AJNR Am J Neuroradiol. 2005;26:2500–07. [PMC free article] [PubMed] [Google Scholar]
- 7.Meckel S, Maier M, Ruiz DS, et al. MR angiography of dural arteriovenous fistulas: diagnosis and follow-up after treatment using a time-resolved 3D contrast-enhanced technique. AJNR Am J Neuroradiol. 2007;28:877–84. [PMC free article] [PubMed] [Google Scholar]
- 8.Farb RI, Agid R, Willinsky RA, et al. Cranial dural arteriovenous fistula: diagnosis and classification with time-resolved MR angiography at 3T. AJNR Am J Neuroradiol. 2009;30:1546–51. doi: 10.3174/ajnr.A1646. [DOI] [PMC free article] [PubMed] [Google Scholar]
- 9.Nishimura S, Hirai T, Sasao A, et al. Evaluation of dural arteriovenous fistulas with 4D contrast-enhanced MR angiography at 3T. AJNR AmJ Neuroradiol. 2010;31:80–85. doi: 10.3174/ajnr.A1898. [DOI] [PMC free article] [PubMed] [Google Scholar]
- 10.Brouwer PA, Bosman T, van Walderveen MA, Krings T, Leroux AA, Willems PW. Dynamic 320-section CT angiography in cranial arteriovenous shunting lesions. AJNR Am J Neuroradiol. 2010;31(4):767–70. doi: 10.3174/ajnr.A1747. [DOI] [PMC free article] [PubMed] [Google Scholar]
- 11.Le TT, Fischbein NJ, André JB, Wijman C, Rosenberg J, Zaharchuk G. Identification of venous signal on arterial spin labeling improves diagnosis of dural arteriovenous fistulas and small arteriovenous malformations. AJNR Am J Neuroradiol. 2012;33(1):61–8. doi: 10.3174/ajnr.A2761. [DOI] [PMC free article] [PubMed] [Google Scholar]
- 12.Wolf RL, Wang J, Detre JA, Zager EL, Hurst RW. Arteriovenous shunt visualization in arteriovenous malformations with arterial spin-labeling MR imaging. AJNR Am J Neuroradiol. 2008;29(4):681–7. doi: 10.3174/ajnr.A0901. [DOI] [PMC free article] [PubMed] [Google Scholar]
- 13.Cognard C, Gobin YP, Pierot L, et al. Cerebral dural arteriovenous fistulas: clinical and angiographic correlation with a revised classification of venous drainage. Radiology. 1995;194(3):671–80. doi: 10.1148/radiology.194.3.7862961. [DOI] [PubMed] [Google Scholar]
- 14.Alsop DC, Detre JA, Golay X, Günther M, et al. Recommended implementation of arterial spin-labeled perfusion MRI for clinical applications: A consensus of the ISMRM perfusion study group and the European consortium for ASL in dementia. Magn Reson Med. 2014;73(1):103–116. doi: 10.1002/mrm.25197. [DOI] [PMC free article] [PubMed] [Google Scholar]
- 15.Amukotuwa SA, Yu C, Zaharchuk G. 3D Pseudocontinuous arterial spin labeling in routine clinical practice: A review of clinically significant artifacts. J Magn Reson Imaging. 2016;43(1):11–27. doi: 10.1002/jmri.24873. [DOI] [PubMed] [Google Scholar]
- 16.Amukotuwa SA, Heit JJ, Marks MP, Fischbein N, Bammer R. Detection of Cortical Venous Drainage and Determination of the Borden Type of Dural Arteriovenous Fistula by Means of 3D Pseudocontinuous Arterial Spin-Labeling MRI. AJR Am J Roentgenol. 2016;207(1):163–9. doi: 10.2214/AJR.15.15171. [DOI] [PubMed] [Google Scholar]
- 17.Clark Z, Johnson KM, Wu Y, Edjlali M, Mistretta C, Wieben O, Turski P. Accelerated Time-Resolved Contrast-Enhanced Magnetic Resonance Angiography of Dural Arteriovenous Fistulas Using Highly Constrained Reconstruction of Sparse Cerebrovascular Data Sets. Invest Radiol. 2016;51(6):365–71. doi: 10.1097/RLI.0000000000000212. [DOI] [PMC free article] [PubMed] [Google Scholar]
- 18.Iryo Y, Hirai T, Kai Y, Nakamura M, et al. Intracranial dural arteriovenous fistulas: evaluation with 3-T four-dimensional MR angiography using arterial spin labeling. Radiology. 2014;271(1):193–9. doi: 10.1148/radiol.13122670. [DOI] [PubMed] [Google Scholar]


