

Abstract
Severe acute dysphagia commonly results from head and neck radiotherapy (RT). A model enabling prediction of severity of acute dysphagia for individual patients could guide clinical decision-making. Statistical associations between RT dose distributions and dysphagia could inform RT planning protocols aiming to reduce the incidence of severe dysphagia. We aimed to establish such a model and associations incorporating spatial dose metrics. Models of severe acute dysphagia were developed using pharyngeal mucosa (PM) RT dose (dose-volume and spatial dose metrics) and clinical data. Penalized logistic regression (PLR), support vector classification and random forest classification (RFC) models were generated and internally (173 patients) and externally (90 patients) validated. These were compared using area under the receiver operating characteristic curve (AUC) to assess performance. Associations between treatment features and dysphagia were explored using RFC models. The PLR model using dose-volume metrics (PLRstandard) performed as well as the more complex models and had very good discrimination (AUC = 0.82) on external validation. The features with the highest RFC importance values were the volume, length and circumference of PM receiving 1 Gy/fraction and higher. The volumes of PM receiving 1 Gy/fraction or higher should be minimized to reduce the incidence of severe acute dysphagia.
Introduction
Acute dysphagia is a common toxicity resulting from head and neck (chemo)radiotherapy (RT), having a substantial impact on patients' quality of life [1] and personal relationships [2]. Around half of patients experience significant acute swallowing dysfunction [3]. Moreover, severe acute reactions have been implicated in the development of “late” radiation toxicities [4,5], including late dysphagia [6]. Clinicians are unable to accurately predict which patients will experience severe acute dysphagia [7]. A normal tissue complication probability (NTCP) model with good predictive ability would, therefore, represent a highly useful tool for clinical decision-support, treatment plan comparison, treatment modality selection [8] and isotoxic dose escalation (as is being evaluated in lung RT [9]). Recently, NTCP models of dysphagia six months following RT [10,11] were successfully validated [12–14]. However, as many patients suffer severe acute dysphagia that resolves by six months following RT, these models do not capture the substantial early tox-icity burden. The currently existing NTCP models for severe acute dysphagia, whilst promising and providing useful insights, [15–21] possess suboptimal discriminative ability and, hence, are not routinely used to guide clinical decision-making.
In addition to the prediction of individual patient toxicity outcomes, there is substantial interest in determining statistical associations between RT dose metrics and toxicity to inform the optimal design of RT treatment planning techniques attempting to reduce the incidence of toxicity. A large number of studies, summarized in [22,23], with conflicting findings, have sought to establish substructures within the head and neck region that are radiosensitive for late dysphagia. However, the apparent differential radiosensitivity of substructures within the pharyngeal musculature is likely to be an artefact of the positions of the primary disease sites relative to those substructures in these study cohorts [24]. To overcome this bias, we combined multiple spatial dose metrics, which are sensitive to both the extent of the dose distribution and regional variations in radiosensitivity, to “tease apart” these effects. Additionally, we hypothesized that the addition of spatial dose metrics would increase the discriminative performance of NTCP models, compared with dose-volume metrics, as has previously been demonstrated for xerostomia [25] and rectal toxicities [26].
The first aim of this study was to determine whether the addition of novel spatial dose metrics would improve the predictive performance of NTCP models for severe acute dysphagia. The second aim was to establish statistical associations between the RT dose distribution and severe acute dysphagia that could be used to inform RT planning techniques aiming to reduce the incidence of severe dysphagia. This study built upon previous acute dysphagia models [27,28] by introducing novel spatial dose metrics and using machine learning approaches.
Material and methods
Patient data
Severe acute dysphagia models were generated and internally validated using a training dataset of 335 patients with DICOM RT data available, enrolled in one of six different clinical trials [29– 33], with institutional review board approval and signed patient consent (Table 1). Patients for whom clinical data (age, sex, primary disease site, use of chemotherapy) were unavailable (13 patients) were excluded from the analyses. The cohort includes a diverse range of primary disease sites and RT delivery techniques, ensuring a large variation in the dose distributions across the cohort. This increases the generalizability of the models and reduces the chance of introducing biases, for example, due to the primary tumour location. An independent external validation data-set was provided by Washington University School of Medicine in Saint Louis (Table 1). This consisted of 90 patients with a range of head and neck primary tumour sites.
Table 1.
Patient cohorts making up the dataset.
| Trial | Patients available | Primary disease site | Radiotherapy technique | Radiotherapy dose-fractionation* | Concurrent chemotherapy |
|---|---|---|---|---|---|
| COSTAR (Phase III, multicentre; NCT01216800) | 72 | Parotid gland | Unilateral; 3D conformal RT, IMRT | 65 Gy/30 # (definitive RT), 60 Gy/30 # (post-operative RT) | No |
| PARSPORT (Phase III, multicentre) [25] | 67 | Oropharynx, hypopharynx | Bilateral; 3D conformal RT, IMRT | 65 Gy/30 # (definitive RT), 60 Gy/30 # (post-operative RT) | No |
| Dose Escalation (Phase II, single centre) [26] | 26 | Larynx, hypopharynx | Bilateral; IMRT | 67.2 Gy/28 #, 63 Gy/28 # | Yes |
| Midline (Phase II, single centre) [27] | 116 | Oropharynx | Bilateral; IMRT | 65 Gy/30 # (definitive RT), 60 Gy/30 # (post-operative RT) | Yes |
| Nasopharynx (Phase II, single centre) [28] | 36 | Nasopharynx | Bilateral; IMRT | 65 Gy/30 # (definitive RT), 60 Gy/30 # (post-operative RT) | Yes |
| Unknown Primary (Phase II, single centre) [29] | 18 | Unknown primary | Bilateral; IMRT | 65 Gy/30 # (definitive RT), 60 Gy/30 # (post-operative RT) | Yes |
| Washington University School of Medicine in Saint Louis (Independent external validation) | 90 | Oral cavity, nasal cavity, nasopharynx, oropharynx, hypopharynx, larynx, parotid gland, unknown primary | Bilateral, unilateral; IMRT | 70 Gy/35 #, 66 Gy/33 #, 60 Gy/30 # | Both concurrent and no concurrent chemotherapy |
The first six trials were used for model training and internal validation. The last trial was used for independent external validation. IMRT - intensity-modulated radiotherapy; # – fractions; RT – radiotherapy; Unilateral – treatment delivered to ipsilateral parotid bed only; Bilateral – treatment delivered to ipsilateral and contralateral mucosa of relevant subsite (e.g. nasopharynx, oropharynx or larynx).
All fractionation regimens used 5 fractions per week with 1 fraction per day from Monday to Friday. Where multiple fractionation schedules are listed for a single trial this means that multiple fractionation schedules were employed in those trials.
Toxicity data for the patients included in the training dataset were recorded prospectively, by experienced head and neck cancer specialists working according to standard trial protocols, prior to the start of RT, weekly during RT, weekly from 1–4 weeks following RT and at 8 weeks following RT using the Common Terminology Criteria for Adverse Events (CTCAE) version 3 [34] dysphagia instrument. The toxicity endpoint of interest chosen for analysis was the peak grade of dysphagia, dichotomized into severe (grade 3 or worse) and non-severe (less than grade 3) dysphagia. Patients with grade 1 or higher baseline toxicity (14 patients) or missing baseline toxicity (9 patients) were excluded from the analysis. Patients with missing toxicity measurements and peak grade less than 3 were excluded from the analysis as these patients may have experienced unreported grade 3 or worse dysphagia (126 patients). The rationale for this strategy for handling missing toxicity data is described in Appendix A. For the external validation cohort, severe acute dysphagia was defined as the patient requiring percutaneous endoscopic gastrostomy tube (PEG) insertion. It should be noted that there was a slight difference in the scoring systems due to the data available. All institutions treating patients used in this study, including the training and external validation cohorts, employed a reactive and conservative approach to PEG insertion. After removing patients with missing data, 173 patients were available for training and 90 patients available for external validation. The incidences of severe acute dysphagia were 66% in the training dataset and 48% in the external validation dataset. The training dataset incidence is artificially inflated by the strategy for handling missing toxicity data.
Induction chemotherapy, concurrent chemotherapy regimen (cisplatin, carboplatin, one cycle of cisplatin then one cycle of carboplatin or none), definitive versus post-operative RT, primary disease site (nasopharynx/nasal cavity, oropharynx/oral cavity, hypopharynx/larynx, parotid gland and unknown primary), sex and age were also included as covariates in the models. These clinical covariate data are given in Appendix B.
Calculations
Radiotherapy dose metrics
The pharyngeal mucosa (PM) was considered as the organ-at-risk for acute dysphagia. The PM was delineated, by clinical oncologists, from the roof of the nasopharynx to the level of the suprasternal notch (Appendix C). The physical dose distribution was converted to the fractional dose distribution (physical dose delivered in each fraction), which was described by the dose-volume histogram (DVH) in 20 cGy intervals from 20 (V20) to 260 (V260) cGy per fraction. The use of the fractional DVH is appropriate as nearly all patients who developed severe acute dysphagia developed it before the full course of RT had been delivered (data not shown) and follows recommendations for acute toxicity modelling by Tucker et al. [35]. Using the biologically effective dose in place of the fractional dose made very little difference to the results due to the fractionation regimens employed (data not shown). The dose distribution was also described spatially, using novel dose-length (DLH; L20 – L260) and dose-circumference histograms (DCH; C20 – C260) and 3D moment invariants describing the centre of mass (η001, η010, η100, η011, η101, η110, η111), spread (η002, η020, η200) and skewness (η003, η030, η003) of the dose distribution in the left-right, anterior-posterior and superior-inferior directions [25,36], detailed in Appendix D.
Statistical modelling
Statistical analysis was performed using a machine learning pipeline specifically designed for NTCP modelling [36]. Three types of model were compared, penalised logistic regression (PLR), support vector classification (SVC) and random forest classification (RFC). For each, a version with dose-volume mretrics (“standard”) and with the spatial dose metrics (“spatial”) was trained and validated. This is described in Appendix E.
Results
The DVH, DLH and DCH data are summarized in Fig. 1.
Fig. 1.
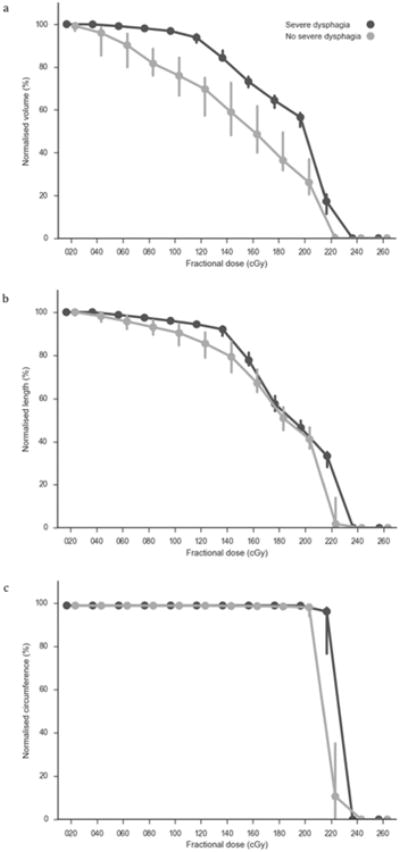
Summary of the pharyngeal mucosa (a) DVH, (b) DLH and (c) DCH data grouped by severe or non-severe peak dysphagia. The lines represent the group medians and the error bars represent the 95 percentile confidence intervals.
A correlation matrix of the data is shown in Appendix F. Regarding the first aim, the predictive performances of the models are shown in Table 2.
Table 2.
Predictive performance of models.
| Model | Hyper-parameters | Internal validation mean (standard deviation)/External validation (standard deviation) | ||||
|---|---|---|---|---|---|---|
|
| ||||||
| AUC | Log loss | Brier score | Calibration slope | Calibration intercept | ||
| PLRstandard | penalty = l2, C = 0.001 | 0.76 (0.08)/0.82 (0.04) | 0.62 (0.04)/0.61 (0.02) | 0.21 (0.02)/0.21 (0.01) | 14.9 (13.5)/17.6 (3.9) | −6.8 (6.8)/ −8.3 (1.9) |
| SVCstandard | kernel = radial basis function, C = 0.0001, gamma = 0.001 | 0.75 (0.08)/0.82 (0.04) | – | – | – | – |
| RFCstandard | max depth = 5, max features = square root | 0.71 (0.08)/0.78 (0.05) | 0.61 (0.09)/0.57 (0.04) | 0.20 (0.03)/0.19 (0.02) | 3.5 (1.6)/5.7 (1.3) | −1.5 (1.0)/ −3.0 (0.8) |
| PLRspatial | penalty = l2, C = 10.0 | 0.75 (0.08)/0.73 (0.05) | 0.64 (0.04)/0.62 (0.02) | 0.22 (0.02)/0.22 (0.01) | 13.7 (11.1)/11.2 (3.6) | −6.2 (5.6)/ −4.9 (1.6) |
| SVCspatial | kernel = radial basis function, C = 0.0001, gamma = 0.001 | 0.74 (0.08)/0.73 (0.05) | – | – | – | – |
| RFCspatial | max depth = 5, max features = square root | 0.74 (0.07)/0.75 (0.05) | 0.58 (0.07)/0.61 (0.02) | 0.19 (0.03)/0.21 (0.01) | 4.5 (2.4)/8.6 (2.3) | −2.2 (1.6)/ −4.1 (1.1) |
PLR – penalized logistic regression; SVC – support vector classification; RFC – random forest classification; l2 – ridge regularisation; C – inverse of regularisation strength; gamma – kernel coefficient for radial basis function.
The discrimination of the PLRstandard model was not outperformed by any of the more complex models, on internal (AUC = 0.76, s.d. = 0.08) or external validation (AUC = 0.82, s.d. = 0.04). The log loss and Brier score were similar between all PLR and RFC models on internal and external validation. SVC models do not provide probability estimates; hence, only discrimination could be assessed. Platt scaling was employed to convert the SVC model outputs to probability estimates [37]. However, this led to substantial reductions in AUC related to the algorithm used (data not shown) so the non-scaled SVC models were preferred. The RFC models had better calibration (calibration slope closer to 1 and intercept closer to 0) than the PLR models on internal and external validation. The discriminative ability of PLRstandard model was good on internal validation and very good on external validation. The calibration curve, of the predicted probabilities of severe dysphagia against the actual toxicity outcomes, for this model applied to the external validation data is displayed in Fig. 2a.
Fig. 2.
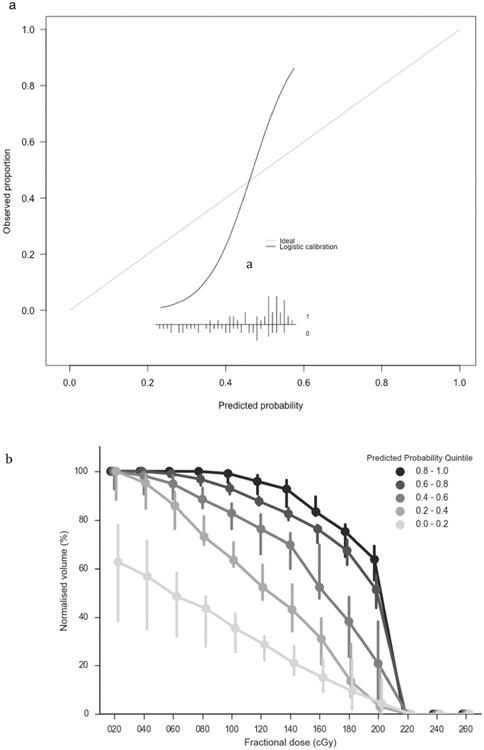
(a) Calibration of the probabilities of severe dysphagia, as predicted by of the PLRstandard model (x-axis), against the observed fraction of severe dysphagia in the external validation dataset (y-axis). The curve shows a logistic regression model of the predicted probabilities (independent variable) against the observed fraction of patients with severe dysphagia (dependent variable). The inset figure shows the histogram of the predicted probabilities and the observed toxicity outcomes (1 = severe dysphagia; 0 = no severe acute dysphagia). (b) Median dose-volume histograms (error bars show 95% confidence intervals) for external validation patients grouped by probability estimate quintiles using the recalibrated PLRstandard model.
The model calibration assessed on the external validation data-set was modest. However, the limitations of model calibration assessment, particularly on a small dataset, should be considered [38]. Fig. 2b indicates how the predicted probability of severe dysphagia in the external validation is related to the DVH. The regression coefficients, and covariate means and standard deviations required to standardize the covariates, necessary to use the model are provided in Table 3.
Table 3.
Regression coefficients and covariate transformation values for the PLRstandard model required to use the model for clinical decision-support.
| Covariate | Regression coefficient | Mean | Standard deviation |
|---|---|---|---|
| intercept | 0.002 | – | – |
| definitiveRT | −0.003 | 0.86 | 0.35 |
| male | 0.015 | 0.66 | 0.47 |
| age | −0.007 | 57.9 | 12.0 |
| indChemo | 0.023 | 0.54 | 0.50 |
| noConChemo | −0.029 | 0.47 | 0.50 |
| cisplatin | 0.024 | 0.38 | 0.49 |
| carboplatin | 0.009 | 0.08 | 0.27 |
| cisCarbo | 0.002 | 0.006 | 0.24 |
| hypopharynx/larynx | 0.014 | 0.14 | 0.35 |
| oropharynx/oral cavity | 0.015 | 0.50 | 0.50 |
| nasopharynx/nasal cavity | −0.003 | 0.10 | 0.31 |
| unknown primary | 0.001 | 0.06 | 0.23 |
| parotid | −0.029 | 0.20 | 0.40 |
| V020 | 0.019 | 95.5 | 9.4 |
| V040 | 0.020 | 93.5 | 10.8 |
| V060 | 0.021 | 92.2 | 11.9 |
| V080 | 0.024 | 90.3 | 13.7 |
| V100 | 0.026 | 87.7 | 16.3 |
| V120 | 0.028 | 83.8 | 19.3 |
| V140 | 0.027 | 77.5 | 20.2 |
| V160 | 0.024 | 66.4 | 18.7 |
| V180 | 0.024 | 57.0 | 17.2 |
| V200 | 0.023 | 47.0 | 20.8 |
| V220 | 0.025 | 20.0 | 16.2 |
| V240 | 0.013 | 2.3 | 8.4 |
| V260 | 0.011 | 0.0 | 0.0 |
definitiveRT – definitive radiotherapy (versus post-operative radiotherapy); indChemo – induction chemotherapy; noConChemo – no concurrent chemotherapy; cisCarbo – one cycle of cisplatin followed by one cycle of carboplatin; Vx – volume of organ receiving × cGy of radiation per fraction.
The model is given by: NTCP = ef/(1 + ef) where where α is the intercept, βi is the regression coefficient for covariate i and χi is the, centred and scaled, value of covariate i. To use the recalibrated version of the model f is instead given by where cintercept and cslope are the external validation intercept and slope (Table 2).
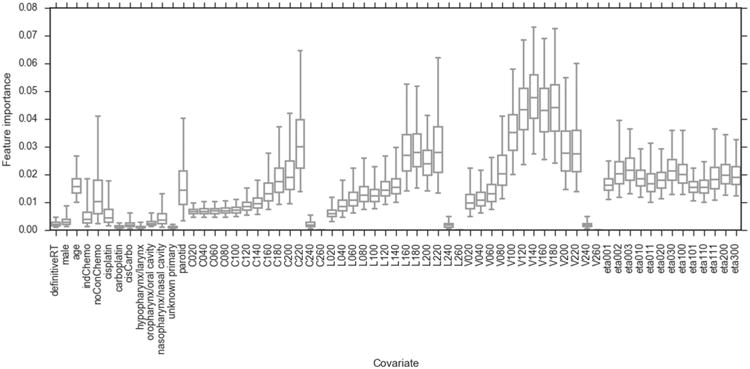
Concerning the second aim, the feature importance values for the RFC models are displayed in Fig. 3.
Fig. 3.
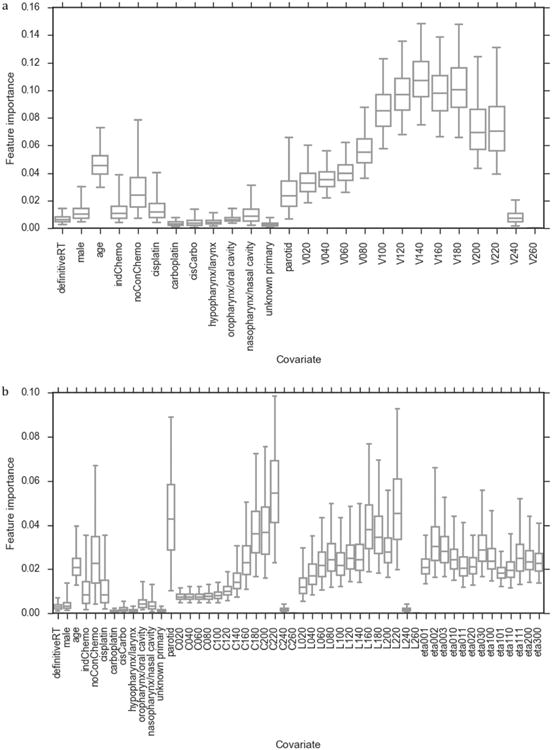
Bootstrapped feature importance values for the covariates included in the (a) RFCstandard and (b) RFCspatial models. The whiskers indicate the 95 percentile confidence intervals (data non-normally distributed). Note that the y-axis scales are different in (a) and (b).
These indicate increasing importance of the DVH, DLH and DCH metrics, in terms of predicting severe dysphagia in the models, with increasing dose level up to a fractional dose of 180 cGy, for RFCstandard, or 220 cGy, for RFCspatial. There is a decrease in importance at higher doses in this, data-driven, analysis. In the RFCstandard and RFCspatial models, the V140 and C220 were the covariates most strongly associated with severe dysphagia, respectively. The 3D moment invariant with the highest feature importance was η002, describing the spread of the dose in the superior-inferior direction. For completeness, the RFC feature importance values were calculated for a model including both dose-volume and spatial dose metrics (Appendix G).
In both RFC models, the clinical covariates with the highest feature importance were parotid gland primary disease site, no concurrent chemotherapy and age. Parotid gland primary disease site correlated strongly with the dose metrics (Appendix F) as patients with parotid gland primaries received unilateral irradiation and, hence, a smaller volume of PM irradiated. No concurrent chemotherapy was correlated with parotid gland primary disease site and the dose metrics (Appendix F) as the parotid gland cancer patients, treated in the COSTAR trial, did not receive concurrent chemotherapy. These correlations should be considered when interpreting the results. When interpreting the apparent importance of age it is important to consider that it may have been artificially inflated due to the larger number of possible values than the other clinical covariates [39]. The RFC model feature importance results agreed with the PLRstandard model regression coefficients (Table 3).
Discussion
We met our first aim of determining whether the addition of novel spatial dose metrics could improve the predictive performance of NTCP models of severe acute dysphagia. We suggest that the PLRstandard model should be preferred over the other models, for prediction, on the grounds of at least as good discrimination as the other models, similar log loss and Brier score and greater simplicity. The good discriminative ability of this model, on internal and external validation, makes it a suitable aid for supporting clinical decision-making. The “spatial” models trained in this study did not have better discriminative ability than the “standard” models so we do not recommend their use. This may have been due to the DLH and DCH metrics being highly correlated with the DVH metrics (Appendix F). Hence, the spatial variations in the dose distributions across the cohort were captured by the DVHs. It is important to note that we cannot rule out the possibility that using different spatial dose metrics, combinations of features, models or datasets would improve model performance compared with dose-volume based acute dysphagia models. Potential uses of the model are discussed in Appendix H.
We also achieved our second aim of establishing associations between the RT dose distribution and acute dysphagia. The decrease in feature importance for the highest dose levels was due to a lack of variation in these metrics between patients, as they are either 0 or close to 0 for all patients, rather than indicating reduced biological effects at these dose levels. Our results do not support the existence of regional variations in radiosensitivity of the PM for severe acute dysphagia. The fact that η002 was the 3D moment invariant with the highest feature importance suggests that the length, which is correlated with the volume, of the PM irradiated is more important for toxicity than the irradiation of any sub-region of the structure. Other studies suggested that different pharyngeal muscles were more radiosensitive [19,21–23]. However, this is likely related to the primary disease sites of the patients used in those studies [24]. The inclusion of multiple spatial dose metrics, sensitive to different spatial aspects of the dose distribution, and a cohort with a wide variety of dose distributions allowed us to explore regional variations in radiosensitivity more thoroughly than has previously been performed. However, we cannot exclude the possibility that different spatial dose metrics [19], combinations of features, models or datasets could support the existence of spatially dependent radiosensitivity for severe acute dysphagia. The feature importance measures (Fig. 3) indicate that the volume of PM receiving intermediate and high doses are most strongly associated with severe acute dysphagia. This is in agreement with another study using the same data, but a different approach to statistical modelling [28]. RFC feature importance does not provide information on whether the correlations between features and outcome are positive or negative. However, the regression coefficients for the PLRstandard model (Table 3) indicate that the higher the value of the dose metrics the greater the probability of severe dysphagia. There is a relatively large increase in feature importance between V80 and V100 (Fig. 3A). A pragmatic recommendation for RT planning techniques aimed at reducing the incidence of severe acute dysphagia, based on these findings, would be to reduce the volume of the entire PM receiving greater than 1 Gy/fraction as much as possible without compromising other aspects of the treatment plan.
A previous model of severe acute dysphagia, without the novel spatial dose metrics, but with a different statistical modelling approach, functional data analysis, had similar discriminative ability to the models trained in this study, but superior performance in terms of the probability calibration [28]. Hence, we recommend that the model recommended in [28] should be preferred over the models presented here for clinical decision-support. The Groningen group have produced and validated models of dysphagia measured six months following RT [10–13,40,41]. Models of severe dysphagia at earlier time points focused on establishing associations between covariates and outcome and, hence, either did not optimize or measure discrimination [15,18,20], included much smaller numbers of patients [19,21] or had lower discriminative ability than the PLRstandard model [16,17]. In addition, with the exception of one study [42], no external validation has been performed. We did not have access to data pertaining to all the covariates, for example genetic polymorphisms, in those published models and, so, were unable to validate them. Moreover, our study featured a more thorough exploration of RT dose-response associations for severe acute dysphagia, including multiple dose levels and different types of spatial dose metric, than previous studies. This resulted in novel insights that could inform RT planning.
Our study possesses several limitations. Firstly, the scoring systems used to assess dysphagia severity differed between the training data and external validation data. The threshold for “severe” dysphagia in the external validation data is higher than in the training data. However, the models generated using the training data generalized well to the external validation data. Whilst the limitations of the CTCAE dysphagia scoring system, which was almost exclusively used when the trials incorporated in this study were conducted, have been demonstrated [43], it has been shown to correlate well with multiple patient-reported quality of life measures [44]. As CTCAE grade 3 and PEG-dependence indicate clinical interventions these are relevant endpoints. The slight difference in the dysphagia scoring systems between the training and external validation cohorts may have reduced the performances of the models on external validation. However, the models performed at least as well on external validation as internal validation. Moreover, it is believed that severe acute dysphagia is a highly complex, multifactorial toxicity with a range of different factors having been implicated. These include tobacco and alcohol use, a patient's pain tolerance and genetic predispositions to severe (chemo)radiation-induced toxicity. Tobacco and alcohol use were not collected in the PAR-SPORT or COSTAR trials. Therefore, these factors could not be included in the analysis. It is also likely that chemotherapy is insufficiently characterized, using binary variables, in our analysis. Finally, like most radiotherapy outcomes modelling studies, the size of the training and validation cohorts are smaller than recommended for clinical decision-support tools [45,46]. We suggest that investigators should strive to collect larger datasets for future development and validation of radiotherapy clinical decision-support tools.
Conclusions
In conclusion, we have trained and externally validated a NTCP model of severe acute dysphagia with very good discriminative ability (external validation AUC = 0.82). We suggest that this model may be suitable for clinical decision-support. Additionally, we established that the volumes of the PM receiving intermediate and high doses, greater than 1 Gy/fraction, are most strongly associated with severe acute dysphagia. These should be minimized in RT planning, where possible, to reduce the incidence of severe acute dysphagia. Our data did not support a regional variation in radiosensitivity for the PM.
Acknowledgments
This work was supported by the Engineering and Physical Sciences Research Council, Cancer Research UK Programme Grant A13407 and NHS funding to the NIHR Biomedical Research Centre at The Royal Marsden and ICR. The PARSPORT and COSTAR trials were supported by Cancer Research UK (trial reference numbers CRUK/03/005 and CRUK/08/004). This research was funded in part through the NIH/NCI Cancer Center Support Grant P30 CA008748. We wish to thank Hannah Eyles and Emma Wells, James Morden and Dr Emma Hall at The Institute of Cancer Research Clinical Trials and Statistics Unit for data collation and Dr Cornelis Kamerling, Dr Alex Dunlop, Dr Dualta McQuaid, Dr Simeon Nill and Prof Uwe Oelfke for general support.
Abbreviations
- PM
pharyngeal mucosa
- PLR
penalized logistic regression
- SVC
support vector classification
- RFC
random forest classification
- AUC
area under the receiver operating characteristic curve
- NTCP
normal tissue complication probability
- RT
radiotherapy
- IMRT
intensity modulated radiotherapy
- CTCAE
Common Terminology Criteria for Adverse Events
- PEG
percutaneous endoscopic gastrostomy
- DVH
dose-volume histogram
- DLH
dose-length histogram
- DCH
dose-circumference histogram
Appendix A. Strategy for handling missing data
If weekly toxicity data are incomplete this can lead to assignment of an incorrect peak toxicity grade. For example, a patient has grade 1 toxicity for weeks 1 to 3, grade 2 toxicity for weeks 4 and 5, missing toxicity week 6 and 1 week following treatment and grade 2 toxicity from 2 weeks following RT to 8 weeks following RT. They would be assigned a peak grade of 2. However, they may, in fact, have experienced grade 3 toxicity, which was not scored, as they were unable to attend their follow-up appointments. This would introduce an error into the analysis. As this type of error can only lead to peak toxicity being under-scored and not over-scored it could introduce bias. Therefore, to reduce bias at the expense of statistical power, patients with any missing toxicity scores and a peak score below 3 were excluded from the analysis. Missing toxicity data were not imputed as many patients (with full toxicity data) with peak toxicity of grade 3 were only scored as grade 3 for one week. We previously investigated the effects of imputing missing toxicity measurements, where there were non-consecutive missing values and found that this made little difference [36]. Patients with some missing toxicity measurements, but at least one measurement scored as grade 3 were included as they must have a peak grade of 3 or higher. It should be noted that retaining patients with missing data, but having a peak grade of 3 skews the apparent incidences of peak toxicity grades. Unbalanced outcome classes were accounted for in the statistical modelling, as described in the manuscript. It should be noted that our approach to handling missing data might still result in bias. Where there are missing data, there is always a risk of bias, particularly where the data are not missing at random. Ultimately, the performance of the model, including any bias introduced by the missing data handling strategy, is assessed by external validation. The external validation dataset had no missing PEG-dependence data.
Appendix B. Comparison of clinical covariate data between training and external validation datasets
Table B1.
Clinical covariate data in the training and external validation data sets.
| Covariate | ntraining (%) | nvalidation (%) |
|---|---|---|
| Definitive RT | 148 (86) | 44 (49) |
| Male | 114 (66) | 68 (76) |
| Induction chemotherapy | 94 (54) | 21 (23) |
| No concurrent chemotherapy | 82 (47) | 46 (51) |
| Cisplatin | 66 (38) | 28 (31) |
| Carboplatin | 14 (8) | 0 (0) |
| Cisplatin/Carboplatin | 11 (6) | 0 (0) |
| Hypopharynx/Larynx | 24 (14) | 25 (28) |
| Oropharynx/Oral cavity | 87 (50) | 41 (46) |
| Nasopharynx/Nasal cavity | 18 (10) | 15 (17) |
| Unknown primary | 10 (6) | 3 (3) |
| Parotid gland | 34 (20) | 6 (7) |
| Covariate | mediantraining (range) | medianvalidation (range) |
| Age | 59 (23–88) | 58 (21–87) |
Concurrent chemotherapy was administered in two cycles, on days 1 and 29 of RT, in the training data cohort and in three cycles on days 1, 22 and 43 of RT for platinum chemotherapy or weekly during RT with the first dose 1 week before day 1 of RT for cetuximab in the external validation cohort.
Appendix C. Pharyngeal mucosa contouring
Fig. C.1 displays an example of the pharyngeal mucosa contouring technique employed.
In addition to the pharyngeal mucosa, irradiation of the cervical oesophagus can also cause dysphagia [21,47]. Therefore, the oesophagus, down to the level of the suprasternal notch, is included in the pharyngeal mucosa organ-at-risk structure. The cranial extent of the structure is the roof of the nasopharynx and the caudal extent is the level of the suprasternal notch. Most patients in the training data cohort were treated with extended neck positioning, to reduce oral cavity doses. Patients in the external validation cohort were treated with a neutral neck position. Contouring the structure took approximately 5 min per patient.
Fig. C1.
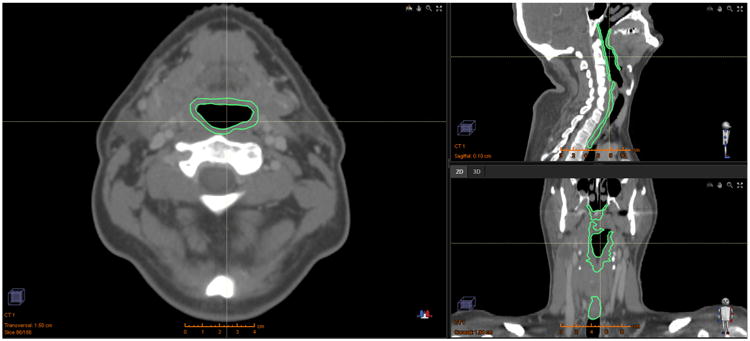
Axial (left), sagittal (top right) and coronal (bottom right) views of an example of the pharyngeal mucosa structure used.
Appendix D. Spatial dose metrics
For the “spatial” models, multiple different metrics, encoding different types of spatial information, were used to represent the fractional dose distribution. The longitudinal and circumferential extents of the dose distribution to the pharyngeal mucosa were extracted by transforming the Cartesian co-ordinates of the pharyngeal mucosa structure into cylindrical co-ordinates, with the long axis in the superior-inferior direction. Binary masks were generated with thresholds at each fractional dose level from 20 cGy to 260 cGy in 20 cGy intervals. For each binary mask, the longitudinal extent was calculated by summing the number of axial slices containing a 1 and multiplying this by the slice thickness. The circumferential extent was calculated by determining the maximum angle subtended in the axial plane by the binary mask, with the angle measured from the centre of mass of the pharyngeal mucosa. The absolute longitudinal and circumferential extents were normalized to the entire length (by dividing by the length of the pharyngeal mucosa OAR and converting to a percentage) and circumference (by dividing by 360 degrees and converting to a percentage) of the pharyngeal mucosa. It should be noted that the length and circumference could alternatively be characterized by the minimum or mean extent for each binary mask. However, due to the nature of the pharyngeal mucosa dose distributions for head and neck radiotherapy patients these are very similar to the maximum extent (data not shown).
This approach differed from other methods used to characterize the spatial distribution of the dose to other tubular organs, such as 2D dose-surface maps for the rectum [48,49]. The reasons for this were twofold. Firstly, the pharynx is a straight rigid structure (although there could be some deformation anteriorly), unlike some other tubular organs, like the rectum, which are more tortuous. Therefore, more sophisticated methods that account for this curvature in construction of the dose-surface maps would not be expected to offer any significant improvement in the accuracy of the spatial description of the dose distribution, compared with our pragmatic approach. Secondly, the pharynx is not a simple tubular shape, but contains “internal structure”, such as the uvula and glossoepiglottic fold. Hence, it is not trivial to “unwrap” it into a 2D map.
3D moment invariants, ηabc [25] describing the spatial distribution of the dose were calculated using the expression
| (1) |
where
| (2) |
where x, y and z are the voxel coordinates, D(x,y,z) is the dose delivered to the voxel with coordinates (x,y,z), I(x,y,z) is an identity function, which takes a value of 1 if the voxel belongs to the OAR and 0 if it does not, and (x̄,ȳ,z̄) is the centre of gravity of the OAR. The moments are translational and scale invariant. The left-right symmetry is accounted for such that the moments in the left-right direction describe how lateralized or centralized the dose is. Moments describing the centre of mass (η001, η010, η100, η011, η101, η110, η111), Spread η002, η020, η200) and skewnes (η003, η030, η003) of the dose distribution in the three orthogonal directions (left-right, anterior-posterior, superior-inferior) within each structure were calculated. These allow for regional variations in radiosensitivity to be probed. These would manifest as differences in one or more of the moment invariants between patients who experienced severe mucositis and those who did not. The dose metrics were used as covariates in the statistical modelling.
The software, to extract the planned dose distributions to the pharyngeal mucosa from the DICOM data and compute the fractional DVHs and spatial dose metrics, was developed using the Python version 2.7.9 programming language [50] and the NumPy version 1.9.2 [51], SciPy version 0.15.1 [51], Matplotlib version 1.4.3 [52], Seaborn version 0.6.0 [53] and PyDicom version 0.9.9 [54] modules.
Appendix E. Machine learning methods
All features were transformed to standardized scores (mean = 0, standard deviation = 1) to avoid scale-related feature dominance. Three different types of classification model were trained: penalized logistic regression (PLR) [55], support vector classification (SVC) [56] and random forest classification (RFC) [57]. The models all penalize complexity to prevent overfitting due to the high number of covariates per toxicity event. We have previously discussed these techniques and their advantages over “conventional” univariable and multivariable logistic regression models in NTCP modelling [36]. Two different versions of each of the three types of model were generated. One with “standard” dose covariates, describing the dose-distribution using the DVH, and the other with “spatial” dose covariates, describing the dose distribution using the DLH, DCH and 3D moment invariants. During model fitting the outcome classes, severe and non-severe dysphagia, were weighted inversely proportional to the class frequencies in the training data to account for the fact that the frequencies of the outcomes were unbalanced. Model hyper-parameter tuning was carried out using a cross-validated grid search with shuffled stratified cross-validation (with 80/20 training/test split) with 100 iterations. The possible hyper-parameters over which the grid-searchers were performed were:
PLR: regularization = {LASSO (L1), ridge (L2)}; inverse regularization strength (C) = {0.001, 0.01, 0.1, 1.0, 10.0, 100.0, 1000.0}.
SVC: kernel = {linear, radial basis function}; C = {0.0001, 0.001, 0.01, 0.1, 1.0, 10.0, 100.0, 1000.0}; kernel coefficient for radial basis function = {0.0001, 0.001, 0.01, 0.1, 1.0, 10.0, 100.0, 1000.0}.
RFC: number of estimators = 1000; maximum depth = {5, 10, 15, 20}; maximum features = {number of features, number of features/2, square root of number of features}.
To address the first aim, the generalizability of the models to correctly predict dysphagia severity for “unseen” patients was measured through internal and external validation. Internal validation used a nested shuffled stratified cross-validation, with 80/20 training/test split. Covariate transformation to standardized scores and hyper-parameter tuning with a 5-fold cross-validated grid search with 100 iterations, were nested within the internal validation cross-validation to give unbiased error estimates. For external validation NTCP was calculated for each of the 90 external validation patients, using the models generated with the training data, and compared with the known PEG-insertion data. The external validation was bootstrapped with 2000 replicates.
Predictive performance was assessed, using several metrics, on internal and external validation. The area under the receiver operating characteristic curve (AUC) was used to measure discriminative ability for model training and validation. Log loss [58] was calculated to assess the model probability estimates and the Brier score [59] was calculated to evaluate the overall model performance. Model calibration was assessed, using the slope and intercept of a logistic regression model of the actual toxicity outcomes against the predicted probabilities of severe dysphagia [60,61]. Following external validation, the best model was updated for the Washington University patients with PEG-dependence outcome data by recalibrating it using logistic regression (logistic calibration) [62]. This improves model calibration, but does not affect discrimination. More complex model updating was not attempted due to the relatively small size of the external validation cohort [63].
To address the second aim of establishing associations between the model covariates and severe dysphagia, the feature importance values for each covariate in the RFC models were bootstrapped with 2000 replicates. We have previously determined this approach to provide a more interpretable understanding of the relationship between the RT dose distribution and toxicity than, the conventionally used, logistic regression, in the context of correlated dose metrics [36]. The feature importance is the total decrease in node impurity, weighted by the probability of reaching that node, approximated by the proportion of patients reaching that node, averaged over all of the trees in the ensemble [57]. Larger values correspond to more important features. The importance values of all the covariates sum to 1. The Pandas version 0.18.0 [64] and Scikit Learn version 0.17 [65] Python modules and val.prob.ci.2 [66] R package were used for statistical analysis.
Appendix F. Correlation matrix
Fig. F.1 shows the correlation matrix of the covariates and outcome variables included in the study.
Fig. F1.
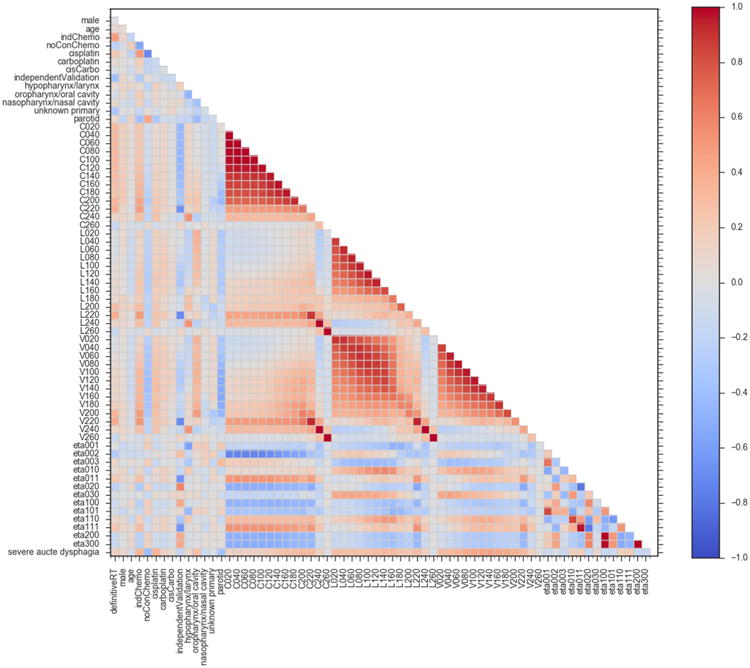
Correlation matrix of the model variables. The colour scale shows the Spearman correlation coefficients between the model covariates. definitiveRT – definitive radiotherapy (versus post-operative radiotherapy); indChemo – induction chemotherapy; noConChemo – no concurrent chemotherapy; cisCarbo – one cycle of cisplatin followed by one cycle of carboplatin; independentValidation – patients included in external validation cohort and not used for model training or internal validation; Cx – normalized circumference of pharyngeal mucosa receiving × cGy of radiation per fraction; Lx – normalized length of pharyngeal mucosa receiving × cGy of radiation per fraction; Vx – normalized volume of pharyngeal mucosa receiving × cGy of radiation per fraction; etax – 3D moment invariants (described in Appendix D); severe acute dysphagia – peak acute dysphagia severity (non-severe = 0, severe = 1).
Appendix G. Combined dose-volume and spatial dose metrics feature importance
Fig. G.1 displays the feature importance values for a RFC model including both the dose-volume and spatial dose metrics.
For equivalent dose levels the volume of pharyngeal mucosa had higher feature importance than the length or circumference. For completeness, the discriminative ability of this model was measured on internal and external validation in the same manner as for the other models (described in the manuscript). The mean internal validation AUC = 0.73 (s.d. = 0.07) and external validation AUC = 0.75 (95 percentile confidence intervals = 0.64–0.85) for this model.
Fig. G1.
Bootstrapped feature importance values for a RFC model containing all of the covariates considered in the study. The whiskers indicate the 95 percentile confidence intervals.
Appendix H. Potential applications of the model
A potential application, for institutions operating a prophylactic, rather than reactive, approach to PEG insertion, would be to use the model to exclude a subset of patients, at low risk of PEG-dependence, from receiving this prophylactic intervention. This may result in improved long-term swallowing outcomes for these patients, as early reliance on PEG feeding has been associated with poorer long-term swallowing function in some [67,68] studies. Other potential applications include treatment plan or regimen comparison, using the model to calculate and compare the probabilities of a patient experiencing severe acute dysphagia with alternative treatment plans. Alternatively, the model could be directly used in treatment plan optimisation in place of physical dose constraints [69], for informing treatment modality selection [8] and isotoxic dose escalation, in a similar manner to approaches being evaluated in lung RT [9]. We recommend the use of decision curve analysis [70] when determining the utility of a prediction model for individualized clinical decision-making for a specific intervention.
Footnotes
Conflicts of interest: None.
Appendix I.Supplementary data: Supplementary data associated with this article can be found, in the online version, at https://doi.org/10.1016/j.ctro.2017.11.009.
References
- 1.Terrell JE, Ronis DL, Fowler KE, Bradford CR, Chepeha DB, Prince ME, et al. Clinical predictors of quality of life in patients with head and neck cancer. Arch Otolaryngol Head Neck Surg. 2004;130:401–8. doi: 10.1001/archotol.130.4.401. https://doi.org/10.1001/archotol.130.4.401. [DOI] [PubMed] [Google Scholar]
- 2.List MA, D'Antonio LL, Cella DF, Siston A, Mumby P, Haraf D, et al. The performance status scale for head and neck cancer patients and the functional assessment of cancer therapy-head and neck scale. A study of utility and validity. Cancer. 1996;77:2294–301. doi: 10.1002/(SICI)1097-0142(19960601)77:11<2294::AID-CNCR17>3.0.CO;2-S. https://doi.org/10.1002/(SICI)1097-0142(19960601)77:11<2294∷AID-CNCR17>3.0.CO;2-S. [DOI] [PubMed] [Google Scholar]
- 3.Nguyen NP, Sallah S, Karlsson U, Antoine JE. Combined chemotherapy and radiation therapy for head and neck malignancies. Cancer. 2002;94:1131–41. doi: 10.1002/cncr.10257. https://doi.org/10.1002/cncr.10257. [DOI] [PubMed] [Google Scholar]
- 4.Sonis ST. Mucositis: the impact, biology and therapeutic opportunities of oral mucositis. Oral Oncol. 2009;45:1015–20. doi: 10.1016/j.oraloncology.2009.08.006. https://doi.org/10.1016/j.oraloncology.2009.08.006. [DOI] [PubMed] [Google Scholar]
- 5.Bentzen SM. Preventing or reducing late side effects of radiation therapy: radiobiology meets molecular pathology. Nat Rev Cancer. 2006;6:702–13. doi: 10.1038/nrc1950. https://doi.org/10.1038/nrc1950. [DOI] [PubMed] [Google Scholar]
- 6.van der Laan HP, Bijl HP, Steenbakkers RJHM, van der Schaaf A, Chouvalova O, Vemer-van den Hoek JGM, et al. Acute symptoms during the course of head and neck radiotherapy or chemoradiation are strong predictors of late dysphagia. Radiother Oncol. 2015;115:56–62. doi: 10.1016/j.radonc.2015.01.019. https://doi.org/10.1016/j.radonc.2015.01.019. [DOI] [PubMed] [Google Scholar]
- 7.Dehing-Oberije C, De Ruysscher D, Petit S, Van Meerbeeck J, Vandecasteele K, De Neve W, et al. Development, external validation and clinical usefulness of a practical prediction model for radiation-induced dysphagia in lung cancer patients. Radiother Oncol. 2010;97:455–61. doi: 10.1016/j.radonc.2010.09.028. https://doi.org/10.1016/j.radonc.2010.09.028. [DOI] [PubMed] [Google Scholar]
- 8.Langendijk JA, Lambin P, De Ruysscher D, Widder J, Bos M, Verheij M. Selection of patients for radiotherapy with protons aiming at reduction of side effects: the model-based approach. Radiother Oncol. 2013;107:267–73. doi: 10.1016/j.radonc.2013.05.007. https://doi.org/10.1016/j.radonc.2013.05.007. [DOI] [PubMed] [Google Scholar]
- 9.van Baardwijk A, Wanders S, Boersma L, Borger J, Ollers M, Dingemans AM, et al. Mature results of an individualized radiation dose prescription study based on normal tissue constraints in stages I to III non-small-cell lung cancer. J Clin Oncol. 2010;28:1380–6. doi: 10.1200/JCO.2009.24.7221. https://doi.org/10.1200/JCO.2009.24.7221. [DOI] [PubMed] [Google Scholar]
- 10.Christianen MEMC, Schilstra C, Beetz I, Muijs CT, Chouvalova O, Burlage FR, et al. Predictive modelling for swallowing dysfunction after primary (chemo) radiation: results of a prospective observational study. Radiother Oncol. 2012;105:107–14. doi: 10.1016/j.radonc.2011.08.009. https://doi.org/10.1016/j.radonc.2011.08.009. [DOI] [PubMed] [Google Scholar]
- 11.Wopken K, Bijl HP, van der Schaaf A, van der Laan HP, Chouvalova O, Steenbakkers RJHM, et al. Development of a multivariable normal tissue complication probability (NTCP) model for tube feeding dependence after curative radiotherapy/chemo-radiotherapy in head and neck cancer. Radiother Oncol. 2014;113:95–101. doi: 10.1016/j.radonc.2014.09.013. https://doi.org/10.1016/j.radonc.2014.09.013. [DOI] [PubMed] [Google Scholar]
- 12.Christianen MEMC, van der Schaaf A, van der Laan HP, Verdonck-de Leeuw IM, Doornaert P, Chouvalova O, et al. Swallowing sparing intensity modulated radiotherapy (SW-IMRT) in head and neck cancer: clinical validation according to the model-based approach. Radiother Oncol. 2016;118:298–303. doi: 10.1016/j.radonc.2015.11.009. https://doi.org/10.1016/j.radonc.2015.11.009. [DOI] [PubMed] [Google Scholar]
- 13.Wopken K, Bijl HP, Van Der Schaaf A, Christianen ME, Chouvalova O, Oosting SF, et al. Development and validation of a prediction model for tube feeding dependence after curative (Chemo-) radiation in head and neck cancer. PLoS ONE. 2014;9:1–8. doi: 10.1371/journal.pone.0094879. https://doi.org/10.1371/journal.pone.0094879. [DOI] [PMC free article] [PubMed] [Google Scholar]
- 14.Blanchard P, Wong AJ, Gunn GB, Garden AS, Mohamed ASR, Rosenthal DI, et al. Toward a model-based patient selection strategy for proton therapy: external validation of photon-derived normal tissue complication probability models in a head and neck proton therapy cohort. Radiother Oncol. 2016;121:381–6. doi: 10.1016/j.radonc.2016.08.022. https://doi.org/10.1016/j.radonc.2016.08.022. [DOI] [PMC free article] [PubMed] [Google Scholar]
- 15.Werbrouck J, De Ruyck K, Duprez F, Veldeman L, Claes K, Van Eijkeren M, et al. Acute normal tissue reactions in head-and-neck cancer patients treated with IMRT: influence of dose and association with genetic polymorphisms in DNA DSB repair genes. Int J Radiat Oncol Biol Phys. 2009;73:1187–95. doi: 10.1016/j.ijrobp.2008.08.073. https://doi.org/10.1016/j.ijrobp.2008.08.073. [DOI] [PubMed] [Google Scholar]
- 16.De Ruyck K, Duprez F, Werbrouck J, Sabbe N, Sofie DL, Boterberg T, et al. A predictive model for dysphagia following IMRT for head and neck cancer: introduction of the EMLasso technique. Radiother Oncol. 2013;107:295–9. doi: 10.1016/j.radonc.2013.03.021. https://doi.org/10.1016/j.radonc.2013.03.021. [DOI] [PubMed] [Google Scholar]
- 17.Sanguineti G, Gunn GB, Parker BC, Endres EJ, Zeng J, Fiorino C. Weekly dose-volume parameters of mucosa and constrictor muscles predict the use of percutaneous endoscopic gastrostomy during exclusive intensity-modulated radiotherapy for oropharyngeal cancer. Int J Radiat Oncol Biol Phys. 2011;79:52–9. doi: 10.1016/j.ijrobp.2009.10.057. https://doi.org/10.1016/j.ijrobp.2009.10.057. [DOI] [PubMed] [Google Scholar]
- 18.Mortensen HR, Overgaard J, Jensen K, Specht L, Overgaard M, Johansen J, et al. Factors associated with acute and late dysphagia in the DAHANCA 6 & 7 randomized trial with accelerated radiotherapy for head and neck cancer. Acta Oncol. 2013;52:1535–42. doi: 10.3109/0284186X.2013.824609. https://doi.org/10.3109/0284186X.2013.824609. [DOI] [PubMed] [Google Scholar]
- 19.Monti S, Palma G, D'Avino V, Gerardi M, Marvaso G, Ciardo D, et al. Voxel-based analysis unveils regional dose differences associated with radiation-induced morbidity in head and neck cancer patients. Sci Rep. 2017;7:7220. doi: 10.1038/s41598-017-07586-x. https://doi.org/10.1038/s41598-017-07586-x. [DOI] [PMC free article] [PubMed] [Google Scholar]
- 20.Matuschek C, Bölke E, Geigis C, Kammers K, Ganswindt U, Scheckenbach K, et al. Influence of dosimetric and clinical criteria on the requirement of artificial nutrition during radiotherapy of head and neck cancer patients. Radiother Oncol. 2016;120:28–35. doi: 10.1016/j.radonc.2016.05.017. https://doi.org/10.1016/j.radonc.2016.05.017. [DOI] [PubMed] [Google Scholar]
- 21.Alterio D, Gerardi MA, Cella L, Spoto R, Zurlo V, Sabbatini A, et al. Radiation-induced acute dysphagia. Prospective observational study on 42 head and neck cancer patients. Strahlenther Onkol. 2017:971–81. doi: 10.1007/s00066-017-1206-x. https://doi.org/10.1007/s00066-017-1206-x. [DOI] [PubMed]
- 22.Wang X, Hu C, Eisbruch A. Organ-sparing radiation therapy for head and neck cancer. Nat Rev Clin Oncol. 2011;8:639–48. doi: 10.1038/nrclinonc.2011.106. https://doi.org/10.1038/nrclinonc.2011.106. [DOI] [PubMed] [Google Scholar]
- 23.Schindler A, Denaro N, Russi EG, Pizzorni N, Bossi P, Merlotti A, et al. Dysphagia in head and neck cancer patients treated with radiotherapy and systemic therapies: literature review and consensus. Crit Rev Oncol Hematol. 2015;96:372–84. doi: 10.1016/j.critrevonc.2015.06.005. https://doi.org/10.1016/j.critrevonc.2015.06.005. [DOI] [PubMed] [Google Scholar]
- 24.Vainshtein J, Eisbruch A. Function, muscles, and sparing by IMRT for head-and-neck cancer. Int J Radiat Oncol Biol Phys. 2013;85:577–8. doi: 10.1016/j.ijrobp.2012.08.040. https://doi.org/10.1016/j.ijrobp.2012.08.040. [DOI] [PubMed] [Google Scholar]
- 25.Buettner F, Miah AB, Gulliford SL, Hall E, Harrington KJ, Webb S, et al. Novel approaches to improve the therapeutic index of head and neck radiotherapy: an analysis of data from the PARSPORT randomised phase III trial. Radiother Oncol. 2012;103:82–7. doi: 10.1016/j.radonc.2012.02.006. https://doi.org/10.1016/j.radonc.2012.02.006. [DOI] [PubMed] [Google Scholar]
- 26.Buettner F, Gulliford SL, Webb S, Sydes MR, Dearnaley DP, Partridge M. The dose-response of the anal sphincter region – An analysis of data from the MRC RT01 trial. Radiother Oncol. 2012;103:347–52. doi: 10.1016/j.radonc.2012.03.002. https://doi.org/10.1016/j.radonc.2012.03.002. [DOI] [PubMed] [Google Scholar]
- 27.Otter S, Schick U, Gulliford S, Lal P, Franceschini D, Newbold K, et al. Evaluation of the risk of grade 3 oral and pharyngeal dysphagia using atlas-based method and multivariate analyses of individual patient dose distributions. Int J Radiat Oncol Biol Phys. 2015;93:507–15. doi: 10.1016/j.ijrobp.2015.07.2263. https://doi.org/10.1016/j.ijrobp.2015.07.2263. [DOI] [PubMed] [Google Scholar]
- 28.Dean JA, Wong KH, Gay H, Welsh LC, Jones AB, Schick U, et al. Functional data analysis applied to modeling of severe acute mucositis and dysphagia resulting from head and neck radiation therapy. Int J Radiat Oncol Biol Phys. 2016;96:820–31. doi: 10.1016/j.ijrobp.2016.08.013. https://doi.org/10.1016/j.ijrobp.2016.08.013. [DOI] [PMC free article] [PubMed] [Google Scholar]
- 29.Nutting CM, Morden JP, Harrington KJ, Urbano TG, Bhide SA, Clark C, et al. Parotid-sparing intensity modulated versus conventional radiotherapy in head and neck cancer (PARSPORT): a phase 3 multicentre randomised controlled trial. Lancet Oncol. 2011;12:127–36. doi: 10.1016/S1470-2045(10)70290-4. https://doi.org/10.1016/S1470-2045(10)70290-4. [DOI] [PMC free article] [PubMed] [Google Scholar]
- 30.Gujral DM, Miah AB, Bodla S, Richards TM, Welsh L, Schick U, et al. Final long-term results of a phase I/II study of dose-escalated intensity-modulated radiotherapy for locally advanced laryngo-hypopharyngeal cancers. Oral Oncol. 2014;50:1089–97. doi: 10.1016/j.oraloncology.2014.07.018. https://doi.org/10.1016/j.oraloncology.2014.07.018. [DOI] [PubMed] [Google Scholar]
- 31.Miah AB, Schick U, Bhide SA, Guerrero-Urbano MT, Clark CH, Bidmead AM, et al. A phase II trial of induction chemotherapy and chemo-IMRT for head and neck squamous cell cancers at risk of bilateral nodal spread: the application of a bilateral superficial lobe parotid-sparing IMRT technique and treatment outcomes. Br J Cancer. 2015;112:32–8. doi: 10.1038/bjc.2014.553. https://doi.org/10.1038/bjc.2014.553. [DOI] [PMC free article] [PubMed] [Google Scholar]
- 32.Miah AB, Bhide SA, Del Rosario L, Matthews J, Nicol R, Tanay MA, et al. Induction chemotherapy followed by chemo-intensity-modulated radiotherapy for locally advanced nasopharyngeal cancer. Clin Oncol. 2016;28:e61–67. doi: 10.1016/j.clon.2016.01.012. https://doi.org/10.1016/j.clon.2016.01.012. [DOI] [PubMed] [Google Scholar]
- 33.Richards TM, Bhide SA, Miah AB, Del Rosario L, Bodla S, Thway K, et al. Total mucosal irradiation with intensity-modulated radiotherapy in patients with head and neck carcinoma of unknown primary: a pooled analysis of two prospective studies. Clin Oncol. 2016;28:e77–84. doi: 10.1016/j.clon.2016.04.035. https://doi.org/10.1016/j.clon.2016.04.035. [DOI] [PubMed] [Google Scholar]
- 34.The National Cancer Institute. Common Terminology Criteria for Adverse Events v3.0 (CTCAE) 2006 [Google Scholar]
- 35.Tucker SL, Michalski JM, Bosch WR, Mohan R, Dong L, Winter K, et al. Use of fractional dose-volume histograms to model risk of acute rectal toxicity among patients treated on RTOG 94–06. Radiother Oncol. 2012;104:109–13. doi: 10.1016/j.radonc.2012.04.023. https://doi.org/10.1016/j.radonc.2012.04.023. [DOI] [PMC free article] [PubMed] [Google Scholar]
- 36.Dean JA, Wong KH, Welsh LC, Jones AB, Schick U, Newbold KL, et al. Normal tissue complication probability (NTCP) modelling using spatial dose metrics and machine learning methods for severe acute oral mucositis resulting from head and neck radiotherapy. Radiother Oncol. 2016;120:21–7. doi: 10.1016/j.radonc.2016.05.015. https://doi.org/10.1016/j.radonc.2016.05.015. [DOI] [PMC free article] [PubMed] [Google Scholar]
- 37.Platt J. Probabilistic outputs for support vector machines and comparisons to regularized likelihood methods. Adv Large Margin Classif. 1999;10:61–74. doi:10.1.1.41.1639. [Google Scholar]
- 38.Vickers AJ, Cronin AM. Traditional statistical methods for evaluating prediction models are uninformative as to clinical value: towards a decision analytic framework. Semin Oncol. 2010;37:31–8. doi: 10.1053/j.seminoncol.2009.12.004. https://doi.org/10.1053/j.seminoncol.2009.12.004. [DOI] [PMC free article] [PubMed] [Google Scholar]
- 39.Strobl C, Boulesteix AL, Zeileis A, Hothorn T. Bias in random forest variable importance measures: illustrations, sources and a solution. BMC Bioinf. 2007;8:25. doi: 10.1186/1471-2105-8-25. https://doi.org/10.1186/1471-2105-8-25. [DOI] [PMC free article] [PubMed] [Google Scholar]
- 40.Langendijk JA, Doornaert P, Rietveld DHF, Verdonck-de Leeuw IM, René Leemans C, Slotman BJ. A predictive model for swallowing dysfunction after curative radiotherapy in head and neck cancer. Radiother Oncol. 2009;90:189–95. doi: 10.1016/j.radonc.2008.12.017. https://doi.org/10.1016/j.radonc.2008.12.017. [DOI] [PubMed] [Google Scholar]
- 41.van der Laan HP, Gawryszuk A, Christianen MEMC, Steenbakkers RJHM, Korevaar EW, Chouvalova O, et al. Swallowing-sparing intensity-modulated radiotherapy for head and neck cancer patients: treatment planning optimization and clinical introduction. Radiother Oncol. 2013;107:282–7. doi: 10.1016/j.radonc.2013.05.004. https://doi.org/10.1016/j.radonc.2013.05.004. [DOI] [PubMed] [Google Scholar]
- 42.Anderson NJ, Wada M, Schneider-Kolsky M, Rolfo M, Joon DL, Khoo V. Dose-volume response in acute dysphagia toxicity: validating QUANTEC recommendations into clinical practice for head and neck radiotherapy. Acta Oncol. 2014;53:1305–11. doi: 10.3109/0284186X.2014.933874. https://doi.org/10.3109/0284186X.2014.933874. [DOI] [PubMed] [Google Scholar]
- 43.Gluck I, Feng FY, Lyden T, Haxer M, Worden F, Chepeha DB, et al. Evaluating and reporting dysphagia in trials of chemoirradiation for head-and-neck cancer. Int J Radiat Oncol Biol Phys. 2010;77:727–33. doi: 10.1016/j.ijrobp.2009.05.049. https://doi.org/10.1016/j.ijrobp.2009.05.049. [DOI] [PMC free article] [PubMed] [Google Scholar]
- 44.Hunter KU, Schipper M, Feng FY, Lyden T, Haxer M, Murdoch-Kinch CA, et al. Toxicities affecting quality of life after chemo-IMRT of oropharyngeal cancer: prospective study of patient-reported, observer-rated, and objective outcomes. Int J Radiat Oncol Biol Phys. 2013;85:935–40. doi: 10.1016/j.ijrobp.2012.08.030. https://doi.org/10.1016/j.ijrobp.2012.08.030. [DOI] [PMC free article] [PubMed] [Google Scholar]
- 45.Collins GS, Ogundimu EO, Altman DG. Sample size considerations for the external validation of a multivariable prognostic model: a resampling study. Stat Med. 2015 doi: 10.1002/sim.6787. https://doi.org/10.1002/sim.6787. [DOI] [PMC free article] [PubMed]
- 46.Collins GS, Le Manach Y. Small data sets to develop and validate prognostic models are problematic. Eur J Cancer. 2016;54:167–8. doi: 10.1016/j.ejca.2015.09.025. https://doi.org/10.1016/j.ejca.2015.09.025. [DOI] [PubMed] [Google Scholar]
- 47.Werner-Wasik M, Yorke E, Deasy J, Nam J, Marks LB. Radiation dose-volume effects in the esophagus. Int J Radiat Oncol Biol Phys. 2010;76:86–93. doi: 10.1016/j.ijrobp.2009.05.070. https://doi.org/10.1016/j.biotechadv.2011.08.021.Secreted. [DOI] [PMC free article] [PubMed] [Google Scholar]
- 48.Munbodh R, Jackson A, Bauer J, Ross Schmidtlein C, Zelefsky MJ. Dosimetric and anatomic indicators of late rectal toxicity after high-dose intensity modulated radiation therapy for prostate cancer. Med Phys. 2008;35:2137–50. doi: 10.1118/1.2907707. https://doi.org/10.1118/1.2907707. [DOI] [PubMed] [Google Scholar]
- 49.Buettner F, Gulliford SL, Webb S, Partridge M. Using dose-surface maps to predict radiation-induced rectal bleeding: a neural network approach. Phys Med Biol. 2009;54:5139–53. doi: 10.1088/0031-9155/54/17/005. https://doi.org/10.1088/0031-9155/54/17/005. [DOI] [PubMed] [Google Scholar]
- 50.Rossum G. Python Reference Manual. 1995 [Google Scholar]
- 51.van der Walt S, Colbert SC, Varoquaux G. The NumPy array: a structure for efficient numerical computation. Comput Sci Eng. 2011;13:22–30. https://doi.org/10.1109/MCSE.2011.37. [Google Scholar]
- 52.Hunter JD. Matplotlib: a 2D graphics environment. Comput Sci Eng. 2007;9:90–5. https://doi.org/10.1109/MCSE.2007.55. [Google Scholar]
- 53.Waskom M. Seaborn. [Accessed July 1, 2015];2015 doi: 10.5281/zenodo.19108. https//github.com/mwaskom/seaborn/tree/v060. [DOI]
- 54.Mason D. SU-E-T-33: Pydicom: an open source DICOM library. Med Phys. 2011;38:3493. https://doi.org/10.1118/1.3611983. [Google Scholar]
- 55.Tibshirani R. Regression shrinkage and selection via the Lasso. J R Stat Soc Ser B. 1996;58:267–88. https://doi.org/10.1111/j.1467-9868.2011.00771.x. [Google Scholar]
- 56.Cortes C, Vapnik V. Support-Vector Networks. Mach Learn. 1995;297:273–97. [Google Scholar]
- 57.Breiman L. Random Forests. Mach Learn. 2001;45:5–32. https://doi.org/10.1023/A:1010933404324. [Google Scholar]
- 58.Good IJ. Rational decisions. J R Stat Soc Ser B. 1952;14:107–14. [Google Scholar]
- 59.Brier GW. Verification of forecasts expersses in terms of probaility. Mon Weather Rev. 1950;78:1–3. https://doi.org/10.1126/science.27.693.594. [Google Scholar]
- 60.Steyerberg EW, Vickers AJ, Cook NR, Gerds T, Gonen M, Obuchowski N, et al. Assessing the performance of prediction models: a framework for traditional and novel measures. Epidemiology. 2010;21:128–38. doi: 10.1097/EDE.0b013e3181c30fb2. https://doi.org/10.1097/EDE.0b013e3181c30fb2. [DOI] [PMC free article] [PubMed] [Google Scholar]
- 61.Pavlou M, Ambler G, Seaman SR, Guttmann O, Elliott P, King M, et al. How to develop a more accurate risk prediction model when there are few events. BMJ. 2015;351:h3868. doi: 10.1136/bmj.h3868. https://doi.org/10.1136/bmj.h3868. [DOI] [PMC free article] [PubMed] [Google Scholar]
- 62.Steyerberg EW, Borsboom GJJM, van Houwelingen HC, Eijkemans MJC, Habbema JDF. Validation and updating of predictive logistic regression models: a study on sample size and shrinkage. Stat Med. 2004;23:2567–86. doi: 10.1002/sim.1844. https://doi.org/10.1002/sim.1844. [DOI] [PubMed] [Google Scholar]
- 63.Moons KGM, Altman DG, Reitsma JB, Ioannidis JPA, Macaskill P, Steyerberg EW, et al. Transparent reporting of a multivariable prediction model for Individual Prognosis Or Diagnosis (TRIPOD): explanation and elaboration. Ann Intern Med. 2015;162:W1–W73. doi: 10.7326/M14-0698. https://doi.org/10.7326/M14-0698. [DOI] [PubMed] [Google Scholar]
- 64.McKinney W. Data structures for statistical computing. Python Proc 9th Python Sci Conf. 2010:51–6. [Google Scholar]
- 65.Pedregosa F, Weiss R, Brucher M. Scikit-learn: Machine learning in Python. 2011;12:2825–30. [Google Scholar]
- 66.Van Calster B, Nieboer D, Vergouwe Y, De Cock B, Pencina MJ, Steyerberg EW. A calibration hierarchy for risk models was defined: from utopia to empirical data. J Clin Epidemiol. 2016;74:167–76. doi: 10.1016/j.jclinepi.2015.12.005. https://doi.org/10.1016/j.jclinepi.2015.12.005. [DOI] [PubMed] [Google Scholar]
- 67.Chen AM, Li BQ, Lau DH, Farwell DG, Luu Q, Stuart K, et al. Evaluating the role of prophylactic gastrostomy tube placement prior to definitive chemoradiotherapy for head and neck cancer. Int J Radiat Oncol Biol Phys. 2010;78:1026–32. doi: 10.1016/j.ijrobp.2009.09.036. https://doi.org/10.1016/j.ijrobp.2009.09.036. [DOI] [PubMed] [Google Scholar]
- 68.Langmore S, Krisciunas GP, Miloro KV, Evans SR, Cheng DM. Does PEG use cause dysphagia in head and neck cancer patients? Dysphagia. 2012;27:251–9. doi: 10.1007/s00455-011-9360-2. https://doi.org/10.1007/s00455-011-9360-2. [DOI] [PMC free article] [PubMed] [Google Scholar]
- 69.Kierkels RGJ, Korevaar EW, Steenbakkers RJHM, Janssen T, van't Veld AA, et al. Langendijk JA. Direct use of multivariable normal tissue complication probability models in treatment plan optimisation for individualised head and neck cancer radiotherapy produces clinically acceptable treatment plans. Radiother Oncol. 2014;112:430–6. doi: 10.1016/j.radonc.2014.08.020. https://doi.org/10.1016/j.radonc.2014.08.020. [DOI] [PubMed] [Google Scholar]
- 70.Vickers AJ, Elkin EB. Decision curve analysis: a novel method for evaluating prediction models. Med Decis Mak. 2006;26:565–74. doi: 10.1177/0272989X06295361. https://doi.org/10.1177/0272989X06295361. [DOI] [PMC free article] [PubMed] [Google Scholar]