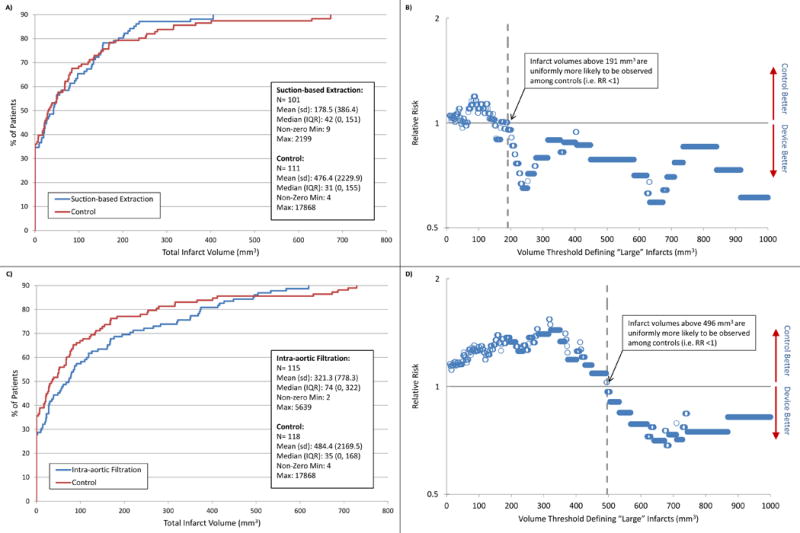
Figure 2. Distribution of lesion volume by randomization arm at day 7.

Panels A and C depict deciles of the observed infarct volume distributions for the suction-based extraction device and intra-aortic filtration device respectively, compared to control. Panel A shows, for example, that the 80th percentile of radiographic infarcts were <191mm3 for the suction-based extraction device and <236mm3 for controls. Panel C shows that the 80th percentile of infarcts were <374mm3 for intra-aortic filtration device and <273mm3 for controls. The plotted points in panels B and D depict the natural log of relative risk of “large” volume infarcts for each of the treatment devices compared to their controls as the cut-off value defining “large” varies from 10 to 1000 or above on the x-axis. Values <0 (below the solid line) favor the embolic protection device, and values >0 (above the solid line) favor the control.
