Abstract
No study has analyzed how protein intake from early childhood to young adulthood relate to adult BMI in a single cohort. To estimate the association of protein intake at 2y, 11y, 15y, 19y and 22y with age- and sex-standardized BMI at 22y (early adulthood), we used linear regression models to analyse dietary and anthropometric data from a Filipino birth cohort (1985–2005, n=2586). We used latent growth curve analysis to identify trajectories of protein intake relative to age-specific recommended daily allowance (intake in g/kg body weight) from 2–22y, then related trajectory membership to early adulthood BMI using linear regression models. Lean mass and fat mass were secondary outcomes. Regression models included socioeconomic, dietary and anthropometric confounders from early life and adulthood. Protein intake relative to needs at age 2 was positively associated with BMI and lean mass at age 22y, but intakes at ages 11, 15 and 22y were inversely associated with early adulthood BMI. Individuals were classified into 4 mutually exclusive trajectories: i) normal consumers (referent trajectory, 58% of cohort), ii) high protein consumers in infancy (20%), iii) usually high consumers (18%) and iv) always high consumers (5%). Compared to the normal consumers, ‘usually high’ consumption was inversely associated with BMI, lean mass and fat mass at age 22 while ‘always high’ consumption was inversely associated with male lean mass in males. Proximal protein intakes were more important contributors to early adult BMI relative to early childhood protein intake; protein intake history was differentially associated with adulthood body size.
Keywords: protein, life course epidemiology, diet, longitudinal data analysis, body mass index
Introduction
Conventionally, proximal behaviors are thought to strongly modify disease risk but examining early life factors may yield intriguing insights into the origins of later disease. 1 For example, clarifying how the infant diet may influence later obesity risk is important as it may highlight a window of opportunity for designing interventions that promote health across the life course. In particular, the role of dietary protein in modifying obesity risk deserves further attention. 2
During infancy, adequate protein intake is critical to growth and development. 3 Deficiencies in protein and/or other macronutrients result in failure to attain age-appropriate height and weight. 4 In resource-poor settings, diets limited in high quality or animal protein exacerbate risk of undernutrition. 5 The role of protein in reducing undernutrition is well established, however, studies from the developmental origins of health and disease (DOHaD) perspective suggest that infant protein intake may promote later obesity via its effects on adipocyte differentiation and adipogenesis 6 and the timing of the adiposity rebound. 7,8 In fact, studies from higher-income settings have found independent associations of infant protein intake with later obesity. 5 Reviews of these studies acknowledge convincing evidence 9 that protein intake in early life is positively associated with risk of obesity, but the mechanisms are yet to be confirmed 10.
While protein intake in early life may have these long-term effects on later risk of obesity, the role of proximal protein intake (in adulthood) merits attention as well, since adulthood protein intake also contributes to adulthood obesity risk. Protein may exert beneficial effects on adult metabolic risk by promoting satiety (thus reducing overeating), increasing thermogenesis (which promotes fat metabolism) and improving glucose metabolism. 11,12 In fact, the ‘protein leveraging’ hypothesis stresses that the satiating effects of protein strongly regulate total energy intake and so modifying dietary protein may be one approach to curbing the obesity epidemic. 2,13 The ‘nutrition transition’ refers to the increased consumption of refined carbohydrates and fats that has occurred in recent decades; this transition has diversified diets in several low- and middle- income countries. 14–17 Proponents of the protein leveraging hypothesis suggest that the reduced protein density of these diversified diets may induce overeating to meet daily protein requirements. 2,13
Although a review of the literature yields these important examples of how protein intake may modify obesity risk in an age-dependent manner, no study has fully accounted for the role of dietary protein patterns in modifying obesity risk. When studies focus on protein intakes in distinct time periods, this approach neglects the potential roles of cumulative protein intake patterns across the life course. In light of the rapid westernization of traditional diets worldwide, 17 an individual may experience periods of excess, adequate and insufficient protein intake in a single lifespan. 18,19 It is unclear how combinations of such exposures across the life course may influence adult BMI. Moreover, outside of infancy, other sensitive periods may exist but are yet to be identified, so studying pubescence or adolescence could also grant important insights. 20,21 Thus we employed a life course approach 22,23 to analyze how protein intake affects later body composition. We asked two main questions. First, are there periods of the life course during which protein intake may modify later BMI, fat mass and lean mass? To this end, we estimated how protein intake in early childhood, pubescence, adolescence and young adulthood was associated with later BMI, fat mass and lean mass. We expected that protein intake in early childhood would be positively associated with adulthood BMI and that protein intakes at later ages would be inversely associated with adult BMI, fat mass and lean mass. Second, does life history of protein intake differentially relate to later BMI? We explored how histories of protein intake related to body size in young adulthood. We hypothesized that there would be distinct trajectories of protein intake, and that these trajectories would be differentially associated with BMI, fat mass and lean mass in young adulthood.
Methods
Study population
The Cebu Longitudinal Health and Nutrition Survey (CLHNS) follows a birth cohort of infants born in Cebu, Philippines. 24 Detailed dietary and anthropometric data were collected at bimonthly intervals between birth and 24mo (1983–1986), and in 5 subsequent post-infancy surveys: 1991–92, 1994–95, 1998–99, 2002 and 2005. 24 There were 3080 singleton infants at birth and 1885 individuals in 2005.
Diet
Diet was assessed using twenty-four hour dietary recalls, one recall for each bimonthly survey from birth to 24mo and two recalls for surveys from 11y onwards. The means of the dietary intakes reported at 22 and 24mo were used to estimate usual intake at age 2. Protein intake was estimated using the Filipino food composition tables. 25 Nutrients from breast milk were not quantified, thus dietary data at 22 and 24mo only account for estimated nutrient intake from complementary foods and underestimate total nutrient intake in the 14% infants that were still being breastfed. Analyses presented here include surveys that collected recall data from age 22 and 24mo, 11y, 15y, 19y and 22y. The 1991 survey employed a food frequency questionnaire which systematically overestimated macronutrient intake data and so it was omitted from these analyses.
Primary exposure
The primary exposure was ‘protein relative to needs’; this was the difference between estimated protein intake and the age-specific recommended daily allowance (RDA) of protein in grams/kg body weight. An absolute specification of protein intake would have been inappropriate and misleading since heavier people have greater energy needs and so tend to consume more macronutrients. Our specification of protein intake in grams/kg body weight more appropriately conveys whether a surplus (if positive) or deficit (if negative) of protein intake was consumed relative to individual needs. RDAs for years 2, 11, 15, 19 and 22 were 1.05, 0.95, 0.85, 0.80 and 0.80g/kg body weight respectively. 3
Confounders and key covariates
Statistical models were adjusted for variables that might potentially confound the association of protein intake with later BMI, lean mass and fat mass, given their hypothesized associations with both protein intake and body composition. Models also included variables that were strongly associated with body composition at age 22 to clarify whether observed associations between protein intake trajectories and body composition were independent of these variables. We included sex, factors from the time of the offspring’s birth (offspring weight in kg, maternal education in years and maternal height in cm), factors from early childhood (duration of breastfeeding in months, a household assets score at age 2 and offspring BMI in kg/m2 at age 2) and variables related to the offspring at age 22 (a household assets, physical activity level, education in years, energy intake in 1000kcal units and residuals of carbohydrate and fat intake). The composite score of household assets ranged from 0 to 11 and was based on individual possession of the following: electricity, house, material of house, air conditioner, television, tape recorder, refrigerator, electric fan, jeepneys (customized taxi jeeps), car and clothing iron. Physical activity at age 22 was a binary variable based on normal (600–3000 METS per week) or low (<600 METS per week) reported activity, following the WHO recommendations. 26 We did not include time-varying factors for interim years (ages 11, 15 or 19) either because they were unavailable (physical activity), were presumably on the pathway between protein intake and early adulthood BMI (interim BMI or macronutrients) or had negligible effects on regression coefficients when included (interim asset scores).
Primary Outcome
Body mass index (kg/m2) at age 22 was the primary outcome. Lean mass (kg) and fat mass (kg) at age 22 were secondary outcomes. Weight, height and skinfold thicknesses were measured by trained personnel. Body fat percentage was calculated from skinfold thicknesses using equations validated in Asian populations. 27 Fat mass (kg) was then calculated as % body fat*weight (kg) ; lean mass (kg) was the difference between body weight and fat mass. All three outcomes were stratified by sex and then standardized to the mean for males and females in the sample to aid in interpretability. The kg or kg/m2 equivalents are provided in-text for context. Pregnant women were omitted from all analyses of body composition.
Statistical Analyses
Age-specific protein intake and standardized body mass index, lean mass and fat mass at age 22y
To fulfil the first aim of this study we assessed the association of age-specific protein intakes relative to needs with three measures of body size at 22y using multivariable linear regression analyses. Protein intakes relative to needs at ages 2y, 11y, 15y, 19y and 22y were simultaneously included in the regression models as independent variables. The protein intake variables were not significantly correlated with each other (variance inflation factors < 10). To aid in the interpretation of estimates, we reported changes associated with 20% increases in protein relative to needs- a modest increase that is within the range of realistic dietary changes. (For example, a 20% increase is equivalent to an additional 2 grams of protein (60ml of whole milk) for a 2-year-old who weighs 10kg or an additional 9g of protein (265ml of whole milk) for a 22-year-old who weighs 55kg.) Product terms between sex and protein intake relative to needs were included to assess sex-specific associations. Analyses were adjusted for the above-detailed anthropometric, dietary and socioeconomic covariates. The three outcomes, standardized BMI, standardized lean mass and standardized fat mass, were dependent variables.
Derivation of protein intake trajectories
To meet the second objective of this study, we investigated whether history of protein intake was differentially associated with later BMI. This involved first classifying individuals with similar protein intake trajectories into groups, and then relating trajectory membership to later BMI.
We used finite mixture models to classify the cohort’s heterogeneous patterns of relative protein intake (g/kg body weight) from 2–22y into latent growth curves or trajectories. This statistical approach assumes that individuals classified within the same trajectory have homogenous protein intake, and that their protein intake patterns vary from those of individuals assigned to other trajectories. 29,30
An a priori criterion was established to select the optimal number of trajectories. We considered: i) Parsimony: we would select the simplest number (n) of trajectories needed to describe meaningful patterns in the data and so a 5 trajectory solution would be the largest tested, ii) Reasonable subset sizes: we would reduce the possibility of capturing idiosyncratic or anomalous protein intake patterns 31 by ensuring that trajectories represented at least 3% of the cohort and iii) Bayesian information Criteria (BIC). For a given model with n trajectories, we modeled relative protein intake by specifying cubic, quadratic or linear trajectories. If p values exceeded 0.10 for the higher order term then a lower order model was preferred for the n trajectory model. 32,33 A similar process was used to select the optimal orders for a model with n+1 trajectories. Next, the a priori criterion was used to compare models for n to n+1 trajectories and the final model was selected. Trajectories were derived using the traj command in Stata 14. 29
One-way ANOVA and chi-squared tests were employed to assess whether the distribution of covariate characteristics in early life varied significantly by trajectory membership.
Trajectory of relative protein intake and standardized body mass index, lean mass and fat mass at age 22y
Multivariable linear regression models were then used to estimate the association of the independent variable, protein intake trajectory membership, with the three outcomes (standardized BMI, lean mass and fat mass at age 22y). Product terms between sex and protein intake trajectories were included to elucidate sex-specific associations. Regression models also included the above-described anthropometric, dietary and socioeconomic factors from early life and adulthood. We used post-estimation Wald tests to compare outcomes between trajectories for males and females separately. (For example, we assessed whether the difference between the age 22y BMI of females’assigned to a given trajectory was significantly different from that of females assigned to a referent trajectory.)
We also assessed potential for bias due to attrition by conducting Heckman 28 selection models. These two-stage regression models involve i) using a set of baseline covariates (maternal, household and community-level factors) as independent variables that relate to the outcome of being present in the survey at age 22y and ii) using the independent variables (protein intake variables, interaction terms and confounders) to predict the body size outcome (such as BMI). The model compares residuals from both the selection model and the prediction model, and if residuals are uncorrelated then the potential for selection bias in the standard regression coefficients may be mitigated. We compared coefficients from the Heckman selection models with the standard regression models.
Results
Descriptive demographic and dietary details in the CLHNS
On average, mothers in the CLHNS had received approximately 8y of formal education at the time of the offspring’s birth (Table 1). The sample had a relatively low urbanicity score in early life but, due to migration to more urban areas as well as urbanization of all communities, the sample became more urban by age 22. By age 22y, offspring had spent an average of 11y in formal education, and had a mean BMI that was in the normal weight category. Mean protein intake exceeded the RDAs at every survey. Across all surveys, meat and poultry, seafood and grains accounted for more than 75% of all protein consumed (data not shown). All other protein sources (such as eggs, dairy, legumes and seeds) contributed less than 10% to protein intake.
Table 1.
Mean* of select demographic and dietary characteristics from birth to 22y CLHNS (1983–2005)
| Covariate | Birth | Age 2 | Age 11 | Age 15 | Age 19 | Age 22 |
|---|---|---|---|---|---|---|
| n | 3080 | 2456 | 2181 | 2089 | 2023 | 1888 |
| Maternal education (years) | 7.56 ± 3.72 | |||||
| Maternal height (cm) | 150.56 ± 5.00 | |||||
| Household Assets (range 1–11)** | 2.51 ± 1.94 | 2.65 ± 1.96 | 4.00±2.19 | 4.68±2.17 | 5.17±2.09 | 5.23 ± 2.03 |
| Household Urbanicity (range 0–70) ** | 30.58 ± 12.61 | 28.41 ± 13.69 | 35.97±13.21 | 39.08±13.69 | 41.96±13.84 | 41.04 ± 13.35 |
| Offspring weight (kg) ** | 3.00 ± 0.42 | 9.78 ± 1.23 | 28.46±6.08 | 44.48±7.88 | 49.79±8.69 | 51.62 ± 9.99 |
| Offspring length/height (cm) ** | 49.07±2.07 | 79.15 ± 3.68 | 133.81±7.51 | 153.97±7.81 | 157.15±8.13 | 157.44 ± 8.21 |
| Offspring BMI (kg/m2) ** | 15.56±1.23 | 15.75±2.06 | 18.69±2.48 | 20.11±2.76 | 20.74 ± 3.15 | |
| Offspring lean mass (kg) | 39.36 ± 9.22 | |||||
| Offspring fat mass (kg) | 12.27 ± 5.36 | |||||
| Offspring education (years) | 10.84 ± 3.65 | |||||
| Duration of breastfeeding (months) | 12.39 ± 8.32 | |||||
| Male (%) | 52.99 | |||||
| Energy intake (kcal)** | 713.58± 359.34 | 1719.72± 821.95 | 1587.99± 672.83 | 1871.96± 820.84 | 1940.12± 832.18 | |
| Protein (g/kcal body weight) ** | 2.04± 1.05 | 1.96± 0.96 | 1.10± 0.49 | 1.36± 0.63 | 1.44± 0.67 | |
| Protein (g) ** | 16.94± 8.31 | 54.58± 26.36 | 48.46± 22.03 | 67.01± 31.31 | 73.23± 34.66 | |
| Protein (% of energy intake) | 9.87±3.85 | 13.06±3.46 | 12.37±2.91 | 14.64±3.92 | 15.33±4.25 | |
| Fat (g) ** | 11.80± 14.60 | 24.32± 20.67 | 41.43± 32.30 | 61.11± 45.42 | 51.68± 39.87 | |
| Carbohydrates (g) ** | 127.36± 51.69 | 200.27± 79.47 | 252.37± 101.58 | 259.95± 111.12 | 263.62± 109.31 |
Mean ± SD unless otherwise indicated;
Anova shows that means vary significantly across the survey years shown p<0.05
Age-specific intakes of protein were differentially associated with body composition at age 22
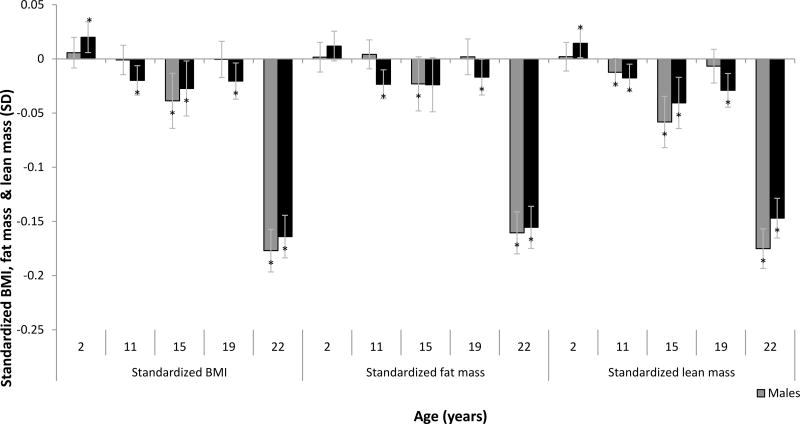
Protein intake was differentially associated with body composition in an age-dependent manner (Figure 1) A 20% higher intake of protein (relative to age-specific recommended daily allowance in g/kg body weight) consumed at age 2 was modestly but positively associated with females’ BMI (Beta [95%CI] 0.020 SD [0.006, 0.033], the equivalent to 0.06kg/m2) and females’ lean mass (0.014 SD [0.001, 0.028] or 0.06kg) at 22y.
Figure 1. Protein intakes relative to needs were differentially associated with fat mass, lean mass and BMI at age 22y in an age-dependent manner in the Cebu Longitudinal Health and Nutrition Survey (CLHNS).
Each bar represents the change in early adulthood standardized BMI, fat mass or lean mass, associated with a 20% increase in protein intake at the indicated age relative to the recommended daily allowance for that age. BMI, fat mass and lean mass at age 22y were standardized to the mean of the sex-stratified sample of the CLHNS. Coefficients were derived from the linear regression of age-specific protein intakes relative to needs on the standardized outcomes and adjusted for characteristics at birth (offspring weight, maternal education and maternal height), characteristics at age 2 (offspring BMI and household assets), characteristics from age 22 (offspring education and assets, physical activity level, carbohydrate residuals, fat residuals and energy intake). *p<0.05
At all other ages, protein intake relative to needs was mostly inversely associated with body composition at age 22; the strength and magnitude of these associations varied with age. The largest of these estimated associations were for protein consumed at age 22y. A 20% higher intake of protein relative to needs was associated with lower lean mass (−0.147SD [−0.165, −0.129] or −0.3kg in females and −0.175SD [−0.197, −0.153] or −0.51kg in males), fat mass (−0.155SD [−0.175, −0.136] or −0.4kg in females and −0.161SD [−0.184, −0.137] or −0.4kg in males) and BMI at 22y (−0.164SD [−0.183, −0.145] or −0.3kg/m2 and −0.177SD [−0.201, −0.153] or −0.3kg/m2 in females and males respectively). The Heckman-corrected findings were similar to these results.
Derivation of protein intake trajectories using latent class growth curve analyses
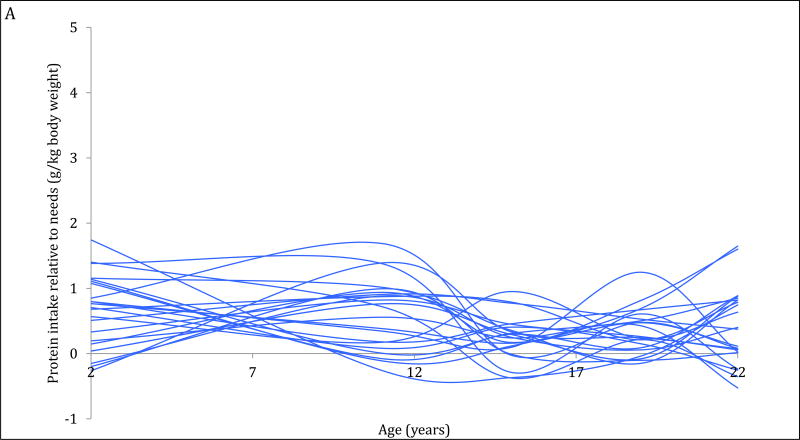
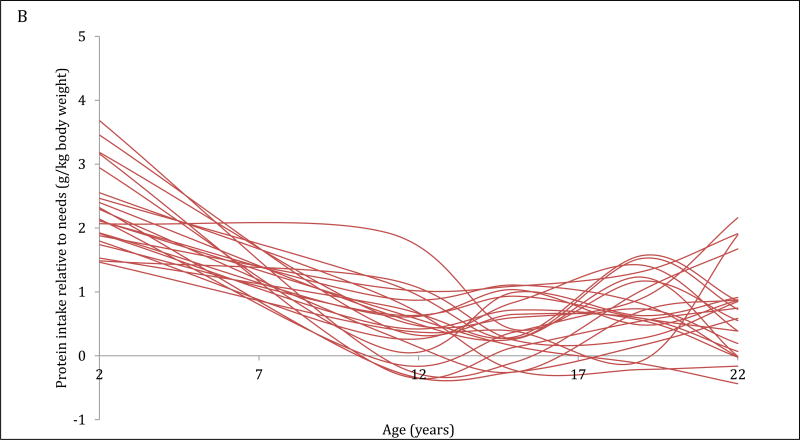
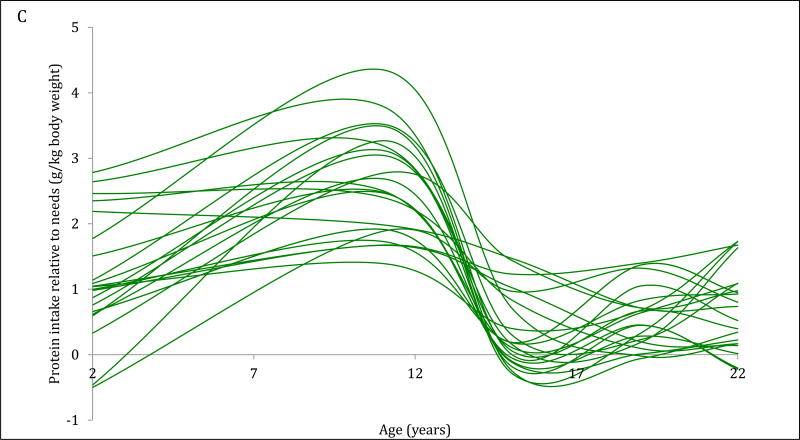
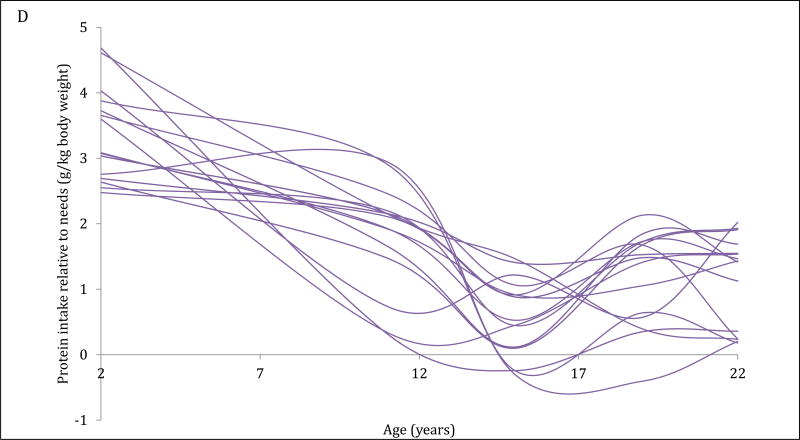
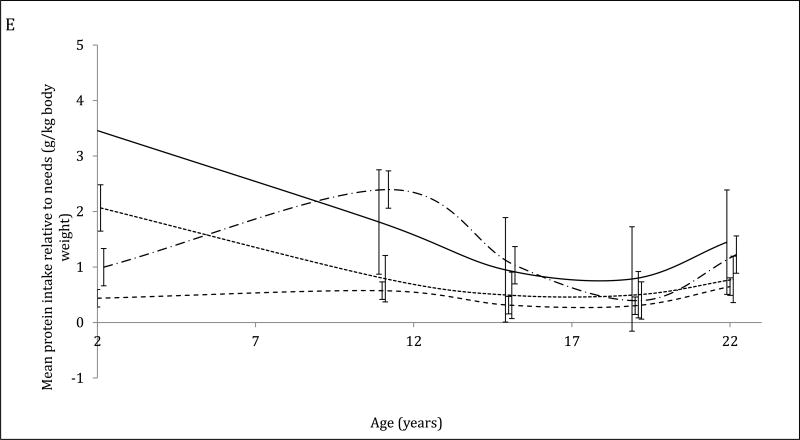
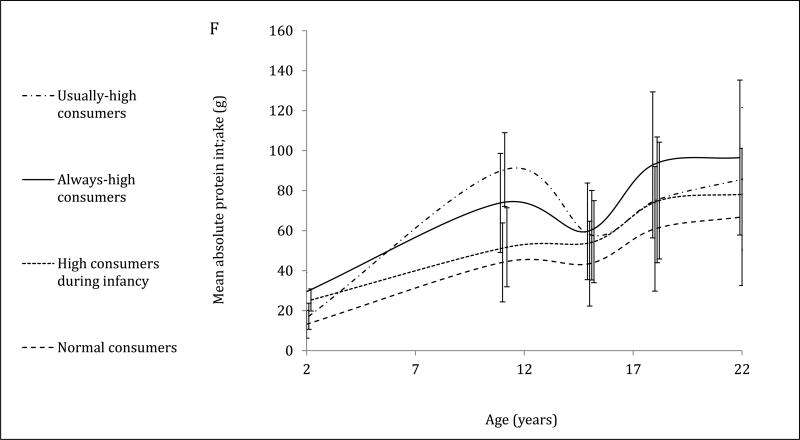
The 4-trajectory model was selected because it had optimal parsimony, interpretability and fit statistics (BIC=−12006.93). Spaghetti plots from random subsets of each trajectory are displayed (Figure 2A–2D). All latent trajectories of mean protein intake for the 2586 individuals in the CLHNS are shown in Figure 2F. The referent trajectory (58% of the sample) was characterized by ‘normal consumers’ whose protein intake was just slightly higher than recommended (Figure 2A). The second trajectory (20%) was characterized by ‘high consumers during infancy’ who tended to exceed the RDA at age 2y but had relatively normal intakes thereafter (Figure 2B). The ‘usually high consumers’ (18%) tended to exceed the RDAs before age 19y, and had markedly high intakes at age 11y (Figure 2C). The smallest trajectory (5%) was characterized by ‘always high consumers’ who had very high protein intakes at age 2y and high protein intakes thereafter (Figure 2D). All mean intakes for derived trajectories exceeded the RDAs (Figure 2E). Although trends were similar for trajectories of absolute protein intake (with normal consumers generally consuming the lowest grams of protein in each survey), the distinctions were not as marked (Figure 2F).
Figure 2. Trajectories of protein intakes relative to needs from 2 to 22 years in the CLHNS (n=2586).
Figures 1A – 1D each show randomly selected spaghetti plots or trajectories of protein intake relative to needs from actual individuals in the Cebu Longitudinal Health and Nutrition Survey. 4 trajectories were derived using latent class growth curve analyses. Figure A shows a subset of the ‘normal consumers’ who constituted 58% of the sample. Figure B are ‘high consumers during infancy’ (20%). Figure C shows ‘usually high consumers’ (18%). Figure D shows ‘always high consumers’ (5%). Figure E shows mean protein intake relative to needs (g/kg body weight) by trajectory with 95% CI. Figure F shows mean absolute protein intakes (g) for those trajectories with standard deviations.
Early life characteristics vary by trajectory
Early life characteristics varied significantly by trajectory (Table 2). ‘Normal consumers’ lived in households with fewer assets at age 2, lived in more rural communities, and had the longest average duration of breastfeeding. Maternal education at baseline was highest for the groups of ‘high consumers during infancy’ and ‘always high’ consumers. The ‘usually high’ consumers had a disproportionately more males while members of ‘always high’ consumers had the lowest mean birth weight and age-2 BMI.
Table 2.
Mean demographic characteristics overall and by trajectory classification
| Trajectory | Maternal education at birth (years) | Maternal height at birth (cm) |
Infant weight at birth (kg) |
Male | BMI at age 2y (kg/m2) |
Assets at age 2y | Urbanicity at age 2 |
Breastfeeding duration (months) |
|---|---|---|---|---|---|---|---|---|
| Overall | 7.51 | 150.63 | 3 | 0.52 | 15.56 | 2.65 | 28.42 | 13.53 |
|
| ||||||||
| Normal consumers | 6.61 | 150.46 | 3.01 | 0.5 | 15.59 | 2.23 | 25.47 | 15.06 |
| High consumers in infancy | 9.26 | 151.17 | 3.01 | 0.5 | 15.59 | 3.46 | 33.27 | 10.6 |
| Usually high consumers | 8.38 | 150.64 | 2.98 | 0.65 | 15.55 | 3 | 32.74 | 12.12 |
| Always high consumers | 10.11 | 150.68 | 2.85 | 0.5 | 15.03 | 3.92 | 34.66 | 8.5 |
|
| ||||||||
| F statistic* | 102.99 | 2.56 | 5.01 | 28.01 | 6.35 | 75.18 | 67.17 | 61.01 |
| p value | <0.001 | 0.053 | 0.002 | <0.001 | <0.001 | <0.001 | <0.001 | <0.001 |
ANOVA for continuous variables or chi-squared test for categorical variables (sex)
Trajectories of protein intake relative to needs are differentially associated with BMI at age 22
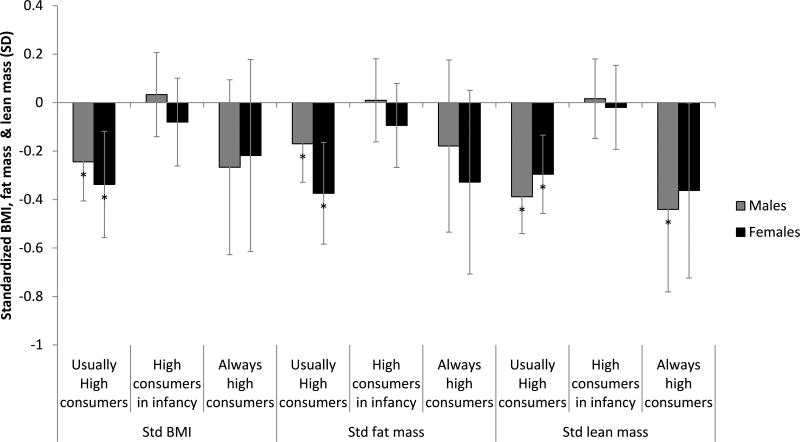
Trajectory membership was differentially associated with body composition at age 22 (Figure 3). Female or male normal consumers served as the referent category in the sex-specific contrasts. ‘Usually high’ consumption was associated with lower BMI (−0.244SD (−0.406, −0.083) equivalent to −1.1kg/m2 and −0.338SD (−0.553, −0.122) or −0.8kg/m2 in males and females respectively). ‘Usually high’ consumption was also associated with lower fat mass −0.170SD (−0.329, −0.011) or −1.7kg and −0.374SD (−0.594, −0.155) or −0.8kg) and lower lean mass −0.388SD (−0.541, −0.236) or −1.7kg and −0.296SD (−0.506, −0.086) or −2.2kg) in males and females respectively. ‘Always high’ consumption was associated with lower lean mass in males (−0.441SD (−0.781, −0.101) or −2.6kg). In both sexes, high consumers during infancy were similar to normal consumers when BMI, lean mass and fat mass at age 22y were compared. Similar inferences were drawn when the analytical sample was restricted to participants with data from at least 3 of 5 protein survey rounds. Inferences from the Heckman-corrected findings were similar to these results, but a significant association did emerge between high protein intake in infancy and both fat mass and BMI in females.
Figure 3. Trajectories of protein intake are differentially associated with BMI, lean mass and fat mass at age 22y in the Cebu Longitudinal Health and Nutrition Survey (CLHNS).
Coefficients are derived from the regression of trajectories of protein intake from age 2 to 22y on standardized BMI, fat mass and lean mass, adjusted for characteristics at birth (offspring weight, maternal education and maternal height), characteristics at age 2 (offspring BMI and household assets), characteristics from age 22 (offspring education and assets, physical activity level, carbohydrate residuals, fat residuals and energy intake). BMI, fat mass and lean mass at age 22y were standardized to the mean of the sex-stratified sample of the CLHNS. Standardized outcomes for one sex in a given trajectory were compared to outcomes for the normal consumer trajectory for that sex. *p<0.05
Discussion
In this study, protein intake from age 2 to 22y had nuanced associations with body composition at age 22y. Early childhood protein intakes were positively associated with later BMI and lean mass in females. However, protein intake from age 11 to 22y tended to be inversely associated with later BMI, lean mass and fat mass. Of the four latent trajectories identified, trajectories marked by high adolescent and adult intakes of protein were associated with lower BMI, lean mass and fat mass at age 22y.
A growing body of literature has associated infant or early childhood protein intake with risk of obesity in later childhood or even adulthood. 5,6,9,34–36 For example, protein intake (g/kcal) from 9–12mo was associated with higher BMI in 6-y-old Icelandic males 37 while high protein intake (g/kcal) in 12-mo-old German males was associated with higher BMI at age 7y. 38 Our current findings lend credence to the early protein- later BMI hypothesis.
However, our analyses differed from prior published studies in several ways. Firstly, published studies conducted associations with BMI and did not include measures of lean or fat mass as we did here; it is unclear whether their associations with BMI also extended to adiposity or lean mass. Our results indicate that early protein was associated with higher female BMI and lean mass, but not fat mass. In this low-income cohort, this could also be interpreted as females who were better nourished in early life being less stunted and underweight as adults. Infant protein intake also programs linear growth, an association potentially mediated by the insulin-like growth factor. 39,40 A recent study in this Cebu cohort did find that childhood protein intakes (grams) were positively associated with attained height at age 22. 41 Since protein is associated with both lean and fat mass, it is important to explicitly investigate whether associations with BMI are due to lean mass, fat mass or both, as we did here.
Secondly, unlike other cohorts in which similar analyses were conducted, this Filipino cohort had high prevalence of infant undernutrition and the infant diet tended to be poor in quality (low in animal protein and rich in energy from grain-based porridges). 42 Differences in protein source and/ or quality presumably drive the associations of protein intake with height 39 and body size. 38 We recently showed that even within CLHNS, associations between protein intake and concurrent BMI vary for protein from animal and plant sources. 43 The dietary differences in our cohort may have contributed to the null associations observed for early protein intake with later BMI, lean mass and fat mass in males, and fat mass in females.
We also found that protein intakes (from ages 11–22) were strongly and inversely associated with lean mass, fat mass and BMI in both sexes. A study in a German cohort reported positive associations of animal protein intake around the adiposity rebound and men’s adulthood fat-free mass. 44 (During infancy, BMI tends to increase during the first year of life, then decline until age 3–5y, after which it ‘rebounds’- the adiposity rebound is this increase in BMI following the minimal point or nadir seen in the BMI growth charts of children.) Since the CLHNS was not conducted during this period, we are unable to directly compare results with this study. Nevertheless, in this same German cohort, protein intake after infancy tended to be positively associated with later lean mass: tertiles of pubertal (between 9–15y) energy-adjusted animal protein intake were associated with higher women’s fat-free mass at 18–25y. 44 These findings contradict ours. Differences in diet quality may again help to explain why our findings vary. Additionally, we expressed protein in grams/kg body weight and this specification may also explain why the results were not fully concordant with prior studies that expressed protein intake in absolute grams or percentiles. Future studies should clarify how protein relative to needs, absolute protein intake as well as protein quality relates to later adulthood body size.
Our trajectory analyses also suggest that adolescent and adult intakes drove differences in body composition: trajectories characterized by higher protein intakes at age 22y were consistently associated with lower BMI, fat mass and lean mass but body composition of the high infant trajectory was similar to the normal consumption category. The estimated age-specific association of the early childhood diet with adult body size was relatively much smaller in magnitude compared to later years. Indeed, the Heckman-weighted, inverse associations that emerged between the trajectory of high protein intake in infancy and fat mass and BMI in females conflict the early protein hypothesis. Future studies should account for diet throughout the life course, so the relative contribution of protein intake at different ages to later body size is not missed.
These findings must be contextualized within the greater limitations of this study. Firstly, since this study was conducted in an observational cohort, the findings presented here are associational and are not causal. We attempted to control for factors that were related to the protein intake variables and body size outcomes but it is possible that omitted factors (such as the quality or source of protein) or poorly measured confounders may leave our estimates residually confounded. Secondly, in this rapidly urbanizing society, the study sample decreased from 3080 at birth, to 2456 individuals at 24mo and 1885 participants at 22y. (14) We found that Heckman-corrected findings were generally similar to the results reported here. Nevertheless, there is still potential for selection bias if participants and those who were lost to follow up varied based on unmeasured factors.
The third limitation is that we were unable to include dietary data from birth to 2y. The inclusion of infant intakes would have facilitated comparisons with other DOHaD studies of the early protein hypothesis. Since breast milk nutrients were not quantified, the use of infant nutrient data would have underestimated total protein intake. Dietary data from infancy and around the adiposity rebound may have improved trajectory derivation and strengthened these life course analyses. Finally, the latent class trajectories derived here are driven by the unique socioeconomic and dietary characteristics of this population. While the insights are valuable, they may not be generalizable to other populations.
Despite its limitations, this is an important methodological contribution to the life course epidemiology literature. Ours is one of few studies to classify longitudinal dietary exposures and relate them to later health. Only one other study has analyzed trajectories of dietary protein; in this German cohort, researchers classified individuals into trajectories of below/above the median protein intakes at ages 12 and 18–24mo. They found that high protein intake at both time points was associated with significantly greater standardized BMI and percentage body fat at age 7y. (29) Although this study captured the early life exposures that we were unable to include here, the crude derivation of trajectories, short follow-up period and childhood outcome clearly limit its generalizability. To our knowledge, only one other study has analyzed a macronutrient across such a wide breadth of the life course: researchers used cluster analysis to isolate fat intake patterns from 2–18y in a German cohort 45 ; they later found that these patterns did not explain later BMI. 46 Another study of Chinese adults used latent class trajectory analysis to group individuals according to a dietary pattern score, they found that those with healthier dietary patterns had lower hemoglobin A1c, and when trajectories with recent healthy dietary patterns were compared, those who had prolonged recent exposure to a healthy dietary pattern had lower hemoglobin A1c compared to those who whose trajectory showed recent improvements in dietary pattern. 47 These longitudinal perspectives grant insights into the potentially cumulative role of diet in later health. The novelty of our study is that we were able to demonstrate how both varied patterns of protein intake and period-specific exposures were associated with later body composition within a single cohort.
Overall, our study supports long-term associations of protein intake with late BMI. However, more research is needed to clarify whether these associations are also present in other socioeconomic contexts. Analysis of comprehensive dietary data from multiple time points and longer follow-up periods would further identify optimal ranges of age-specific protein intake for promoting later health and disease.
Acknowledgments
We express gratitude for the assistance of Dr. Barry Popkin and Dr. Allison Aiello for their insights throughout this project.
Sources of funding: Howard Hughes Medical Institute International Student Research Fellowship.
Footnotes
Supplemental online material: None
Conflicts of interest: None
Author contributions: MW formulated the research questions, designed the study, analysed the data and wrote the article; LA provided the databases necessary; MAM, DS-A and LA provided guidance in the analysis of data, the interpretation of findings and the critical revision of the manuscript; LA was responsible for the final content. All authors read and approved the final manuscript.
References
- 1.Barker DJP. The origins of the developmental origins theory. J Intern Med. 2007;261(5):412–417. doi: 10.1111/j.1365-2796.2007.01809.x. [DOI] [PubMed] [Google Scholar]
- 2.Simpson SJ, Raubenheimer D. Obesity: the protein leverage hypothesis. Obesity Reviews. 2005;6(2):133–142. doi: 10.1111/j.1467-789X.2005.00178.x. [DOI] [PubMed] [Google Scholar]
- 3.Dietary Reference Intakes for Energy, Carbohydrate, Fiber, Fat, Fatty Acids, Cholesterol, Protein, and Amino Acids (Macronutrients) MyiLibrary Ltd; 2005. [DOI] [PubMed] [Google Scholar]
- 4.Brabin B, Coulter J. Manson's tropical diseases. London: Saunders; 2003. Nutrition-associated disease; pp. 561–580. [Google Scholar]
- 5.Michaelsen KF, Larnkjær A, Mølgaard C. Amount and quality of dietary proteins during the first two years of life in relation to NCD risk in adulthood. Nutrition, metabolism, and cardiovascular diseases : NMCD. 2012;22(10):781–786. doi: 10.1016/j.numecd.2012.03.014. [DOI] [PubMed] [Google Scholar]
- 6.Koletzko B, Broekaert I, Demmelmair H, Franke J, Hannibal I, Oberle D, et al. Protein Intake in the First Year of Life: A Risk Factor for Later Obesity?: The EU Childhood Obesity Project. Dordrecht: Springer Netherlands; 2005. pp. 69–79. [DOI] [PubMed] [Google Scholar]
- 7.Rolland-Cachera MF, Deheeger M, Maillot M, Bellisle F. Early adiposity rebound: causes and consequences for obesity in children and adults. Int J Obes. 2006;30(S4):S11–S17. doi: 10.1038/sj.ijo.0803514. [DOI] [PubMed] [Google Scholar]
- 8.Rolland-Cachera MF, Deheeger M, Akrout M, Bellisle F. Influence of macronutrients on adiposity development: A follow up study of nutrition and growth from 10 months to 8 years of age. Int J Obes. 1995;19(8):573–578. [PubMed] [Google Scholar]
- 9.Hörnell A, Lagström H, Lande B, Thorsdottir I. Protein intake from 0 to 18 years of age and its relation to health: a systematic literature review for the 5th Nordic Nutrition Recommendations. Food & nutrition research. 2013;57:1–42. doi: 10.3402/fnr.v57i0.21083. [DOI] [PMC free article] [PubMed] [Google Scholar]
- 10.Lind MV, Larnkjaer A, Molgaard C, Michaelsen KF. Dietary protein intake and quality in early life: impact on growth and obesity. Curr Opin Clin Nutr Metab Care. 2017 Jan;20(1):71–76. doi: 10.1097/MCO.0000000000000338. [DOI] [PubMed] [Google Scholar]
- 11.Westerterp-Plantenga MS. Protein intake and energy balance. Regul Pept. 2008;149(1):67–69. doi: 10.1016/j.regpep.2007.08.026. [DOI] [PubMed] [Google Scholar]
- 12.Pesta DH, Samuel VT. A high-protein diet for reducing body fat: mechanisms and possible caveats. Nutrition & metabolism. 2014;11(1):53–53. doi: 10.1186/1743-7075-11-53. [DOI] [PMC free article] [PubMed] [Google Scholar]
- 13.Simpson SJ, Batley R. Geometric analysis of macronutrient intake in humans: the power of protein? Appetite. 2003;41(2):123–140. doi: 10.1016/s0195-6663(03)00049-7. [DOI] [PubMed] [Google Scholar]
- 14.Drewnowski A, Popkin BM. The nutrition transition: new trends in the global diet. Nutr Rev. 1997;55(2):31–43. doi: 10.1111/j.1753-4887.1997.tb01593.x. [DOI] [PubMed] [Google Scholar]
- 15.Popkin BM. Urbanization, Lifestyle Changes and the Nutrition Transition. World Dev. 1999;27(11):1905–1916. [Google Scholar]
- 16.Popkin BM, Gordon-Larsen P. The nutrition transition: worldwide obesity dynamics and their determinants. Int J Obes. 2004;28(S3):S2–S9. doi: 10.1038/sj.ijo.0802804. [DOI] [PubMed] [Google Scholar]
- 17.Popkin BM, Adair LS, Ng SW. Global nutrition transition and the pandemic of obesity in developing countries. Nutr Rev. 2012;70(1):3–21. doi: 10.1111/j.1753-4887.2011.00456.x. [DOI] [PMC free article] [PubMed] [Google Scholar]
- 18.Abdullah A. The Double Burden of Undernutrition and Overnutrition in Developing Countries: an Update. Current obesity reports. 2015;4(3):337. doi: 10.1007/s13679-015-0170-y. [DOI] [PubMed] [Google Scholar]
- 19.Tzioumis E, Adair L. Childhood dual burden of under- and overnutrition in low- and middle-income countries: A critical review. Food & nutrition bulletin. 2014;35(2):230–243. doi: 10.1177/156482651403500210. [DOI] [PMC free article] [PubMed] [Google Scholar]
- 20.Schooling C. Life course epidemiology: recognising the importance of puberty. J Epidemiol Community Health. 2015;69(8):820–820. doi: 10.1136/jech-2015-205607. [DOI] [PubMed] [Google Scholar]
- 21.Viner R, Ross D, Hardy R, Kuh D, Power C, Johnson A, et al. Life course epidemiology: recognising the importance of adolescence. J Epidemiol Community Health. 2015;69(8):719–720. doi: 10.1136/jech-2014-205300. [DOI] [PMC free article] [PubMed] [Google Scholar]
- 22.Darnton-Hill I, Nishida C, James W. A life course approach to diet, nutrition and the prevention of chronic diseases. Public Health Nutr. 2004;7(1a):101–121. doi: 10.1079/phn2003584. [DOI] [PubMed] [Google Scholar]
- 23.Ben-Shlomo Y, Kuh D. A life course approach to chronic disease epidemiology: conceptual models, empirical challenges and interdisciplinary perspectives. Int J Epidemiol. 2002;31(2):285–293. [PubMed] [Google Scholar]
- 24.Adair LS, Hindin MJ, Popkin BM, Akin JS, Guilkey DK, Gultiano SA, et al. Cohort profile: the Cebu longitudinal health and nutrition survey. Int J Epidemiol. 2011;40(3):619–625. doi: 10.1093/ije/dyq085. [DOI] [PMC free article] [PubMed] [Google Scholar]
- 25.Food and Nutrition Research Institute of the Philippines (FNRI) Food composition tables. Department of Science and Technology (DOST); Manila, Philippines: 1980. [Google Scholar]
- 26.World Health Organization. Global physical activity questionnaire (GPAQ) analysis guide. Geneva: World Health Organization; 2012. [Google Scholar]
- 27.Deurenberg P, Deurenberg-Yap M. Validity of body composition methods across ethnic population groups. Acta Diabetol. 2003;40(S1):s246–s249. doi: 10.1007/s00592-003-0077-z. [DOI] [PubMed] [Google Scholar]
- 28.Heckman JJ. Sample selection bias as a specification error (with an application to the estimation of labor supply functions) 1977. [Google Scholar]
- 29.Jones BL, Nagin DS. A Note on a Stata Plugin for Estimating Group-based Trajectory Models. Sociological Methods & Research. 2013;42(4):608–613. [Google Scholar]
- 30.Nagin DS. Analyzing Developmental Trajectories: A Semiparametric, Group-Based Approach. Psychol Methods. 1999;4(2):139–157. doi: 10.1037/1082-989x.6.1.18. [DOI] [PubMed] [Google Scholar]
- 31.Louvet B, Gaudreau P, Thompson A, Carraro N, Andruff H. Latent Class Growth Modelling: A Tutorial. Tutorials in Quantitative Methods for Psychology. 2009;5(1):11–24. [Google Scholar]
- 32.Jones BL, Nagin DS, Roeder K. A SAS Procedure Based on Mixture Models for Estimating Developmental Trajectories. Sociological Methods & Research. 2001;29(3):374–393. [Google Scholar]
- 33.Jones BL. [Accessed Jan/12, Accessed 2016];Traj group-based modeling of longitudinal data. 2005 Available at: https://www.andrew.cmu.edu/user/bjones/index.htm.
- 34.Koletzko B, Dobrzanska A, Sengier A, Langhendries J, Rolland Cachera M, Grote V, et al. Lower protein in infant formula is associated with lower weight up to age 2 y: a randomized clinical trial. Am J Clin Nutr. 2009;89(6):1836–1845. doi: 10.3945/ajcn.2008.27091. [DOI] [PubMed] [Google Scholar]
- 35.Weber M, Grote V, Closa-Monasterolo R, Escribano J, Langhendries J, Dain E, et al. Lower protein content in infant formula reduces BMI and obesity risk at school age: follow-up of a randomized trial. Am J Clin Nutr. 2014;99(5):1041–1051. doi: 10.3945/ajcn.113.064071. [DOI] [PubMed] [Google Scholar]
- 36.Pimpin L, Jebb S, Johnson L, Wardle J, Ambrosini GL. Dietary protein intake is associated with body mass index and weight up to 5 y of age in a prospective cohort of twins. Am J Clin Nutr. 2016 Feb;103(2):389–397. doi: 10.3945/ajcn.115.118612. [DOI] [PMC free article] [PubMed] [Google Scholar]
- 37.Gunnarsdottir I, Thorsdottir I. Relationship between growth and feeding in infancy and body mass index at the age of 6 years. Int J Obes. 2003;27(12):1523–1527. doi: 10.1038/sj.ijo.0802438. [DOI] [PubMed] [Google Scholar]
- 38.Günther ALB, Remer T, Kroke A, Buyken AE. Early protein intake and later obesity risk: Which protein sources at which time points throughout infancy and childhood are important for body mass index and body fat percentage at 7 y of age? Am J Clin Nutr. 2007;86(6):1765–1772. doi: 10.1093/ajcn/86.5.1765. [DOI] [PubMed] [Google Scholar]
- 39.Hoppe C, Udam TR, Lauritzen L, Mølgaard C, Juul A, Michaelsen KF. Animal protein intake, serum insulin-like growth factor I, growth in healthy 2.5-y-old Danish children. Am J Clin Nutr. 2004;80(2):447–452. doi: 10.1093/ajcn/80.2.447. [DOI] [PubMed] [Google Scholar]
- 40.Putet G, Labaune J, Mace K, Steenhout P, Grathwohl D, Raverot V, et al. Effect of dietary protein on plasma insulin-like growth factor-1, growth, and body composition in healthy term infants: a randomised, double-blind, controlled trial (Early Protein and Obesity in Childhood (EPOCH) study) Br J Nutr. 2016;115(02):271–284. doi: 10.1017/S0007114515004456. [DOI] [PMC free article] [PubMed] [Google Scholar]
- 41.Bhargava A. Protein and Micronutrient Intakes Are Associated with Child Growth and Morbidity from Infancy to Adulthood in the Philippines. J Nutr. 2016;146(1):133. doi: 10.3945/jn.115.222869. [DOI] [PubMed] [Google Scholar]
- 42.Wright MJ, Bentley M, Mendez M, Adair L. The interactive association of dietary diversity scores and breast-feeding status with weight and length in Filipino infants aged 6–24 months. Public Health Nutr. 2015;18(10):1762–1773. doi: 10.1017/S1368980015000427. [DOI] [PMC free article] [PubMed] [Google Scholar]
- 43.Wright M, Mendez MA, Sotres-Alvarez D, Adair L. Breastfeeding and Protein Intake Influence Body Mass Index from 2 Months to 22 Years in the Cebu Longitudinal Health and Nutrition Survey. J Nutr. 2016 Oct;146(10):2085–2092. doi: 10.3945/jn.116.232470. [DOI] [PMC free article] [PubMed] [Google Scholar]
- 44.Assmann KE, Joslowski G, Buyken AE, Cheng G, Remer T, Kroke A, et al. Prospective association of protein intake during puberty with body composition in young adulthood. Obesity (Silver Spring, Md) 2013;21(12):E782–E789. doi: 10.1002/oby.20516. [DOI] [PubMed] [Google Scholar]
- 45.Alexy U, Schultze-Pawlitschko V, Sichert-Hellert W, Kersting M. Cluster analysis of individuals with similar trends of fat intake during childhood and adolescence: a new approach to analyzing dietary data. Nutr Res. 2005;25(3):251–260. [Google Scholar]
- 46.Alexy U, Sichert-Hellert W, Kersting M, Schultze-Pawlitschko V. Pattern of long-term fat intake and BMI during childhood and adolescence-results of the DONALD Study. Int J Obes. 2004;28(10):1203–1209. doi: 10.1038/sj.ijo.0802708. [DOI] [PubMed] [Google Scholar]
- 47.Batis C, Mendez MA, Sotres-Alvarez D, Gordon-Larsen P, Popkin B. Dietary pattern trajectories during 15 years of follow-up and HbA1c, insulin resistance and diabetes prevalence among Chinese adults. J Epidemiol Community Health. 2014 Aug;68(8):773–779. doi: 10.1136/jech-2013-203560. [DOI] [PMC free article] [PubMed] [Google Scholar]


