Abstract
For a complete understanding of biochemical reactions, information on complex stoichiometry is essential. However, measuring stoichiometry is experimentally challenging. Our lab has developed a FRET-based assay to study protein complex stoichiometry in vitro. This assay, also known as Job plot, is set up as a continuous variation of the molar ratio between the two species, kept at constant total concentration. The FRET (Fluorescence Resonance Energy Transfer) between the two fluorescently-labeled proteins is measured and the stoichiometry is inferred from the sample with highest FRET signal. This approach allows us to assess complex stoichiometry in solution.
Keywords: Stoichiometry, FRET, Histones, Fluorescence, Complex formation, Job plot
Background
Each biochemical reaction requires the interaction between two or more cellular components. The stoichiometry of these interactions is an important factor that regulates biochemical reactions in the cell. Experimental determination of complex stoichiometry is therefore critical to fully understand the biochemical and biophysical processes at work within cells.
Measuring stoichiometry has been experimentally challenging. For the interaction between large particles that lead to dramatic molecular weight changes, stoichiometry can be inferred by low-resolution structural analysis. These approaches include size-exclusion chromatography, multi-angle light scattering, analytical ultracentrifugation, which are techniques capable of providing accurate molecular weights of the particles. However, these methods require a considerable amount of material and are prone to error when small molecular weight changes are to be observed.
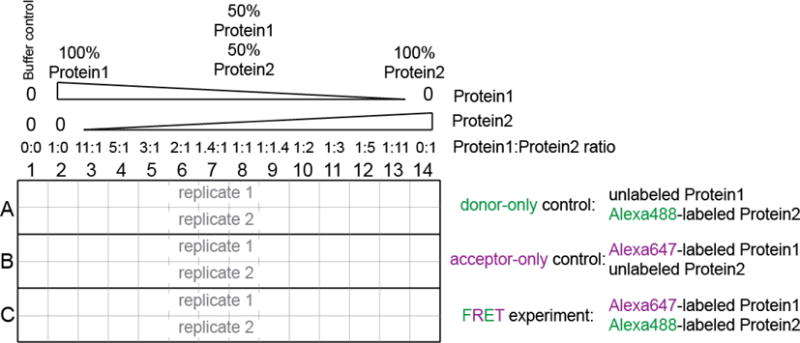
We have optimized an assay to measure complex stoichiometry in solution based on FRET (Fluorescence Resonance Energy Transfer). This assay, also known as Job plot (Huang, 1982) can be carried out with considerably less material and it is suitable for studying any complex formation, independent on the size of the two components. In this assay, samples are kept at constant total protein concentration, but with continuous variation of the molar ratio between the two components (Figure 1). The sample with the functional stoichiometry of the complex will display the highest FRET signal.
Figure 1. Experimental setup.

See also Supplemental file 1.
This is a powerful method that enables measurements of complex stoichiometry in solution and among components of any size. Because FRET measurements require both components of the complex to be fluorescently-labeled, a variety of controls are required to exclude potential artifact of the labeling procedure. Ideally single site labeling is advisable in this assay (D’Arcy et al., 2013; Mattiroli et al., 2017), but this is not always possible, as the protein structure may not be known for the components. We suggest performing functional assays with the labeled protein to confirm that the fluorophores do not alter its properties.
Materials and Reagents
Low retention pipette tips (USA Scientific)
PCR tubes (USA Scientific, catalog number: 1402-4308)
384-well assay plate (Corning, catalog number: 3575)
PD-10 column (GE Healthcare, catalog number: 52130800)
Amicon Ultra centrifugal filter units, Ultra-15, MWCO 10 kDa (Merck, catalog number: UFC901008)
Unlabeled refolded H3-H4 (procedures explained in Dyer et al., 2004)
Histone-binding protein (defined as Protein1 in this protocol)
Alexa488-labeled refolded H3-H4 (procedures explained in Muthurajan et al., 2016) (Protein2)
-
Atto647N maleimide (Sigma-Aldrich, catalog number: 05316-1MG-F)
Note: Store at −20 °C in DMSO at 10 mM concentration.
Dithiothreitol (DTT) (Gold Biotechnology, catalog number: DTT50)
Tris pH 7.5 (Fisher Scientific, catalog number: BP152-5)
Sodium chloride (NaCl) (Fisher Scientific, catalog number: S271-10)
EDTA (Fisher Scientific, catalog number: BP120-1)
TCEP (Gold Biotechnology, catalog number: TCEP10)
Nonidet P-40 (NP-40) (Sigma-Aldrich, catalog number: 74385)
CHAPS (Sigma-Aldrich, catalog number: C3023)
1 M dithiothreitol (DTT; see Recipes)
PD-10 buffer (see Recipes)
Binding buffer (see Recipes)
Equipment
Pipettes (Gilson)
Plate reader (BMG LABTECH, model: CLARIOstar)
Centrifuge with plate adapter (Beckman Coulter, model: Allegra® X-22R, rotor: Beckman Coulter, model: S2096)
Software
Excel Software
Procedure
A. Fluorescence labeling of the histone-binding protein
In a minimum reaction volume of 400 μl, mix 10 μM of histone-binding protein with 10 μM of Atto647N maleimide dye, in PD-10 buffer. Rotate gently at 4 °C for 1 h. Protect the reaction from light.
Quench the reaction with a final concentration of 10 mM DTT (see Recipes).
Dilute the sample to 2 ml and apply it to a PD-10 column. Elute with 3.5 ml of PD-10 buffer (see Recipes). This step removes unconjugated dye from the solution.
Concentrate the labeled protein to ~20 μM using Amicon Ultra (spinning at 3,500 × g at 4 °C) and store at 4 °C. Use within 2 days and freshly label a new aliquot for subsequent repeats of the assay.
Protein function should always be validated after labeling with fluorescence dyes. This includes confirming that the labeled protein still binds to its partner with the same affinity.
B. Assay design
Reactions are set up in duplicate
Each well contains a 40 μl reaction.
Always include unlabeled controls as specified in Figure 1.
Supplementary file 1 contains the worksheet for sample preparation.
-
The total protein concentration in each well should remain constant, and should be at least 10 times higher than the binding constant (Kd) of the interaction between the two components. The relative molar ratio between the two components varies continuously.
In the example in Supplementary file 1: the Kd is ~1 nM, hence we keep the total protein concentration in each tube at 150 nM.
This means that in column 2, we have 150 nM Protein1 (i.e., Histone-binding protein), and in column 14 we have 150 nM Protein2 (i.e., H3-H4), while in column 8 we have 75 nM Protein1 (i.e., Histone-binding protein) and 75 nM Protein2 (i.e., H3-H4).
C. Assay preparation
Prepare 1 μM stock of each protein, labeled and unlabeled.
Use the worksheet attached to prepare the stock solutions. These are prepared at twice the protein concentration required in the well reactions.
Final well reactions are prepared by mixing 20 μl of Protein1 solution with 20 μl of Protein2 solution, leading to the desired final protein concentration, as they are diluted two-fold in this step.
Mix well by pipetting, but avoid forming bubbles.
Spin down the plate at 100 × g (RCF: relative centrifugal force) for 1 min.
D. Data collection
The fluorescence intensity is measured in a CLARIOstar machine (BMG labtech) using the following settings:
- Measure acceptor fluorescence:
- Excitation wavelength-bandwidth: 625-30 nm;
- Emission wavelength-bandwidth: 680-30 nm;
- Dichroic: automatic;
- Gain settings for this channel are adjusted automatically using the sample in wells B2, with highest acceptor dye concentration and no donor dye present.
- Measure FRET:
- Excitation wavelength-bandwidth: 488-15 nm;
- Emission wavelength-bandwidth: 680-30 nm;
- Dichroic: automatic;
- Gain settings for this channel are not adjusted at first, when an average value is used to gauge the region of highest FRET. Further measurements are repeated at different gain settings to confirm the sample with highest FRET and then this sample (in our example well C8) is used for the final automatic adjustment and measurement.
- Measure donor fluorescence:
- Excitation wavelength-bandwidth: 488-15 nm;
- Emission wavelength-bandwidth: 535-30 nm;
- Dichroic: automatic;
- Gain settings for this channel are adjusted automatically using the sample in wells A14, with highest donor dye concentration and no acceptor dye present.
- The plate-reader software will output the raw data in Excel format.
Data analysis
Data analysis to calculate the corrected FRET signal is performed as described in Hieb et al. (2012) and Winkler et al. (2012). We attached an example analysis file (Supplemental file 2). In summary:
Perform buffer subtraction, as done in R1-AD29 in the attached analysis file (Supplemental file 2). Subtract the average intensity of the Buffer only samples (column 1) from each control and experimental measurement.
Calculate donor bleed-through intensity, as done in Q-AD35 in the attached analysis file. Calculate the ratio between the FRET intensity in the sample where only the donor dye is present (row A) and the donor fluorescence intensity in the same sample. Average the values obtained in the two replicates.
Calculate acceptor direct excitation intensity, as done in Q-AD37 in the attached analysis file. Calculate the ratio between the FRET intensity in the sample where only the acceptor dye is present (row B) and the acceptor fluorescence intensity in the same sample. Average the values obtained in the two replicates.
- Calculate the corrected FRET, as done in Q-AD39 and Q-AD40 in the attached analysis file. This is equal to:
- Measured FRET in the samples containing both dyes (row C)–donor bleed-through *donor signal in the same sample–acceptor direct excitation *acceptor signal in the same sample.
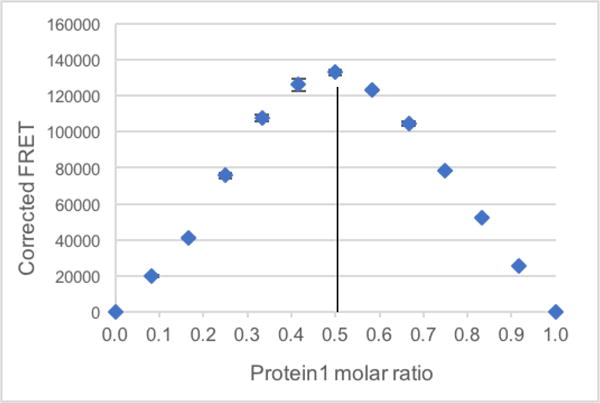
- The average of the corrected FRET from the two replicates is plotted with the Standard deviation (Figure 2).
- The stoichiometry is indicated by the sample with the highest FRET signal.
- In this case, the sample with Protein1 molar ratio 0.5, meaning with a 1:1 ratio of Protein1 and Protein2 has the highest measured FRET, suggesting that the complex between these two proteins contains one equivalent of each protein.
Figure 2.

Example plot of corrected FRET intensity
Notes
Previous knowledge of the binding affinity (Kd) of the two binding partners is required for the proper setup of the experiment and accurate interpretation of the results.
Other validated FRET pairs can be used with the described experimental setup.
Recipes
- 1 M dithiothreitol (DTT)
- Dissolve 0.15425 g of DTT powder into 1 ml of ddH2O
- Resuspend by vortexing and store at −20 °C for maximum 2 weeks
- PD-10 buffer
- 20 mM Tris pH 7.5 (pH measured at room temperature)
- 300 mM NaCl
- 1 mM EDTA
- 1 mM TCEP
- Binding buffer
- 20 mM Tris pH 7.5 (pH measured at room temperature)
- 300 mM NaCl
- 0.01% NP-40
- 0.01% CHAPS
- 1 mM EDTA
- 1 mM TCEP
Supplementary Material
Acknowledgments
This protocol was adapted from D’Arcy et al., 2013. F.M. is funded by EMBO (ALTF 1267-2013) and the Dutch Cancer Society (KWF 2014-6649). Research in the Luger lab is funded by the Howard Hughes Medical Institute and NIH (GM067777). The authors declare no conflicts of interest or competing interests.
References
- D’Arcy S, Martin KW, Panchenko T, Chen X, Bergeron S, Stargell LA, Black BE, Luger K. Chaperone Nap1 shields histone surfaces used in a nucleosome and can put H2A-H2B in an unconventional tetrameric form. Mol Cell. 2013;51(5):662–677. doi: 10.1016/j.molcel.2013.07.015. [DOI] [PMC free article] [PubMed] [Google Scholar]
- Dyer PN, Edayathumangalam RS, White CL, Bao Y, Chakravarthy S, Muthurajan UM, Luger K. Reconstitution of nucleosome core particles from recombinant histones and DNA. Methods Enzymol. 2004;375:23–44. doi: 10.1016/s0076-6879(03)75002-2. [DOI] [PubMed] [Google Scholar]
- Hieb AR, D’Arcy S, Kramer MA, White AE, Luger K. Fluorescence strategies for high-throughput quantification of protein interactions. Nucleic Acids Res. 2012;40:e33. doi: 10.1093/nar/gkr1045. [DOI] [PMC free article] [PubMed] [Google Scholar]
- Huang CY. Determination of binding stoichiometry by the continuous variation method: the Job plot. Methods Enzymol. 1982;87:509–525. doi: 10.1016/s0076-6879(82)87029-8. [DOI] [PubMed] [Google Scholar]
- Mattiroli F, Gu Y, Yadav T, Balsbaugh JL, Harris MR, Findlay ES, Liu Y, Radebaugh CA, Stargell LA, Ahn NG, Whitehouse I, Luger K. DNA-mediated association of two histone-bound complexes of yeast Chromatin Assembly Factor-1 (CAF-1) drives tetrasome assembly in the wake of DNA replication. Elife. 2017:6. doi: 10.7554/eLife.22799. [DOI] [PMC free article] [PubMed] [Google Scholar]
- Muthurajan U, Mattiroli F, Bergeron S, Zhou K, Gu Y, Chakravarthy S, Dyer P, Irving T, Luger K. In vitro chromatin assembly: Strategies and quality control. Methods Enzymol. 2016;573:3–41. doi: 10.1016/bs.mie.2016.01.002. [DOI] [PMC free article] [PubMed] [Google Scholar]
- Winkler DD, Luger K, Hieb AR. Quantifying chromatin-associated interactions: the HI-FI system. Methods Enzymol. 2012;512:243–274. doi: 10.1016/B978-0-12-391940-3.00011-1. [DOI] [PubMed] [Google Scholar]
Associated Data
This section collects any data citations, data availability statements, or supplementary materials included in this article.


