

Abstract
IMPORTANCE
Although the risk of type 2 diabetes is considered to be equivalent to coronary heart disease (CHD) risk, there is considerable heterogeneity among individuals for CHD and atherosclerotic cardiovascular disease (ASCVD) risk. It is not known whether coronary artery calcium (CAC) assessment at baseline in individuals with established metabolic syndrome (MetS) or diabetes identifies CHD and ASCVD prognostic indicators during a long follow-up period.
OBJECTIVE
To compare improvement in long-term prognostication of incident CHD and ASCVD using CAC scores among those with diabetes, MetS, or neither condition.
DESIGN, SETTING, AND PARTICIPANTS
This study included participants from the Multi-Ethnic Study of Atherosclerosis (MESA), a prospective cohort study of 6814 males and females aged 45 to 84 years without known CVD from 4 race/ethnicity groups (white [38.5%], African American [27.5%], Hispanic [22.1%], and Chinese [11.9%]) recruited from 6 US communities from July 2000 through August 2002. Follow-up for each participant extended to the first occurrence of an incident event, other death, loss to follow-up, or the last follow-up call through December 31, 2013. Data analysis was performed from June 1, 2016, to September 12, 2017. Cox proportional hazards regression models were used to estimate hazard ratios (HRs). Area under the receiver operator characteristic curve and net reclassification improvement were used to compare incremental contributions of CAC score when added to the Framingham risk score, ethnicity/race, and socioeconomic status.
MAIN OUTCOMES AND MEASURES
CHD events, including myocardial infarction, resuscitated cardiac arrest, or CHD death.
RESULTS
Of 6814 MESA participants, 6751 had complete risk factor and follow-up data and were included in this study (mean [SD] age, 62.2 [10.2] years; 3186 [47.2%] male). A total of 881 (13.0%) had diabetes, 1738 (25.7%) had MetS, and 4132 (61.2%) had neither condition. After 11.1 mean years of follow-up, CHD events occurred in 84 participants with diabetes (135 ASCVD events), 115 with MetS (175 ASCVD events), and 157 with neither (250 ASCVD events). The CAC score was independently associated with incident CHD in multivariable analyses in those with diabetes (HR, 1.30; 95% CI, 1.19–1.43), MetS (HR, 1.30; 95% CI, 1.20–1.41), and neither condition (HR, 1.37; 95% CI, 1.27–1.47). For incident CHD, net reclassification improvement with addition of CAC score was 0.23 (95% CI, 0.10–0.37) in those with diabetes, 0.22 (95% CI, 0.09–0.35) in those with MetS, and 0.25 (95% CI, 0.15–0.35) in those with neither condition. The CAC score was also a prognostic indicator of CHD and ASCVD after controlling for diabetes duration of 10 years or longer at baseline, insulin use, and glycemic control.
CONCLUSIONS AND RELEVANCE
In a large multiethnic cohort, the addition of CAC score to global risk assessment was associated with significantly improved risk classification in those with MetS and diabetes, even if diabetes duration was longer than a decade, suggesting a role for the CAC score in risk assessment in such patients.
Type 2 diabetes mellitus and metabolic syndrome (MetS) result in a cascade of metabolic derangement, predisposing individuals to not only subclinical atherosclerosis but also coronary heart disease (CHD) and atherosclerotic cardiovascular disease (ASCVD).1–5 Coronary artery calcium (CAC) measured by noncontrast computed tomography (CT) is a measure of subclinical atherosclerosis.6–8 Others6,9,10 have found that the presence, extent, and progression of CAC enables prognostication of adverse clinical events better than traditional risk factors and global risk scoring among asymptomatic individuals, and helps reclassify individuals at intermediate risk to low- or high-risk groups.11,12 However, most prior studies11,12 that examined risk classification have excluded those with diabetes because the diagnosis of diabetes carries a label of CHD risk equivalency,13 whereas prediction models offer less clinical utility.14
Although the risk of diabetes is considered to be CHD risk equivalent, studies10,15 have found that there is heterogeneity among individuals for CHD and ASCVD risk. Although studies16–19 examining the prognostic significance of CAC in diabetes have found an association of CAC with CHD and CVD events, these analyses16–19 have not focused on reclassifying individuals with diabetes and MetS into lower- or higher-risk groups for long-term CHD and CVD risk.
We investigated the utility of CAC scores in reclassifying asymptomatic individuals with diabetes and MetS and the association of CAC scores with long-term risk prognostication in a multiethnic, population-based study. In addition, we examined whether other factors, such as duration of diabetes, are associated with risk prognostication to aid in clinical decision making regarding screening for subclinical disease in patients with diabetes.
Methods
Study Participants
We included participants from the Multi-Ethnic Study of Atherosclerosis (MESA), a prospective cohort study of 6814 men and women aged 45 to 84 years without known CVD from 4 race/ethnicity groups (white [38.5%], African American [27.5%], Hispanic [22.1%], and Chinese [11.9%]) recruited from 6 US communities from July 2000 through August 2002. Details of the MESA study design have been previously published.20 Written informed consent was provided by MESA study participants. The aggregated data were deidentified. The University of California, Irvine Institutional Review Board granted permission for analyses of the deidentified data.
CAC Scores and Risk Factor Assessment
The CAC score was measured using cardiac-gated electronbeam or multidetector CT, and details of scanning acquisition have been published previously.21 The CAC scores were based on the mean results from 2 scans and adjusted using a standard calcium phantom for calibration. Any detectable calcium was defined as a CAC score greater than 0. We log-transformed the CAC score (lnCAC score) as ln(CAC+1) to maintain the normality of CAC measures. The CAC scores were also categorized as 0, 1 through 99, 100 through 399, and 400 or greater and dichotomized as 0 or greater than 0.
Information about participant demographics, medical history, current medication use, duration of diabetes, and socioeconomic status based on income and education information was collected using standardized questionnaires. Resting blood pressure was measured with the mean of the last 2 of 3 blood pressure measurements used. Glucose, triglycerides, and high-density lipoprotein cholesterol measurements were taken after a 12-hour fast at the baseline examination. Hemoglobin A1c level was measured at examination 2, approximately 2 years after the baseline examination. The 10-year Framingham Risk Score (FRS) for incident CHD events was calculated as previously described,22 and the 10-year ASCVD risk score was calculated from the pooled cohort equation (PCE).23
All study participants were classified into the following categories: (1) diabetes, (2) MetS without diabetes, or (3) neither condition. Diabetes was defined as diagnosed diabetes, having a calibrated fasting serum glucose level of 126 mg/dL or greater (to convert to millimoles per liter, multiply by 0.0555), or taking hypoglycemia medication or insulin. Metabolic syndrome was defined as having at least 3 of the following 5 conditions: (1) waist circumference of 102 cm or greater (male) or 88 cm or greater (female), (2) triglyceride level of 150 mg/dL or greater (to convert to millimoles per liter, multiply by 0.0113), (3) high-density lipoprotein cholesterol level less than 40 mg/dL (male) or 50 mg/dL (female) (to convert to millimoles per liter, multiply by 0.0259), (4) blood pressure of 130/85 mm Hg or higher or use of hypertension medication, and/or (5) fasting glucose level of 100 mg/dL or higher but without diabetes (as defined above).24
End Point Ascertainment
At intervals of 9 to 12 months, a telephone interviewer inquired about interim hospital admissions, cardiovascular diagnoses, and deaths. An adjudication committee received copies of all death certificates and medical records for hospitalizations and outpatient cardiovascular diagnoses and conducted next-of-kin interviews for out-of-hospital cardiovascular deaths for verification.
Our primary end point was incident CHD events, including myocardial infarction (defined by a combination of chest pain, abnormal electrocardiographic findings, and cardiac enzymes abnormalities), resuscitated cardiac arrest, or CHD death; the secondary end point included incident ASCVD events, including incident CHD events and fatal or nonfatal stroke. Follow-up for each participant extended to the first occurrence of an incident event, other death, loss to follow-up, or the last follow-up call through December 31, 2013. Data analysis was performed from June 1, 2016, to September 12, 2017.
Statistical Analysis
Descriptive data are presented as mean (SD) for continuous variables and number (percentage) of participants for categorical variables. For each disease group, CHD and ASCVD incidence rates per 1000 person-years were calculated as incident event number per person-time at risk according to CAC score categories. Cumulative CHD and ASCVD survival rates for CAC score categories stratified by diabetes duration, glycemic control (hemoglobin A1c≤7% vs >7% [to convert to proportion of total, multiply by 0.01]), and insulin use were calculated with the Kaplan-Meier estimator and compared with the log-rank statistic. Cox proportional hazards regression was used to calculate hazard ratios (HRs) for 10-year estimated incident CHD and ASCVD risks, separately for each disease category, comparing FRS (or ASCVD risk score for ASCVD) with CAC score (with continuous CAC, lnCAC, and categorical CAC scores). Because hemoglobin A1c measurements were not available at baseline but were available in examination 2, we performed secondary analyses with hemoglobin A1c levels, diabetes duration, and insulin use in the model along with our other predictors. Interaction terms of CAC were used to examine for heterogeneity of effects by disease group and within those with diabetes by diabetes duration (≥10 vs <10 years) and insulin use.
The 10-year risk estimates were categorized as less than 5% (low risk), 5% to less than 7.5% (intermediate risk), and 7.5% or more (high risk) for CHD events and ASCVD events. In the secondary analysis, we also grouped risk as less than 7.5% or 7.5% or more for CHD or ASCVD events, consistent with the American College of Cardiology/American Heart Association guidelines for consideration of high-intensity statin use in those with diabetes.25 To assess the utility of CAC scores in 10-year risk prognostication, we used C statistics, net reclassification improvement (NRI), and integrative discrimination index to examine improvement of discrimination comparing models with CAC scores and FRS (or PCE for ASCVD) with those with FRS and PCE alone.26 The NRI was calculated as follows:
Up and down denote reclassification into higher- and lower-risk categories, respectively. P(event|up), P(event|down), and P(event) were calculated from the Kaplan-Meier estimate of 10-year event risk.
Means were compared using analysis of variance, and proportions were compared between disease groups using the χ2 test. A 2-sided P<.05 (P < .10 for interaction test) is considered to be statistically significant. All statistical analyses were performed using SAS software, version 9.3 (SAS Institute Inc).
Results
Of 6814 MESA participants, 6751 had complete risk factor and follow-up data and were included in this study (mean [SD] age, 62.2 [10.2] years; 3186 [47.2%] male). At baseline, 881 (13.0%) had diabetes, 1738 (25.7%) had MetS, and the remaining 4132 (61.2%) had neither condition. Those with diabetes tended to be older and were more likely male, African American, and Hispanic with poorer cardiovascular risk factors. Those with vs without MetS also had worse risk factors (Table 1). Those with diabetes also reported substantially higher use of lipidlowering medications (244 [27.7%]) compared with those with MetS (319 [18.4%]) and those with neither condition (529 [12.8%]). Among the study participants, 329 (37.3%) of those with diabetes (similar in those with or without MetS), 779 (44.8%) of those with MetS, and 2272 (55.0%) of those with neither diabetes nor MetS had a CAC score of 0.
Table 1.
Baseline Characteristics of Participants With Type 2 Diabetes, MetS, or Neither Conditiona
| Characteristic | Total (N = 6751) |
Neither (n = 4132) |
MetS (n = 1738) |
Total (Diabetes and Diabetes Plus MetS) (n = 881) |
Diabetes Only (n = 191) |
Diabetes and MetS (n = 690) |
P Valueb |
|---|---|---|---|---|---|---|---|
| Age, mean (SD), y | 62.2 (10.2) | 61.2 (10.4) | 63.0 (10.0) | 64.7 (9.5) | 64.6 (10.0) | 64.8 (9.3) | <.001 |
| Male | 3186 (47.2) | 2011 (48.7) | 717 (41.3) | 458 (52.0) | 139 (72.8) | 319 (46.2) | <.001 |
| Race/ethnicity | |||||||
| White | 2600 (38.5) | 1737 (42.0) | 695 (40.0) | 168 (19.1) | 33 (17.3) | 135 (19.6) | <.001 |
| African American | 1858 (27.5) | 1085 (26.3) | 440 (25.3) | 333 (37.8) | 38 (19.9) | 67 (9.7) | <.001 |
| Chinese | 800 (11.9) | 534 (12.9) | 161 (9.3) | 105 (11.9) | 73 (38.2) | 260 (37.7) | <.001 |
| Hispanic | 1493 (22.1) | 766 (18.8) | 442 (25.4) | 275 (31.2) | 47 (34.6) | 228 (33.0) | <.001 |
| Current smoker | 880 (13.0) | 531 (12.9) | 232 (13.3) | 117 (13.3) | 28 (14.7) | 89 (12.9) | .85 |
| SBP, mean (SD), mm Hg | 126.6 (21.5) | 122.2 (20.6) | 133.7 (20.7) | 133.1 (22.0) | 125.5 (18.7) | 135.2 (22.3) | <.001 |
| Total cholesterol level, mean (SD), mg/dL | 194.1 (35.7) | 194.2 (34.0) | 196.9 (37.2) | 188.6 (39.6) | 184.6 (34.0) | 189.6 (41.0) | <.001 |
| HDL-C level, mean (SD), mg/dL | 51.0 (14.8) | 55.3 (15.1) | 43.1 (10.2) | 46.1 (13.2) | 53.3 (12.8) | 44.1 (12.2) | <.001 |
| BMI | 28.3 (5.5) | 26.8 (4.9) | 30.9 (5.2) | 30.6 (5.8) | 26.4 (4.2) | 31.7 (5.7) | <.001 |
| Waist circumstance, mean (SD), cm | 98.1 (14.4) | 93.6 (13.2) | 105.5 (12.4) | 104.9 (14.5) | 93.8 (10.9) | 108.0 (13.9) | <.001 |
| Prevalence of high waist circumstance | 3650 (54.1) | 1573 (38.1) | 1474 (84.8) | 603 (68.4) | 30 (15.7) | 573 (83.0) | <.001 |
| eGFR, mean (SD), mL/min/1.73 m2 | 81.2 (18.5) | 81.1 (17.5) | 78.9 (17.0) | 85.9 (23.9) | 90.6 (20.8) | 84.6 (24.5) | <.001 |
| eGFR<30 mL/min/1.73 m2 | 23 (0.3) | 6 (0.1) | 8 (0.5) | 9 (1.0) | 0 (0) | 9 (1.3) | <.001 |
| 10-Year Framingham Risk Score for CHD, mean (SD), % | 14.5 (9.6) | 11.6 (8.6) | 16.8 (9.1) | 23.2 (8.2) | 15.9 (10.7) | 19.1 (11.3) | <.001 |
| 10-Year ASCVD risk from PCE, mean (SD), % | 13.5 (13.2) | 10.5 (10.7) | 14.2 (11.5) | 26.4 (17.9) | 22.4 (16.0) | 27.5 (18.3) | <.001 |
| Insulin use in patients with diabetes | NA | NA | NA | 117 (13.3) | 24 (12.6) | 93 (13.5) | NA |
| Lipid-lowering medication use | 1092 (16.2) | 529 (12.8) | 319 (18.4) | 244 (27.7) | 44 (23.0) | 201 (29.2) | <.001 |
| Statin use | 1003 (14.9) | 491 (11.9) | 288 (16.6) | 224 (25.5) | 42 (22) | 182 (26.5) | <.001 |
| Hypertension medication usec | 2505 (37.1) | 1039 (25.1) | 911 (52.4) | 555 (63.0) | 67 (35.1) | 488 (70.7) | <.001 |
| Diuretics | 1109 (16.4) | 425 (10.3) | 442 (25.4) | 242 (27.5) | 20 (10.5) | 222 (32.2) | <.001 |
| ACEI | 876 (13.0) | 304 (7.4) | 278 (16.0) | 294 (33.4) | 38 (19.9) | 256 (37.1) | <.001 |
| ARB | 359 (5.3) | 130 (3.1) | 129 (7.4) | 100 (11.4) | 13 (6.8) | 87 (12.6) | <.001 |
| β-Blocker | 6.45 (9.6) | 252 (6.1) | 280 (16.1) | 113 (12.8) | 11 (5.8) | 102 (14.8) | <.001 |
| CCB | 822 (12.2) | 349 (8.4) | 286 (16.5) | 187 (21.2) | 27 (14.1) | 160 (23.2) | <.001 |
| CAC score, mean (SD), | 145.9 (417.5) | 117.7 (362.7) | 157.3 (419.0) | 255.9 (597.5) | 281.4 (702.7) | 248.8 (565.3) | <.001 |
| Log-transformed CAC score, mean (SD) | 2.2 (2.5) | 1.9 (2.4) | 2.4 (2.5) | 3.0 (2.7) | 3.0 (2.7) | 3.0 (2.7) | <.001 |
| CAC score category | |||||||
| 0 | 3380 (50.1) | 2272 (55.0) | 779 (44.8) | 329 (37.3) | 71 (37.2) | 258 (37.4) | <.001 |
| 1–99 | 1782 (26.4) | 1037 (25.1) | 498 (28.7) | 247 (28.0) | 54 (28.3) | 193 (28.0) | |
| 100–399 | 919 (13.6) | 494 (12.0) | 278 (16.0) | 147 (16.7) | 32 (16.8) | 115 (16.7) | |
| ≥400 | 670 (9.9) | 329 (8.0) | 183 (10.5) | 158 (17.9) | 34 (17.8) | 124 (18.0) | |
| Follow-up time, mean (SD), y | 11.1 (3.0) | 11.4 (2.6) | 11.0 (2.8) | 10.3 (3.6) | 10.6 (3.4) | 10.2 (3.6) | <.001 |
| CHD events | 356 (5.3) | 157 (3.8) | 115 (6.6) | 84 (9.5) | 15 (7.9) | 69 (10.0) | <.001 |
| ASCVD events | 560 (8.3) | 250 (6.1) | 175 (10.1) | 135 (15.3) | 22 (11.5) | 113 (16.4) | <.001 |
Abbreviations: ACEI, angiotensin-converting enzyme inhibitor; ARB, angiotensin receptor blocker; ASCVD, atherosclerotic cardiovascular disease; BMI, body mass index (calculated as weight in kilograms divided by the height in meters squared); CAC, coronary artery calcium; CCB, calcium channel blocker; CHD, coronary heart disease; eGFR, estimated glomerular filtration rate; HDL-C, high-density lipoprotein cholesterol; MetS, metabolic syndrome; NA, not applicable; PCE, pooled cohort equation; SBP, systolic blood pressure. SI conversion factors: To convert total cholesterol and HDL-C to millimoles per liter, multiply by 0.0259.
Data are presented as number(percentage) unless otherwise indicated.
P value represents test for differences among 3 main disease groups (diabetes, MetS, and neither condition).
Some patients were taking multiple classes of medications, and the percentages may not represent the total number of patients taking antihypertensive medications.
During a mean (SD) follow-up time of 11.1 (3.0) years (median, 12.2 years), CHD events occurred in 84 participants with diabetes (135 ASCVD events), 115 with MetS (175 ASCVD events), and 157 with neither diabetes nor MetS (250 ASCVD events). Figure 1 shows the incidence rates of CHD and ASCVD according to CAC score categories in each disease group. In each group, a stepwise increase in observed CHD and ASCVD events was seen with increasing severity of CAC score categories. For those with diabetes but no CAC, the CHD event rate was 3.7 per 1000 person-years.
Figure 1. Incidence of Coronary Heart Disease (CHD) and Atherosclerotic Cardiovascular Disease (ASCVD) per 1000 Person-years by Disease Group and Coronary Artery Calcium (CAC) Score Categories.
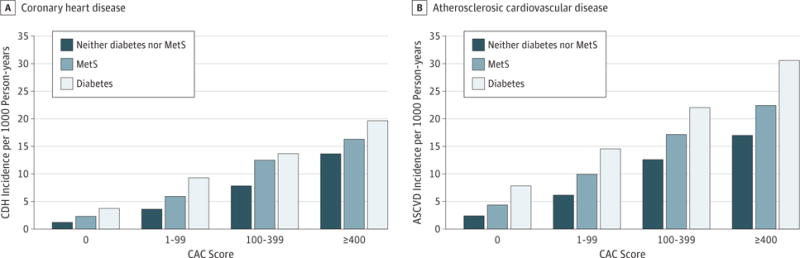
Diabetes was type 2. MetS indicates metabolic syndrome.
The CHD and ASCVD event rates were comparable between those with diabetes for less than 10 years and those with diabetes for 10 years or more for all CAC score categories unless the CAC score was 400 or greater, in which case event rates were higher (eFigure 1A in the Supplement). Insulin use was reported by 117 patients with diabetes (13.3%)at baseline, and the association among event rate, CAC score category, and use of insulin was inconsistent; however, in the CAC score of 400 or higher category, insulin use was associated with higher event rates (eFigure 1B in the Supplement). There was no consistent association among glycemic control, CAC category, and event rate (eFigure 1C in the Supplement). Among those with diabetes and the highest FRS category of greater than 20%, the CHD event rate was not high if the participant had a CAC score of 0 (4.7 per 1000 person-years) (eFigure 1D in the Supplement). Only at a PCE annual risk of 15% or greater did the event rate among those with diabetes and a CAC score of 0 increase to more than 7.5 per 1000 person-years (eFigure 1D in the Supplement). The presence of MetS along with diabetes was also associated with increased event rates (eFigure 1E in the Supplement).
Kaplan-Meier analyses (Figure 2) revealed that patients with a decade or more of diabetes at baseline had a greater number of CHD and ASCVD events. In those with a CAC score of 0, the event rate was similar for those with diabetes for a decade or more compared with those with a shorter duration of diabetes. The severity of CAC was more accurate compared with the duration of diabetes. We also examined insulin use and CAC scores; those taking insulin had higher event rates compared with those taking oral medications only (eFigure 2 in the Supplement). Poor glycemic control was associated with higher event rates for every CAC score category (eFigure 3 in the Supplement).
Figure 2.

Kaplan-Meier Analyses of Event-Free Survival for Coronary Heart Disease (CHD) and Atherosclerotic Cardiovascular Disease (ASCVD) in Those With Type 2 Diabetes by Diabetes Duration and Coronary Artery Calcium (CAC) Score
Compared with those with a CAC score of 0, the HRs for CHD and ASCVD events increased progressively with higher CAC categories; those with CAC scores of 400 or higher had the highest HRs for CHD events (HR, 5.60; 95% CI, 2.79–11.23, among those with diabetes) (Table 2). In the subgroup of participants with diabetes in whom diabetes duration, hemoglobin A1c level, and insulin use were available, the HRs additionally adjusted for these disease severity markers were similar to those of the main analyses, demonstrating the robustness of our findings (Table 2). Among patients with diabetes, the adjusted HR associated with a CAC score of 0 was 0.35 (95% CI, 0.15–0.80) for CHD events and 0.43 (95% CI, 0.27–0.81) for ASCVD. We also tested the interaction term for CAC and DM duration as well as CAC and insulin use, and these interactions were not statistically significant (eTable 1 in the Supplement).
Table 2.
Cox Proportional Hazards Regression Examining the Association of CHD and ASCVD Events With InCAC or CAC Categories Among Participants With Type 2 Diabetes, MetS, or Neither Conditiona
| Variable | Hazard Ratio (95% CI) | |||||
|---|---|---|---|---|---|---|
| CHD | ASCVD | |||||
| Diabetes (n = 834) |
MetS Without Diabetes (n = 1673) |
Neither Diabetes nor MetS (n = 3995) |
Diabetes (n = 834) |
MetS Without Diabetes (n = 1673) |
Neither Diabetes nor MetS (n = 3995) |
|
| lnCAC score | 1.30 (1.19–1.43)b | 1.30 (1.20–1.41)b | 1.37 (1.27–1.47)b | 1.21 (1.13–1.30)b | 1.19 (1.11–1.27)b | 1.23 (1.17–1.30)b |
| CAC score category | ||||||
| 0 | 1 [Reference] | 1 [Reference] | 1 [Reference] | 1 [Reference] | 1 [Reference] | 1 [Reference] |
| 1–99 | 2.31 (1.13–4.73)c | 2.63 (1.46–4.73)d | 2.33 (1.44–3.78)d | 1.64 (0.98–2.77) | 1.87 (1.21–2.90)b | 1.89 (1.32–2.72)b |
| 100–399 | 3.52 (1.66–7.46)d | 5.43 (3.03–9.74)b | 5.07 (3.11–8.27)b | 2.51 (1.44–4.35)c | 2.81 (1.78–4.45)b | 3.23 (3.19–4.77)b |
| ≥400 | 5.60 (2.79–11.23)b | 6.42 (3.38–12.2)b | 7.87 (4.74–13.08)b | 3.48 (2.06–5.86)b | 3.16 (1.91–5.22)b | 3.88 (2.57–5.85)b |
| Adjusted lnCAC (n = 463)e | 1.28 (1.12–1.45)b | NA | NA | 1.23 (1.11–1.36)b | NA | NA |
| Adjusted CAC of 0 vs CAC>0 (n = 463)e | 0.35 (0.15–0.80)c | NA | NA | 0.43 (0.27–0.81)d | NA | NA |
Abbreviations: ASCVD, atherosclerotic cardiovascular disease; CAC, coronary artery calcium; CHD, coronary heart disease; FRS, Framingham Risk Score; HbA1c, hemoglobin A1c; lnCAC, log-transformed coronary artery calcium; MetS, metabolic syndrome; NA, not applicable.
All models were adjusted for FRS (or pooled cohort equation for ASCVD), race/ethnicity, and socioeconomic status.
P < .001.
P < .05.
P < .01.
Additionally adjusted for HbA1c level, insulin level, and diabetes duration in patients with diabetes.
Measures of discrimination revealed a significant improvement with inclusion of CAC score in the prediction model across all disease groups (eTable 2, eTable 3, eFigure 4, and eFigure 5 in the Supplement). In the diabetes group, the NRI was 0.23 (95% CI, 0.10–0.37; P < .001) (eTable 3 in the Supplement). Reclassification of risk using CAC score (model 2) in the MetS group revealed a total NRI of 0.22 (95% CI, 0.09–0.35), whereas those with neither diabetes nor MetS had a total NRI of 0.25 (95% CI, 0.15–0.35). Category-free NRI captured any change of risk increase or decrease in event and nonevent subsets and produced highly significant results in all 3 disease groups when comparing the addition of CAC score with FRS and PCE alone; these estimates ranged from 0.56 to 0.65 for CHD events and from 0.45 to 0.56 for ASCVD events (eTable 3 in the Supplement).
Discussion
Our results indicate that evaluation of subclinical atherosclerosis with CAC scoring identifies downstream CHD and ASCVD events more than a decade after screeening has been done regardless of the presence of diabetes or MetS. Coronary artery calcium scores can be used to identify lower- and higher-risk individuals with MetS and diabetes. Many individuals with diabetes are at lower CHD and ASCVD risk than is widely understood and are not at high risk or CHD risk equivalents. Our results also indicate that CAC scoring adds significant clinical utility in further stratifying and reclassifying risk in persons with MetS and diabetes beyond global risk assessment using the FRS or ASCVD Pooled cohort risk score. Moreover, we found that the severity of CAC appears to be a more important clinical prognostic indicator than measures of disease severity, such as insulin use, glycemic control, and diabetes duration.
Although many prior studies11,12,16–19 have excluded those with diabetes based on assumptions that diabetes already confers CHD risk equivalence, our findings indicate that 44.8% of those with MetS and 37.3% of those with diabetes have no evidence of CAC at baseline, associated with observed 10-year CHD event rates of only 2.3% among those with MetS and 3.7% among those with diabetes. Thus, the “warranty period” of a CAC score of 0, as previously discussed,27,28 can be extended to 10 years in those with MetS or diabetes. Moreover, in our adjusted analyses, a CAC score of 0 was associated with low CHD and ASCVD risk among those with diabetes that was independent of diabetes duration, insulin use, or glycemic control.
Previous studies have emphasized the importance of diabetes duration, with the Framingham Heart Study29 reporting a 1.4-fold greater risk of CHD and a 1.9-fold greater risk of cardiovascular death for each 10-year increase in diabetes duration and the British Regional Heart Study30 reporting diabetes risk to be equivalent to CHD risk only in patients with a diabetes duration of 10 years or greater. In addition, the Veterans Affairs Diabetes Trial found that there was a greater risk of cardiovascular events despite tight glycemic control in patients with longer diabetes duration.31,32 As a result, the American Diabetes Association does not recommend aggressive hyperglycemia management in those with longer duration of diabetes and suggests that the duration of diabetes be considered when setting glycemic goals.33
Our analysis indicates that the presence and extent of CAC are more associated with ASCVD risk than is diabetes duration. Even among patients with long-standing diabetes, the absence of CAC was associated with similar low risk of events as among those with shorter duration of diabetes. Although diabetes is known to accelerate the aging process, future studies need to focus on the factors that provide resilience among patients with lack of subclinical disease despite long-standing diabetes.
Our results extend the findings of prior publications11,12 that have reported the clinical utility of CAC scoring, indicating that after a decade of follow-up, there is no decrement in the NRI among individuals without diabetes. Among those with diabetes, when we compared CAC scores with FRS and PCE for prognostication of long-term events, almost half of these individuals were reclassified to a different risk group. Yeboah et al34 reclassified CHD risk exclusively among those with diabetes after a follow-up of 8.5 years, combining data from a subset of participants in MESA and the Heinz Nixdorf Recall Study, who in addition to CAC scoring had undergone assessment of carotid intimal media thickness, measurement of ankle brachial index, and C-reactive protein testing. Their observed NRI was 0.19 despite use of more prognostic indicators than CAC score alone compared with FRS, which could be attributable to the shorter follow-up period requiring estimation vs measurement of 10-year CHD event rates. Valenti et al35 also examined long-term risk prognostication for all-cause mortality using CAC scores in 810 individuals with diabetes from a single-site cohort. They reported a category-free NRI for all-cause mortality of 0.50 to 0.53 among those with diabetes, which is similar to our results for CHD events. However, that analysis did not adjust for markers of diabetes severity or duration.
Strengths and Limitations
Strengths of MESA include its large sample size, ethnic diversity, and community-based recruitment. The prospective design provides information on the temporal association between the presence and extent of CAC and subsequent CHD and ASCVD events. Limitations of our analysis include the lack of data on diabetes duration for the entire diabetes group. In addition, it was beyond the scope of our project to examine the effects of CAC progression or to consider the effects of time-varying covariates. Thus, our risk estimates relate to our baseline measures only and do not consider the possible effects of changes in CAC scores or other risk factors. Although the CAC score increases invariably with time36 and more rapidly in individuals with vs without diabetes, with greater progression portending additional risk as previously reported,37 baseline CAC score appears to be more accurate for prediction of events in persons with and without MetS and diabetes. In addition, participants in MESA and their primary physicians were informed of their CAC imaging results in a letter. It is possible that such information may have biased the results toward fewer incident events because of risk factor modification; however, this bias would result in attenuation of our findings.38
Conclusions
Our results support the clinical utility of CAC scoring in those with diabetes and MetS. Currently, CAC imaging has a class IIb recommendation in the 2013 ASCVD risk assessment guidelines.39 In addition, the Imaging Council of the American College of Cardiology recently concluded that CAC screening is the most sensitive noninvasive risk stratification tool among asymptomatic persons with diabetes.40 Although screening for CHD in patients with diabetes has previously been found to not be of benefit in reducing CHD and ASCVD events,41,42 other reports43–45 have found that patient awareness of an abnormal CAC score and coronary CT angiography results is associated with increased adherence to preventive therapies, lifestyle changes, and improvement in lipid levels and other risk factors, suggesting that CAC screening might help to support behavioral modification. In addition, Nasir et al46 found that CAC screening in MESA participants without diabetes can help identify those at adequately high risk who would benefit from statin therapy (and those at low risk who would not benefit). Whether asymptomatic patients with or without diabetes will have lower cardiovascular event rates from targeting statin use or intensity according to the presence of subclinical atherosclerosis has yet to be determined. Future research should examine whether newer antidiabetic medications, such as sodium glucose cotransporter 2 inhibitors or glucagonlike peptide 1 receptor agonists, that benefit patients with known ASCVD could be considered for those at increased risk based on extent of CAC or other measures of subclinical atherosclerosis. Prospective studies that focus treatment intensity on objective measures of subclinical atherosclerosis may improve personalization of preventive therapies.
Supplementary Material
Key Points.
Question
What is the long-term clinical utility of coronary artery calcium scores for cardiovascular disease prognostication in those with established metabolic syndrome and type 2 diabetes in a multiethnic population?
Findings
Coronary artery calcium scores had significant long-term (>10 years) value in prognosticating cardiovascular disease in patients with metabolic syndrome and diabetes. A coronary artery calcium score of 0 was associated with low cardiovascular disease risk independent of diabetes duration, insulin use, or glycemic control.
Meaning
Assessment of subclinical disease using coronary artery calcium scoresmay have robust long-term value in prognosticating cardiovascular disease even in those who had diabetes for more than 10 years from the time of coronary artery calcium scoring.
Acknowledgments
Funding/Support: The Multi-Ethnic Study of Atherosclerosis (MESA) was supported by contracts N01-HC-95159 through N01-HC-95169 from the National Heart, Lung, and Blood Institute (NHLBI). Dr Malik is supported by grant R01 HL 128801 from the NHLBI.
Role of the Funder/Sponsor: The funding source had no role in the design and conduct of the study; collection, management, analysis, and interpretation of the data; preparation, review, or approval of the manuscript; and the decision to submit the manuscript for publication.
Footnotes
Author Contributions: Dr Malik had full access to all the data in the study and takes responsibility for the integrity of the data and the accuracy of the data analysis.
Study concept and design: Malik, Budoff, Nasir, Wong.
Acquisition, analysis, or interpretation of data: All authors.
Drafting of the manuscript: Malik, Zhao, Nasir, Wong.
Critical revision of the manuscript for important intellectual content: All authors.
Statistical analysis: Zhao, Nasir, Wong.
Obtained funding: Malik, Budoff, Nasir.
Administrative, technical, or material support: Malik, Nasir.
Study supervision: Malik, Budoff, Nasir, Blumenthal.
Conflict of Interest Disclosures: All authors have completed and submitted the ICMJE Form for Disclosure of Potential Conflicts of Interest and none were reported.
Additional Contributions: We thank the other investigators, staff, and participants of the MESA study for their valuable contributions. A full list of participating MESA investigators and institutions can be found at https://www.mesanhlbi.org.
Contributor Information
Shaista Malik, Division of Cardiology, Department of Medicine, University of California, Irvine; Susan Samueli Center for Integrative Medicine, University of California, Irvine.
Yanglu Zhao, Department of Epidemiology, UCLA (University of California, Los Angeles), Los Angeles.
Matthew Budoff, Los Angeles Biomedical Research Institute, Harbor-UCLA Medical Center, Los Angeles, California.
Khurram Nasir, Center for Prevention and Wellness Research, Baptist Health Medical Group, Miami Beach, Florida; Ciccarone Center for the Prevention of Heart Disease, Johns Hopkins University, Baltimore, Maryland.
Roger S. Blumenthal, Ciccarone Center for the Prevention of Heart Disease, Johns Hopkins University, Baltimore, Maryland.
Alain G. Bertoni, Department of Epidemiology and Prevention, Wake Forest University School of Medicine, Winston–Salem, North Carolina.
Nathan D. Wong, Division of Cardiology, Department of Medicine, University of California, Irvine.
References
- 1.American Diabetes Association. Data from the National Diabetes Statistics Report, 2015. (released June 10, 2014). http:/www.diabetes.org/diabetes-basics/statistics/. Accessed August 7, 2016.
- 2.American Diabetes Association. Standards of medical care in diabetes, 2012. Diabetes Care. 2012;35(suppl1):S11–S63. doi: 10.2337/dc12-s011. [DOI] [PMC free article] [PubMed] [Google Scholar]
- 3.Malik S, Wong ND, Franklin SS, et al. Impact of the metabolic syndrome on mortality from coronary heart disease, cardiovascular disease, and all causes in United States adults. Circulation. 2004;110(10):1245–1250. doi: 10.1161/01.CIR.0000140677.20606.0E. [DOI] [PubMed] [Google Scholar]
- 4.Gu K, Cowie CC, Harris MI. Mortality in adults with and without diabetes in a national cohort of the U.S. population, 1971–1993. Diabetes Care. 1998;21(7):1138–1145. doi: 10.2337/diacare.21.7.1138. [DOI] [PubMed] [Google Scholar]
- 5.Lakka HM, Laaksonen DE, Lakka TA, et al. The metabolic syndrome and total and cardiovascular disease mortality in middle-aged men. JAMA. 2002;288(21):2709–2716. doi: 10.1001/jama.288.21.2709. [DOI] [PubMed] [Google Scholar]
- 6.Detrano R, Guerci AD, Carr JJ, et al. Coronary calcium as a predictor of coronary events in four racial or ethnic groups. N Engl J Med. 2008;358(13):1336–1345. doi: 10.1056/NEJMoa072100. [DOI] [PubMed] [Google Scholar]
- 7.Shaw LJ, Raggi P, Schisterman E, Berman DS, Callister TQ. Prognostic value of cardiac risk factors and coronary artery calcium screening for all-cause mortality. Radiology. 2003;228(3):826–833. doi: 10.1148/radiol.2283021006. [DOI] [PubMed] [Google Scholar]
- 8.Jain A, McClelland RL, Polak JF, et al. Cardiovascular imaging for assessing cardiovascular risk in asymptomatic men versus women: the multi-ethnic study of atherosclerosis (MESA) Circ Cardiovasc Imaging. 2011;4(1):8–15. doi: 10.1161/CIRCIMAGING.110.959403. [DOI] [PMC free article] [PubMed] [Google Scholar]
- 9.Greenland P, LaBree L, Azen SP, Doherty TM, Detrano RC. Coronary artery calcium score combined with Framingham score for risk prediction in asymptomatic individuals. JAMA. 2004;291(2):210–215. doi: 10.1001/jama.291.2.210. [DOI] [PubMed] [Google Scholar]
- 10.Malik S, Budoff MJ, Katz R, et al. Impact of subclinical atherosclerosis on cardiovascular disease events in individuals with metabolic syndrome and diabetes: the multi-ethnic study of atherosclerosis. Diabetes Care. 2011;34(10):2285–2290. doi: 10.2337/dc11-0816. [DOI] [PMC free article] [PubMed] [Google Scholar]
- 11.Yeboah J, McClelland RL, Polonsky TS, et al. Comparison of novel risk markers for improvement in cardiovascular risk assessment in intermediate-risk individuals. JAMA. 2012;308(8):788–795. doi: 10.1001/jama.2012.9624. [DOI] [PMC free article] [PubMed] [Google Scholar]
- 12.Polonsky TS, McClelland RL, Jorgensen NW, et al. Coronary artery calcium score and risk classification for coronary heart disease prediction. JAMA. 2010;303(16):1610–1616. doi: 10.1001/jama.2010.461. [DOI] [PMC free article] [PubMed] [Google Scholar]
- 13.Haffner SM, Lehto S, Rӧnnemaa T, Pyӧrӓlӓ K, Laakso M. Mortality from coronary heart disease in subjects with type 2 diabetes and in nondiabetic subjects with and without prior myocardial infarction. N Engl J Med. 1998;339(4):229–234. doi: 10.1056/NEJM199807233390404. [DOI] [PubMed] [Google Scholar]
- 14.Coleman RL, Stevens RJ, Retnakaran R, Holman RR. Framingham, SCORE, and DECODE risk equations do not provide reliable cardiovascular risk estimates in type 2 diabetes. Diabetes Care. 2007;30(5):1292–1293. doi: 10.2337/dc06-1358. [DOI] [PubMed] [Google Scholar]
- 15.Stevens RJ, Kothari V, Adler Al, Stratton IM, United Kingdom Prospective Diabetes Study (UKPDS) Group The UKPDS risk engine: a model for the risk of coronary heart disease in type II diabetes (UKPDS 56) Clin Sci (Lond) 2001;101(6):671–679. [PubMed] [Google Scholar]
- 16.Raggi P, Shaw LJ, Berman DS, Callister TQ. Prognostic value of coronary artery calcium screening in subjects with and without diabetes. J Am Coll Cardiol. 2004;43(9):1663–1669. doi: 10.1016/j.jacc.2003.09.068. [DOI] [PubMed] [Google Scholar]
- 17.Elkeles RS, Godsland IF, Feher MD, et al. PREDICT Study Group Coronary calcium measurement improves prediction of cardiovascular events in asymptomatic patients with type 2 diabetes: the PREDICT study. Eur Heart J. 2008;29(18):2244–2251. doi: 10.1093/eurheartj/ehn279. [DOI] [PubMed] [Google Scholar]
- 18.Raggi P, Cooil B, Ratti C, Callister TQ, Budoff M. Progression of coronary artery calcium and occurrence of myocardial infarction in patients with and without diabetes mellitus. Hypertension. 2005;46(1):238–243. doi: 10.1161/01.HYP.0000164575.16609.02. [DOI] [PubMed] [Google Scholar]
- 19.Becker A, Leber AW, Becker C, et al. Predictive value of coronary calcifications for future cardiac events in asymptomatic patients with diabetes mellitus: a prospective study in 716 patients over 8 years. BMC Cardiovasc Disord. 2008;8:27. doi: 10.1186/1471-2261-8-27. [DOI] [PMC free article] [PubMed] [Google Scholar]
- 20.Bild DE, Bluemke DA, Burke GL, et al. Multi-Ethnic Study of Atherosclerosis: objectives and design. Am J Epidemiol. 2002;156(9):871–881. doi: 10.1093/aje/kwf113. [DOI] [PubMed] [Google Scholar]
- 21.Carr JJ, Nelson JC, Wong ND, et al. Calcified coronary artery plaque measurement with cardiac CT in population-based studies: standardized protocol of Multi-Ethnic Study of Atherosclerosis (MESA) and Coronary Artery Risk Development in Young Adults (CARDIA) study. Radiology. 2005;234(1):35–43. doi: 10.1148/radiol.2341040439. [DOI] [PubMed] [Google Scholar]
- 22.Wilson PW, DAgostino RB, Levy D, Belanger AM, Silbershatz H, Kannel WB. Prediction of coronary heart disease using risk factor categories. Circulation. 1998;97(18):1837–184. doi: 10.1161/01.cir.97.18.1837. [DOI] [PubMed] [Google Scholar]
- 23.Goff DC, Jr, Lloyd-Jones DM, Bennett G, et al. American College of Cardiology/American Heart Association Task Force on Practice Guidelines 2013 ACC/AHA guideline on the assessment of cardiovascular risk: a report of the American College of Cardiology/American Heart Association Task Force on Practice Guidelines. J Am Coll Cardiol. 2014;63(25 Pt B):2935–2959. doi: 10.1016/j.jacc.2013.11.005. [DOI] [PMC free article] [PubMed] [Google Scholar]
- 24.Grundy SM, Cleeman JI, Daniels SR, et al. American Heart Association; National Heart, Lung, and Blood Institute Diagnosis and management of the metabolic syndrome: an American Heart Association/National Heart, Lung, and Blood Institute scientific statement. Circulation. 2005;112(17):2735–2752. doi: 10.1161/CIRCULATIONAHA.105.169404. [DOI] [PubMed] [Google Scholar]
- 25.Stone NJ, Robinson JG, Lichtenstein AH, et al. American College of Cardiology/American Heart Association Task Force on Practice Guidelines 2013 ACC/AHA guideline on the treatment of blood cholesterol to reduce atherosclerotic cardiovascular risk in adults: a report of the American College of Cardiology/American Heart Association Task Force on Practice Guidelines. Circulation. 2014;129(25)(suppl 2):S1–S45. doi: 10.1161/01.cir.0000437738.63853.7a. [DOI] [PubMed] [Google Scholar]
- 26.Pencina MJ, D’Agostino RB, Sr, Steyerberg EW. Extensions of net reclassification improvement calculations to measure usefulness of new biomarkers. Stat Med. 2011;30(1):11–21. doi: 10.1002/sim.4085. [DOI] [PMC free article] [PubMed] [Google Scholar]
- 27.Valenti V, Ó Hartaigh B, Heo R, et al. A 15-year warranty period for asymptomatic individuals without coronary artery calcium: a prospective follow-up of 9,715 individuals. JACC Cardiovasc Imaging. 2015;8(8):900–909. doi: 10.1016/j.jcmg.2015.01.025. [DOI] [PMC free article] [PubMed] [Google Scholar]
- 28.Min JK, Lin FY, Gidseg DS, et al. Determinants of coronary calcium conversion among patients with a normal coronary calcium scan: what is the “warranty period” for remaining normal? J Am Coll Cardiol. 2010;55(11):1110–111. doi: 10.1016/j.jacc.2009.08.088. [DOI] [PubMed] [Google Scholar]
- 29.Fox CS, Sullivan L, D’Agostino RB, Sr, Wilson PW, Framingham Heart Study The significant effect of diabetes duration on coronary heart disease mortality: the Framingham Heart Study. Diabetes Care. 2004;27(3):704–708. doi: 10.2337/diacare.27.3.704. [DOI] [PubMed] [Google Scholar]
- 30.Wannamethee SG, Shaper AG, Whincup PH, Lennon L, Sattar N. Impact of diabetes on cardiovascular disease risk and all-cause mortality in older men: influence of age at onset, diabetes duration, and established and novel risk factors. Arch Intern Med. 2011;171(5):404–410. doi: 10.1001/archinternmed.2011.2. [DOI] [PubMed] [Google Scholar]
- 31.Duckworth WC, Abraira C, Moritz TE, et al. Investigators of the VADT The duration of diabetes affects the response to intensive glucose control in type 2 subjects: the VA Diabetes Trial. J Diabetes Complications. 2011;25(6):355–361. doi: 10.1016/j.jdiacomp.2011.10.003. [DOI] [PubMed] [Google Scholar]
- 32.Skyler JS, Bergenstal R, Bonow RO, et al. American Diabetes Association; American College of Cardiology Foundation; American Heart Association Intensive glycemic control and the prevention of cardiovascular events: implications of the ACCORD, ADVANCE, and VA diabetes trials: a position statement of the American Diabetes Association and a scientific statement of the American College of Cardiology Foundation and the American Heart Association. Diabetes Care. 2009;32(1):187–192. doi: 10.2337/dc08-9026. [DOI] [PMC free article] [PubMed] [Google Scholar]
- 33.American Diabetes Association. Standards of medical care in diabetes-2016. Diabetes Care. 2016;39(suppl 1):S1–S106. doi: 10.2337/dc16-er09. [DOI] [PubMed] [Google Scholar]
- 34.Yeboah J, Erbel R, Delaney JC, et al. Development of a new diabetes risk prediction tool for incident coronary heart disease events: the Multi-Ethnic Study of Atherosclerosis and the Heinz Nixdorf Recall Study. Atherosclerosis. 2014;236(2):411–417. doi: 10.1016/j.atherosclerosis.2014.07.035. [DOI] [PMC free article] [PubMed] [Google Scholar]
- 35.Valenti V, Hartaigh BÓ, Cho I, et al. Absence of coronary artery calcium identifies asymptomatic diabetic individuals at low near-term but not long-term risk of mortality: a 15-year follow-up study of 9715 patients. Circ Cardiovasc Imaging. 2016;9(2):e003528. doi: 10.1161/CIRCIMAGING.115.003528. [DOI] [PMC free article] [PubMed] [Google Scholar]
- 36.McCullough PA, Chinnaiyan KM. Annual progression of coronary calcification in trials of preventive therapies: a systematic review. Arch Intern Med. 2009;169(22):2064–2070. doi: 10.1001/archinternmed.2009.382. [DOI] [PubMed] [Google Scholar]
- 37.Wong ND, Nelson JC, Granston T, et al. Metabolic syndrome, diabetes, and incidence and progression of coronary calcium: the Multiethnic Study of Atherosclerosis study. JACC Cardiovasc Imaging. 2012;5(4):358–366. doi: 10.1016/j.jcmg.2011.12.015. [DOI] [PMC free article] [PubMed] [Google Scholar]
- 38.Bittencourt MS, Blaha MJ, Blankstein R, et al. Polypill therapy, subclinical atherosclerosis, and cardiovascular events-implications for the use of preventive pharmacotherapy: MESA (Multi-Ethnic Study of Atherosclerosis) J Am Coll Cardiol. 2014;63(5):434–443. doi: 10.1016/j.jacc.2013.08.1640. [DOI] [PMC free article] [PubMed] [Google Scholar]
- 39.Greenland P, Alpert JS, Beller GA, et al. American College of Cardiology Foundation; American Heart Association 2010 ACCF/AHA guideline for assessment of cardiovascular risk in asymptomatic adults: a report of the American College of Cardiology Foundation/American Heart Association Task Force on Practice Guidelines. J Am Coll Cardiol. 2010;56(25):e50–e103. doi: 10.1016/j.jacc.2010.09.001. [DOI] [PubMed] [Google Scholar]
- 40.Budoff MJ, Raggi P, Beller GA, et al. Non-invasive cardiovascular risk assessment of the asymptomatic diabetic patient. J Am Coll Cardiol Imaging. 2016;9:176–192. [Google Scholar]
- 41.Wackers FJ, Young LH, Inzucchi SE, et al. Detection of Ischemia in Asymptomatic Diabetics Investigators Detection of silent myocardial ischemia in asymptomatic diabetic subjects: the DIAD study. Diabetes Care. 2004;27(8):1954–1961. doi: 10.2337/diacare.27.8.1954. [DOI] [PubMed] [Google Scholar]
- 42.Muhlestein JB, Lappé DL, Lima JA, et al. Effect of screening for coronary artery disease using CT angiography on mortality and cardiac events in high-risk patients with diabetes: the FACTOR-64 randomized clinical trial. JAMA. 2014;312(21):2234–2243. doi: 10.1001/jama.2014.15825. [DOI] [PubMed] [Google Scholar]
- 43.Wong ND, Detrano RC, Diamond G, et al. Does coronary artery screening by electron beam computed tomography motivate potentially beneficial lifestyle behaviors? Am J Cardiol. 1996;78(11):1220–1223. doi: 10.1016/s0002-9149(96)00599-1. [DOI] [PubMed] [Google Scholar]
- 44.Rozanski A, Gransar H, Shaw LJ, et al. Impact of coronary artery calcium scanning on coronary risk factors and downstream testing the EISNER (Early Identification of Subclinical Atherosclerosis by Noninvasive Imaging Research) prospective randomized trial. J Am Coll Cardiol. 2011;57(15):1622–1632. doi: 10.1016/j.jacc.2011.01.019. [DOI] [PMC free article] [PubMed] [Google Scholar]
- 45.Orakzai RH, Nasir K, Orakzai SH, et al. Effect of patient visualization of coronary calcium by electron beam computed tomography on changes in beneficial lifestyle behaviors. Am J Cardiol. 2008;101(7):999–1002. doi: 10.1016/j.amjcard.2007.11.059. [DOI] [PubMed] [Google Scholar]
- 46.Nasir K, Bittencourt MS, Blaha MJ, et al. Implications of coronary artery calcium testing among statin candidates according to American College of Cardiology/American Heart Association Cholesterol Management Guidelines: MESA (Multi-Ethnic Study of Atherosclerosis) J Am Coll Cardiol. 2015;66(15):1657–1668. doi: 10.1016/j.jacc.2015.07.066. [DOI] [PubMed] [Google Scholar]
Associated Data
This section collects any data citations, data availability statements, or supplementary materials included in this article.