

Abstract
Aims/hypothesis
Elevated levels of fasting glucose and fasting insulin in non-diabetic individuals are markers of dysregulation of glucose metabolism and strong risk factors for type 2 diabetes. Genome-wide association studies have discovered over 50 single nucleotide polymorphisms (SNPs) associated with these traits. The majority of these loci were discovered in European populations and have not been tested in a well-powered multi-ethnic study. We hypothesised that a large, ancestrally diverse, fine-mapping genetic study of glycaemic traits would identify novel and population-specific associations that were previously undetectable by European-centric studies.
Methods
A multi-ethnic study of up to 26,760 unrelated non-diabetic individuals of predominantly Hispanic/Latino and African ancestries were genotyped using the Metabochip. Transethnic meta-analysis of racial/ethnic-specific linear regression analyses was performed for fasting glucose and fasting insulin. We attempted to replicate 39 fasting glucose and 17 fasting insulin loci. Genetic fine-mapping was performed through sequential conditional analyses in 15 regions that included both the initially reported SNP association(s) and denser coverage of SNP markers. In addition, Metabochip-wide analyses were performed to discover novel fasting glucose and fasting insulin loci. The most significant SNP associations were further examined using bioinformatic functional annotation.
Results
Previously reported SNP associations were significantly replicated (p value ≤ 0.05) in 31/39 fasting glucose loci and 14/17 fasting insulin loci. Eleven glycaemic trait loci were refined to a smaller list of potentially causal variants through transethnic meta-analysis. Stepwise conditional analysis identified two loci with independent secondary signals (G6PC2-rs477224 and GCK-rs2908290), which had not previously been reported. Population-specific conditional analyses identified an independent signal in G6PC2 tagged by the rare variant rs77719485 in African Ancestry. Further Metabochip-wide analysis uncovered one novel fasting insulin locus at SLC17A2-rs75862513.
Conclusions/interpretation
These findings suggest that while glycaemic trait loci often have generalizable effects across the studied populations, transethnic genetic studies help prioritise likely functional SNPs, identify novel associations that may be population-specific, and in turn have the potential to influence screening efforts or therapeutic discoveries.
The summary statistics from each of the ancestry specific and transethnic (combined ancestry) results can be found under the PAGE study on dbGaP here: https://www.ncbi.nlm.nih.gov/projects/gap/cgi-bin/study.cgi?study_id=phs000356.v1.p1
Keywords: Fine-mapping, Genetic, Glucose, Glycaemic, Glycemic, Insulin, Multiethnic, PAGE, Transethnic, Type 2 diabetes
Introduction
Type 2 diabetes is a growing epidemic that disproportionally burdens U.S. minority populations [1]. Elevated levels of fasting glucose and fasting insulin in non-diabetic individuals are markers of dysregulated glucose metabolism and are strong risk factors for type 2 diabetes [2]. Although twin and family studies provide heritability estimates of 10–50% for these traits [3, 4], family-based linkage studies have been largely unsuccessful in identifying specific contributing loci. Alternatively, genome-wide association studies (GWAS) greatly accelerated the pace of discovery of genetic variants contributing to glycaemic traits. For example, the Meta-Analyses of Glucose and Insulin-related traits (MAGIC) consortium performed a large-scale investigation of glycaemic traits in European descent individuals without diabetes and identified 24 fasting glucose loci and 8 fasting insulin loci, 3 of which were associated with both traits [5, 6]. These findings have implicated genes and pathways known to be related to glucose metabolism (eg. GCK/G6PC2 and glucose dephosphorylation), as well as novel pathways (eg. MTNR1B and circadian rhythmicity). However, in some instances, the interpretation of GWAS findings has been challenging. For instance, many of the known loci are positioned in non-coding, putative regulatory regions of the genome, which in turn makes it difficult to identify gene target(s). Additionally, the most significant variant is often not the causal variant, but a correlated variant in linkage disequilibrium (LD) with the functional variant(s).
While early GWAS efforts were focused on populations of European descent, initial attempts to generalise GWAS findings to more diverse populations have had limited success [7–9]. Importantly, these studies tended to be small and only included the initial most significant GWAS variant (index SNP). However, it is critical that transethnic investigation of GWAS loci include both the index, and all correlated variants, given that patterns of LD vary by ancestry and the functional SNP(s) are rarely known. On average, European populations have more highly correlated SNPs and extended haplotypes in comparison to populations of African ancestry (AA). Hispanics/Latinos (H/L), on the other hand, are more admixed with highly variable contributions of African, European and New World ancestry. Due in part to reduction in LD with neighboring SNPs, transethnic studies can leverage these differences across and within admixed populations to localise causal variants, and discover novel population-specific associations that were undetectable in genetically homogeneous studies. Thus, transethnic studies may provide insight into the underlying biology of complex traits, which may differ among groups.
The Metabochip was developed to fine-map GWAS loci for metabolic and cardiovascular traits, as well as replicate promising loci with suggestive, but not genome-wide significant p values [10]. Among the 196,725 Metabochip variants selected for fine-mapping metabolic and cardiovascular-related loci, approximately 40K were selected for type 2 diabetes and related biomarkers. Among the 39 fasting glucose loci and 17 fasting insulin loci [5, 6] that were available for replication, 15 loci included not only the index SNP, but denser coverage of SNPs on the Metabochip that could be utilised for fine-mapping. Importantly, despite very large sample sizes, attempted Metabochip fine-mapping in a European-descent population generally did not yield stronger associations than the original GWAS index SNP or reduce the number of SNPs reaching similar levels of significance [11]. As such, this effort was unable to narrow in on functional candidate SNP(s).
This study examined the association of Metabochip SNPs with fasting glucose and fasting insulin in multiethnic study of up to 26,760 participants: 14,953 H/L, 10,380 AA, 998 Asian and Pacific Islander (ASN), and 429 AI/AN populations from the Population Architecture using Genetic Epidemiology (PAGE) consortium. Specifically, we 1) tested the association of index SNPs previously reported for 39 fasting glucose and 17 fasting insulin loci from studies of European-descent individuals; 2) used transethnic meta-analysis to refine known glycaemic trait loci in 15 loci that were densely covered with SNPs on the Metabochip; 3) investigated remaining metabolic and cardiovascular trait loci on the Metabochip for association with these glycaemic traits; and 4) performed bioinformatic functional annotation of the most significant (lead) SNPs to further prioritise likely causal variants.
Methods
Ethics statement
This study was performed in accordance with the tenets of the Declaration of Helsinki and approved by the Institutional Review Boards of each participating study. All study participants provided written informed consent.
Study population and trait measurement
The PAGE consortium was funded by the National Human Genome Research Institute (NHGRI) to investigate the epidemiologic architecture of well-replicated genetic variants associated with human diseases or traits [12]. This analysis includes self-reported H/L, AA, ASN and AI/AN non-diabetic individuals, 18 years or older, from the Multiethnic Cohort Study (MEC), the Women’s Health Initiative (WHI), Atherosclerosis Risk in Communities (ARIC), Coronary Artery Risk Development in Young Adults (CARDIA), the Hispanic/Latino Community Health Study/Study of Latinos (HLHS/SOL), and the Mount Sinai School of Medicine’s (MSSM) DNA biobank (BioMe™). Further details about each cohort can be found under the study population and trait measurement section in the ESM.
Fasting glucose and fasting insulin concentrations were measured using standard assays, at laboratories specific to each PAGE site (ESM Table 1). Individuals self-reporting that they have ever been diagnosed with diabetes, take diabetes medications, or with fasting blood glucose levels ≥126 mg/dl (≥6.99 mmol/l) were excluded from analyses. Individuals with body mass index (BMI)<16.5 kg/m2 or BMI>70 kg/m2 were also excluded with the assumption that these extremes could be attributable to data coding errors, an underlying illness, or reflecting a familial syndrome. Prior to analyses, each study removed race/ethnicity outliers using ancestry informative principal components (PCs).
After exclusions, fasting glucose analyses consisted of 14,953 H/L, 10,380 AA, 998 ASN, and 429 AI/AN. Fasting insulin analyses were slightly smaller, including 12,895 H/L, 8,361 AA, 998 ASN, and 420 AI/AN. Fasting insulin was not available for BioMe™. Race/ethnicity was self-reported. Descriptive characteristics of PAGE study participants by cohort can be found in ESM Table 2. While ASN and AI/AN were included for transethnic meta-analysis, population-specific analyses were underpowered due to small sample sizes. As such, AI/AN and ASN population-specific analyses were used as a comparison for consistency in the direction of effect.
Genotyping and quality control
Genotyping was performed using the Metabochip, the design of which has been described elsewhere [10]. In brief, the 200K Metabochip is designed to cost effectively analyse putative association signals identified through GWAS of many glucose and insulin-related metabolic and cardiovascular traits and to fine-map established loci [10]. More than 122,000 SNPs were included to fine-map 257 GWAS loci for 23 traits [10]. Fine-mapping loci were defined as the GWAS index SNP and all correlated SNPs (r2≥0.5) that were within 0.02cM of the index and having a minor allele frequency >1% in at least one HapMap Phase I population. SNPs were excluded if the Illumina design score was <0.5 or there were SNPs within 15bp of the SNP of interest with minor allele frequency (MAF) of >2% among Europeans (CEU).
Metobochip genotyping was performed for MEC, ARIC, CARDIA, HCHS/SOL and WHI [13]. Standard QC filters were applied for samples and SNPs, including missing rate and Hardy-Weinberg equilibrium (p value<1×10⁻⁷). A portion of WHI AA had both Metabochip and the Affymetrix 6.0 genotype data available from the SNP Health Association Resource (SHARe); this was used to impute Metabochip SNPs in the remaining SHARe participants with only Affymetrix 6.0 GWAS, [8] and only dosages with imputation R2>0.3 were included in the analyses. In BioMe™, genotypes from the Illumina HumanOmniExpress array were imputed to 1000 Genome Phase I haplotype panels (March 2012) [14]. Metabochip SNPs with proper info score ≥ 0.4 were included in the analysis. PCs were determined within each study using the Eigensoft software [15]. We excluded SNPs with a minor allele count less than 5 within each study by racial/ethnic population. The sample success rate and concordance rate for duplicate pairs across all studies were ≥95% and ≥99%, respectively. Further genotyping and analytical characteristics of the participating studies are further summarised under the genotyping and quality control section of ESM and in ESM Table 1.
Replication and fine-mapping approach
The overall study design for replication, fine-mapping and discovery of novel loci is summarised in Fig. 1. For replication of known loci, unconditional association analyses were performed for previously reported index SNPs listed in ESM Table 3. A nominal significance level (α=0.05) was used to define replication of a locus. Next, unconditional association analyses were performed for all SNPs in a locus by race/ethnicity and by transethnic meta-analysis. A locus-specific p value threshold was defined as 0.05 divided by the number of SNPs passing QC in each region (ranging from α=1.4×10⁻⁵ to α=4.1×10⁻⁴, Table 1). Locus-specific significance was used to conservatively adjust for multiple testing, while also acknowledging that genetic variation is known to influence glycaemic traits in these regions. LD was calculated for PAGE H/L, AA, and Asian samples with 500kb sliding windows using PLINK [16]. Metabochip LD and frequency information in Europeans was provided by the 1000 Genomes Phase 3 population. These LD patterns were used to evaluate locus refinement. Additionally, LocusZoom plots [17] were used to graphically display the fine-mapping results and LD for these plots used 1000 Genomes Phase I super populations (EUR, AMR, AFR). After identifying the most significant lead SNP in each region, we searched for additional independent association signals by including the lead SNP in the conditional model, and then testing each of the remaining SNPs in a region. These conditional analyses were repeated, adding in the lead SNP and conditional lead SNP(s), until no SNP in the model had a conditional p value less than the locus-specific significance. Sequential conditional analyses were performed for each race/ethnicity and transethnic meta-analysis. Further details on our approach to locus refinement are provided in the ESM under the fine-mapping of known glycaemic trait loci section.
Fig. 1.

PAGE Metabochip Study Design. Primary results presented were from models including BMI as a covariate. Supplement includes results from models without BMI as a covariate.
Table 1.
Characterization of 15 fine-mapping genomic regions analysed for fasting glucose and fasting insulin
| Chr | Locus | Base pair range (GRCh37/hg19) |
N SNPs on Metabochip |
N SNPsa | α | Trait |
|---|---|---|---|---|---|---|
| 1q32.3 | PROX1 | 214124818–214167508 | 153 | 129 | 3.9×10⁻⁴ | glucose |
| 2p23.3 | GCKR | 27389634–27951658 | 1099 | 966 | 5.2×10⁻⁵ | both |
| 2q31.1 | G6PC2 | 169752640–169814655 | 240 | 211 | 2.4×10⁻⁴ | glucose |
| 3q21.1 | ADCY5 | 122976919–123206919 | 924 | 786 | 6.2×10⁻⁵ | glucose |
| 3q26.2 | SLC2A2 | 170532111–170769171 | 717 | 653 | 7.7×10⁻⁵ | glucose |
| 7p21.2 | DGKB | 14185088–15145520 | 3894 | 3555 | 1.4×10⁻⁵ | glucose |
| 7p13 | GCK | 44222003–44266077 | 148 | 122 | 4.1×10⁻⁴ | glucose |
| 9p24.2 | GLIS3 | 4243162–4310558 | 419 | 385 | 1.3×10⁻⁴ | glucose |
| 10q25.2 | ADRA2A/ TCF7L2 | 112967738–113053039 | 462 | 424 | 1.2×10⁻⁴ | glucose |
| 11p15.4 | CRY2 | 45706162–46162829 | 1082 | 921 | 5.4×10⁻⁵ | glucose |
| 11p11.2 | MADD | 46921641–48091303 | 2392 | 2037 | 2.5×10⁻⁵ | glucose |
| 11q12.2 | FADS2 | 61505583–61751624 | 726 | 643 | 7.8×10⁻⁵ | glucose |
| 11q14.3 | MTNR1B | 92667047–92725321 | 214 | 180 | 2.8×10⁻⁴ | glucose |
| 12q23.2 | IGF1 | 103851897–104450976 | 1307 | 1059 | 4.7×10⁻⁵ | insulin |
| 15q22.2 | C2CD4A | 62099182–62520109 | 1143 | 949 | 5.3×10⁻⁵ | glucose |
α = Bonferroni significance threshold (0.05/Number of SNPs passing QC) used to define region-specific significance; TE=Transethnic;
Number SNPs passing QC in the TE meta-analysis
Discovery of novel loci
Metabochip-wide analyses were performed to identify novel associations with fasting glucose and fasting insulin. Statistical significance for the Metabochip-wide analysis was set at 0.05 divided by the number of Metabochip SNPs passing QC (α=5.0×10⁻⁸). Results were examined through qq plots and Manhattan plots for each model, highlighting known regions defined in ESM Table 4. Further details are provided in the ESM under the strategy for selecting novel associations section.
Statistical analysis
First, each study with unrelated individuals performed race/ethnic specific analyses for fasting glucose and natural log-transformed fasting insulin excluding ancestry outliers and first-degree relatives. In HCHS/SOL, a weighted version of generalized estimation equations was used to account for unequal inclusion probabilities and complex family-based sampling designs [18]. Models adjusted for age, sex (except WHI), study site (as applicable), smoking status (current versus former/never), continuous BMI, and ancestry PCs. Like previous studies [11], primary analyses adjusted for BMI because it is a major risk factor for type 2 diabetes and is correlated with glycaemic traits. For comparison, all models were also run without adjustment for BMI. Next, fixed-effect models with inverse variance weighting were used to pool the study-specific SNP effect estimates and their standard errors by race/ethnicity as implemented in METAL [19]. Finally, summary statistics from METAL for H/L, AA, NA/AI and ASN were combined using inverse-variance weighted fixed effects meta-analysis in METAL. Q-statistics and I2 were used to evaluate heterogeneity across studies and race/ethnicity. Further details are provided in ESM under the statistical analysis section.
Functional annotation
Detailed information on the functional annotation methods and various datasets used is provided in the ESM under the functional annotation section. In brief, it is expected that the lead SNPs are more likely to be functional or to be in stronger LD with underlying functional variant(s). Therefore, lead SNPs and all correlated SNPs (r2>0.2 in 1000 Genomes Phase 3 AFR/AMR populations) were annotated using publicly available functional datasets. Potential functional effects were assessed using PolyPhen2 for non-synonymous variants, SPANR [20] for variants near splice sites, TargetScan miRNA Regulatory Sites for 3’ UTR regions [21], ENCODE/NIH Roadmap data [22, 23], and GTEx [24] to identify non-coding variants positioned in predicted regulatory elements.
Results
Demographics
We included a total of 26,760 participants (14,953 H/L, 10,380 AA, 998 ASN, and 429 AI/AN individuals) in fasting glucose analyses. The sample sizes for fasting insulin analyses were slightly smaller with a total of 22,674 participants (12,895 H/L, 8,361 AA, 998 ASN, and 420 AI/AN, individuals). The mean age across the five cohorts was 55 years in men and 59 years in women, with a range from 18 to 93 years. Study specific descriptive statistics are shown in ESM Table 2. Particularly due to the inclusion of the Women’s Health Initiative, the proportion of females was higher, with the highest fraction of females observed in AA (82.6% female for fasting glucose and 97.1% female for fasting insulin). Glycaemic trait distributions were similar across studies and ethnicities, with average fasting glucose levels ranging from 4.7 ± 0.7 mmol/l to 5.5 ± 0.6 mmol/l and average fasting insulin levels ranging from 43.3 ± 23.6 pmol/l to 75.9 ± 38.8 pmol/l.
Generalization of European Glycaemic Trait Loci
We found that 31/39 (79.5%) fasting glucose loci and 14/17 (82.3%) fasting insulin loci had a p value smaller than 0.05. Index SNP associations were directionally consistent in our transethnic PAGE meta-analysis and only four SNPs had heterogeneity p values less than 0.05 (Table 2). The effect estimates (betas) of index SNPs in the transethnic meta-analysis were very similar to those published in Metabochip analysis European-descent individuals (Pearson’s r2=0.86, 95% confidence interval 0.78–0.91; p value<2.2×10⁻¹⁶; ESM Fig. 1). At three loci (WARS, GIPR, and DPYSLS) we observed replication in only H/L and not the transethnic meta-analysis. Interestingly, while the sample sizes were much smaller for Asians than for H/L and AA, the transethnic meta-analysis of the PROX1 index (rs340874) was only nominally significant and directionally consistent in the Asian samples. In the remaining loci that did not replicate in transethnic meta-analysis, nor the race/ethnic specific analyses, the effects were generally similar or at least in the same direction. Analyses without inclusion of BMI as a covariate were generally similar with slightly lower significance at some loci. Full summary statistics for models with and without BMI covariate are reported in ESM Tables 5 and 6.
Table 2.
Replication of European Metabochip index SNPs for 39 fasting glucose and 17 fasting insulin loci via transethnic (TE) meta-analysis
| Locus Gene |
Lead EUR | C/NC allele |
Coded Allele Frequency
|
Effect β of Coded Allele (SE)
|
Analyses with p value<0.05 |
p values TE Meta (Het.) |
||||||||
|---|---|---|---|---|---|---|---|---|---|---|---|---|---|---|
| EUR | H/L | AA | ASN | TE Meta | EUR | H/L | AA | ASN | TE Meta | |||||
| Fasting glucose loci (NTE=26,760, NEUR=118,881) | ||||||||||||||
| 1q32.3 | rs340874 | A/G | 0.48 | 0.60 | 0.82 | 0.61 | 0.67 | −0.015 | −0.004 | −0.009 | 0.076 | −0.003 | ASN | 0.59 (0.02) |
| PROX1 | (0.002) | (0.006) | (0.009) | (0.027) | (0.005) | |||||||||
| 2p23.3 | rs780094 | A/G | 0.39 | 0.35 | 0.19 | 0.52 | 0.30 | −0.029 | −0.033 | −0.016 | −0.051 | −0.029 | H/L, ASN, TE | 2×10⁻⁸ (0.2) |
| GCKR | (0.002) | (0.007) | (0.010) | (0.027) | (0.005) | |||||||||
| 2q31.1 | rs560887 | A/G | 0.30 | 0.17 | 0.07 | 0.03 | 0.14 | −0.075 | −0.086 | −0.063 | −0.065 | −0.079 | H/L, AA, TE | 1×10⁻²⁹ (0.48) |
| G6PC2 | (0.003) | (0.008) | (0.014) | (0.077) | (0.007) | |||||||||
| 3q21.1 | rs11708067 | A/G | 0.79 | 0.75 | 0.84 | 0.96 | 0.78 | 0.024 | 0.021 | 0.052 | −0.254 | 0.031 | H/L, AA, TE | 5×10⁻⁸ (0.02) |
| ADCY5 | (0.003) | (0.007) | (0.010) | (0.171) | (0.006) | |||||||||
| 3q26.2 | rs1280 | A/G | 0.86 | 0.84 | 0.65 | 0.97 | 0.73 | 0.031 | 0.052 | −0.001 | 0.043 | 0.021 | H/L, TE | 1×10⁻⁴ (2×10⁻⁵) |
| SLC2A2 | (0.003) | (0.009) | (0.007) | (0.082) | (0.006) | |||||||||
| 7p21.2 | rs2191349 | A/C | 0.53 | 0.48 | 0.57 | 0.69 | 0.51 | 0.032 | 0.023 | 0.005 | 0.003 | 0.017 | H/L, TE | 8×10⁻⁴ (0.42) |
| DGKB | (0.002) | (0.006) | (0.009) | (0.028) | (0.005) | |||||||||
| 7p13 | rs730497 | A/G | 0.16 | 0.20 | 0.18 | 0.18 | 0.20 | 0.061 | 0.061 | 0.056 | 0.004 | 0.057 | H/L, AA, TE | 3×10⁻²² (0.37) |
| GCK | (0.003) | (0.008) | (0.009) | (0.034) | (0.006) | |||||||||
| 8q24.11 | rs11558471 | A/G | 0.68 | 0.75 | 0.90 | 0.57 | 0.77 | 0.032 | 0.018 | 0.014 | −0.004 | 0.017 | H/L, TE | 4×10⁻³ (0.22) |
| SLC30A8 | (0.002) | (0.007) | (0.012) | (0.026) | (0.006) | |||||||||
| 9p24.2 | rs10814916 | A/C | 0.49 | 0.43 | 0.33 | 0.54 | 0.40 | −0.017 | −0.016 | −0.009 | −0.066 | −0.015 | H/L, ASN, TE | 1×10⁻³ (0.21) |
| GLIS3 | (0.002) | (0.006) | (0.008) | (0.027) | (0.005) | |||||||||
| 10q25.2 | rs11195502 | A/G | 0.09 | 0.13 | 0.34 | 0.07 | 0.25 | −0.036 | −0.014 | −0.012 | −0.022 | −0.013 | TE | 0.04 (0.62) |
| ADRA2A | (0.004) | (0.010) | (0.008) | (0.054) | (0.006) | |||||||||
| 10q25.2 | rs4506565 | A/T | 0.70 | 0.71 | 0.56 | 0.93 | 0.64 | −0.024 | −0.030 | −0.019 | −0.137 | −0.025 | All | 3×10⁻⁷ (0.19) |
| TCF7L2 | (0.002) | (0.007) | (0.007) | (0.060) | (0.005) | |||||||||
| 11p11.2 | rs11605924 | A/C | 0.49 | 0.54 | 0.86 | 0.81 | 0.63 | 0.022 | 0.017 | 0.027 | −0.066 | 0.018 | All | 1×10⁻³ (0.03) |
| CRY2 | (0.002) | (0.006) | (0.011) | (0.034) | (0.005) | |||||||||
| 11p11.2 | rs11039182 | A/G | 0.73 | 0.82 | 0.95 | 0.97 | 0.85 | 0.023 | 0.000 | 0.021 | −0.002 | 0.004 | None | 0.55 (0.67) |
| MADD | (0.003) | (0.009) | (0.016) | (0.091) | (0.007) | |||||||||
| 11q12.2 | rs174550 | A/G | 0.66 | 0.52 | 0.91 | 0.57 | 0.60 | 0.018 | 0.026 | 0.036 | 0.039 | 0.029 | H/L, AA, TE | 7×10⁻⁷ (0.9) |
| FADS2 | (0.002) | (0.007) | (0.013) | (0.027) | (0.006) | |||||||||
| 11q14.3 | rs10830963 | C/G | 0.71 | 0.79 | 0.93 | 0.60 | 0.81 | −0.078 | −0.062 | −0.090 | −0.078 | −0.068 | All | 7×10⁻²⁷ (0.21) |
| MTNR1B | (0.003) | (0.008) | (0.014) | (0.026) | (0.006) | |||||||||
| 15q22.2 | rs4502156 | A/G | 0.55 | 0.40 | 0.26 | 0.52 | 0.35 | 0.023 | 0.017 | 0.006 | 0.008 | 0.012 | H/L, TE | 0.01 (0.77) |
| C2CD4A | (0.002) | (0.007) | (0.008) | (0.026) | (0.005) | |||||||||
| 9p21.3 | rs10811661 | A/G | 0.82 | 0.86 | 0.93 | 0.56 | 0.86 | 0.024 | 0.021 | 0.017 | 0.072 | 0.024 | H/L, ASN, TE | 0.02 (0.29) |
| CDKN2B | (0.003) | (0.009) | (0.014) | (0.026) | (0.007) | |||||||||
| 5q15 | rs4869272 | A/G | 0.69 | 0.75 | 0.78 | 0.73 | 0.76 | 0.018 | 0.021 | 0.019 | 0.032 | 0.020 | H/L, AA, TE | 1×10⁻³ (0.97) |
| PCSK1 | (0.002) | (0.007) | (0.008) | (0.029) | (0.005) | |||||||||
| 13q12.2 | rs11619319 | A/G | 0.77 | 0.71 | 0.83 | 0.55 | 0.75 | −0.020 | −0.008 | −0.017 | −0.054 | −0.012 | AA, ASN, TE | 0.05 (0.32) |
| PDX1 | (0.002) | (0.007) | (0.010) | (0.026) | (0.006) | |||||||||
| 8p23.1 | rs983309 | A/C | 0.12 | 0.21 | 0.28 | 0.02 | 0.24 | 0.026 | 0.023 | 0.017 | 0.004 | 0.020 | H/L, AA, TE | 2×10⁻³ (0.96) |
| PPP1R3B | (0.003) | (0.008) | (0.008) | (0.104) | (0.006) | |||||||||
| 7p12.1 | rs6943153 | A/G | 0.34 | 0.45 | 0.68 | 0.28 | 0.54 | 0.015 | 0.019 | −0.004 | −0.010 | 0.009 | H/L, TE | 0.07 (0.11) |
| GRB10 | (0.002) | (0.006) | (0.008) | (0.030) | (0.005) | |||||||||
| 11q13.4 | rs11603334 | A/G | 0.17 | 0.08 | 0.05 | 0.05 | 0.07 | −0.019 | −0.030 | −0.039 | −0.086 | −0.033 | H/L, AA, TE | 1×10⁻⁵ (0.69) |
| ARAP1 | (0.003) | (0.011) | (0.016) | (0.067) | (0.009) | |||||||||
| 20p11.21 | rs6113722 | A/G | 0.04 | 0.05 | 0.16 | 0.18 | 0.13 | −0.035 | −0.042 | −0.040 | −0.090 | −0.043 | All | 2×10⁻⁶ (0.55) |
| FOXA2 | (0.005) | (0.014) | (0.010) | (0.033) | (0.008) | |||||||||
| 9q31.3 | rs16913693 | A/C | 0.97 | 0.96 | 0.77 | 1 | 0.81 | 0.043 | 0.010 | −0.012 | 0.334 | −0.008 | None | 0.51 (0.48) |
| IKBKAP | (0.007) | (0.017) | (0.008) | (0.333) | (0.008) | |||||||||
| 9q34.3 | rs3829109 | A/G | 0.29 | 0.33 | 0.17 | 0.13 | 0.28 | −0.017 | −0.021 | −0.026 | 0.000 | −0.022 | H/L, AA, TE | 5×10⁻⁴ (0.91) |
| DNLZ | (0.003) | (0.007) | (0.010) | (0.040) | (0.006) | |||||||||
| 14q32.2 | rs3783347 | A/C | 0.21 | 0.12 | 0.06 | 0.1 | 0.11 | −0.017 | −0.023 | 0.000 | 0.000 | −0.014 | H/L | 0.08 (0.40) |
| WARS | (0.003) | (0.010) | (0.014) | (0.044) | (0.008) | |||||||||
| 19q13.32 | rs2302593 | C/G | 0.5 | 0.51 | 0.28 | 0.39 | 0.42 | 0.014 | −0.013 | −0.002 | 0.019 | −0.008 | H/L | 0.05 (0.55) |
| GIPR | (0.002) | (0.006) | (0.008) | (0.027) | (0.005) | |||||||||
| 6p22.3 | rs9368222 | A/C | 0.28 | 0.23 | 0.19 | 0.41 | 0.23 | 0.014 | 0.025 | 0.025 | 0.041 | 0.026 | H/L, AA, TE | 3×10⁻⁵ (0.94) |
| CDKAL1 | (0.002) | (0.007) | (0.009) | (0.026) | (0.006) | |||||||||
| 12q24.33 | rs10747083 | A/G | 0.66 | 0.69 | 0.85 | 0.83 | 0.74 | 0.013 | 0.010 | 0.012 | −0.017 | 0.010 | None | 0.12 (0.88) |
| P2RX2 | (0.002) | (0.007) | (0.011) | (0.034) | (0.006) | |||||||||
| 20q12 | rs6072275 | A/G | 0.16 | 0.12 | 0.08 | 0.02 | 0.11 | 0.016 | 0.021 | 0.019 | −0.075 | 0.021 | H/L, TE | 5×10⁻³ (0.53) |
| TOP1 | (0.003) | (0.010) | (0.013) | (0.121) | (0.008) | |||||||||
| 3q27.2 | rs7651090 | A/G | 0.69 | 0.7 | 0.46 | 0.7 | 0.59 | −0.013 | −0.011 | −0.011 | −0.023 | −0.011 | TE | 0.07 (0.90) |
| IGF2BP2 | (0.002) | (0.007) | (0.007) | (0.029) | (0.005) | |||||||||
| 13q13.1 | rs576674 | A/G | 0.85 | 0.68 | 0.4 | 0.85 | 0.56 | −0.017 | −0.026 | −0.014 | 0.054 | −0.019 | H/L, AA, TE | 7×10⁻⁴ (0.08) |
| KL | (0.003) | (0.007) | (0.007) | (0.038) | (0.005) | |||||||||
| 3p21.31 | rs11715915 | A/G | 0.32 | 0.21 | 0.24 | 0.08 | 0.22 | −0.012 | −0.007 | 0.003 | 0.053 | −0.002 | None | 0.59 (0.56) |
| AMT | (0.002) | (0.008) | (0.008) | (0.051) | (0.006) | |||||||||
| 6p24.3 | rs17762454 | A/G | 0.26 | 0.33 | 0.16 | 0.41 | 0.28 | 0.012 | 0.017 | 0.012 | 0.011 | 0.015 | H/L, TE | 0.02 (0.97) |
| RREB1 | (0.002) | (0.007) | (0.010) | (0.027) | (0.005) | |||||||||
| 5q13.3 | rs7708285 | A/G | 0.73 | 0.69 | 0.85 | 0.91 | 0.74 | −0.011 | −0.004 | 0.003 | 0.002 | −0.003 | None | 0.4 (0.47) |
| ZBED3 | (0.003) | (0.007) | (0.010) | (0.060) | (0.006) | |||||||||
| 12q13.3 | rs2657879 | A/G | 0.82 | 0.81 | 0.93 | NA | 0.83 | −0.012 | −0.011 | 0.016 | … | −0.005 | None | 0.43 (0.11) |
| GLS2 | (0.003) | (0.008) | (0.015) | (0.007) | ||||||||||
| 2p23.3 | rs1371614 | A/G | 0.25 | 0.38 | 0.35 | 0.16 | 0.36 | 0.020 | 0.021 | −0.006 | −0.021 | 0.009 | H/L | 0.03 (0.05) |
| DPYSL5 | (0.004) | (0.007) | (0.007) | (0.036) | (0.005) | |||||||||
| 15q22.2 | rs12440695* | A/G | 0.63 | 0.57 | 0.83 | 0.71 | 0.65 | 0.008 | 0.004 | −0.002 | −0.011 | 0.003 | None | 0.63 (0.58) |
| C2CD4B | (0.003) | (0.007) | (0.009) | (0.028) | (0.005) | |||||||||
| 11p11.2 | rs1483121 | A/G | 0.14 | 0.09 | 0.03 | 0.03 | 0.08 | −0.027 | 0.008 | −0.022 | −0.101 | 0.002 | None | 0.59 (0.62) |
| OR4S1 | (0.005) | (0.011) | (0.022) | (0.220) | (0.010) | |||||||||
|
| ||||||||||||||
| Locus Gene | Lead EUR | C/NC allele | Coded Allele Frequency
|
Effect β of Coded Allele (SE)
|
Analyses with p value<0.05 | p values TE Meta (Het.) | ||||||||
| EUR | H/L | AA | ASN | TE Meta | EUR | H/L | AA | ASN | TE Meta | |||||
|
| ||||||||||||||
| Fasting insulin loci (NTE=22,674, NEUR=99,029) | ||||||||||||||
| 1q41 | rs4846565 | A/G | 0.33 | 0.41 | 0.09 | 0.34 | 0.32 | −0.013 | −0.023 | −0.007 | 0.022 | −0.017 | H/L, TE | 0.01 (0.34) |
| LYPLAL1 | (0.002) | (0.008) | (0.013) | (0.028) | (0.007) | |||||||||
| 2p23.3 | rs780094 | A/G | 0.39 | 0.35 | 0.19 | 0.52 | 0.30 | −0.029 | −0.031 | −0.029 | −0.011 | −0.030 | H/L, AA, TE | 2×10⁻⁷ (0.41) |
| GCKR | (0.002) | (0.008) | (0.010) | (0.027) | (0.006) | |||||||||
| 2q24.3 | rs10195252 | A/G | 0.60 | 0.67 | 0.28 | 0.89 | 0.49 | 0.017 | 0.041 | 0.036 | −0.044 | 0.037 | H/L, AA, TE | 1×10⁻¹⁰ (0.29) |
| GRB14 | (0.002) | (0.008) | (0.008) | (0.044) | (0.006) | |||||||||
| 2q36.3 | rs2943645 | A/G | 0.63 | 0.74 | 0.63 | 0.90 | 0.68 | 0.019 | 0.018 | 0.012 | 0.062 | 0.016 | H/L, TE | 4×10⁻³ (0.54) |
| IRS1 | (0.002) | (0.009) | (0.008) | (0.046) | (0.006) | |||||||||
| 3p25.2 | rs17036328 | A/G | 0.86 | 0.89 | 0.83 | 0.95 | 0.85 | 0.021 | 0.038 | 0.009 | 0.036 | 0.022 | H/L, TE | 2×10⁻³ (0.15) |
| PPARG | (0.003) | (0.012) | (0.010) | (0.068) | (0.007) | |||||||||
| 4q22.1 | rs3822072 | A/G | 0.48 | 0.44 | 0.51 | 0.63 | 0.47 | 0.012 | 0.008 | 0.018 | 0.024 | 0.012 | AA, TE | 0.04 (0.82) |
| FAM13A | (0.002) | (0.008) | (0.010) | (0.028) | (0.006) | |||||||||
| 4q24 | rs974801 | A/G | 0.62 | 0.58 | 0.72 | 0.40 | 0.64 | −0.014 | −0.018 | −0.009 | −0.023 | −0.015 | H/L, TE | 6×10⁻³ (0.31) |
| TET2 | (0.002) | (0.008) | (0.008) | (0.027) | (0.006) | |||||||||
| 4q32.1 | rs6822892 | A/G | 0.68 | 0.59 | 0.27 | 0.70 | 0.45 | 0.014 | 0.012 | 0.003 | 0.009 | 0.009 | None | 0.12 (0.76) |
| PDGFC | (0.002) | (0.008) | (0.008) | (0.029) | (0.006) | |||||||||
| 5q11.2 | rs4865796 | A/G | 0.67 | 0.79 | 0.75 | 0.81 | 0.77 | 0.015 | 0.016 | 0.024 | 0.006 | 0.020 | AA, TE | 9×10⁻⁴ (0.80) |
| ARL15 | (0.002) | (0.009) | (0.008) | (0.036) | (0.006) | |||||||||
| 5q11.2 | rs459193 | A/G | 0.27 | 0.27 | 0.42 | 0.52 | 0.36 | −0.015 | −0.025 | −0.022 | −0.040 | −0.022 | All | 4×10⁻⁵ (0.30) |
| ANKRD55 | (0.002) | (0.009) | (0.008) | (0.026) | (0.006) | |||||||||
| 6p21.31 | rs6912327 | A/G | 0.80 | 0.69 | 0.35 | NA | 0.51 | 0.016 | 0.004 | −0.004 | … | 0.001 | None | 0.83 (0.08) |
| UHRF1BP1 | (0.003) | (0.008) | (0.008) | (0.006) | ||||||||||
| 6q22.33 | rs2745353 | A/G | 0.51 | 0.58 | 0.60 | 0.61 | 0.59 | 0.011 | 0.016 | 0.010 | −0.039 | 0.011 | H/L, TE | 0.03 (0.25) |
| RSPO3 | (0.002) | (0.008) | (0.008) | (0.027) | (0.005) | |||||||||
| 7q11.23 | rs1167800 | A/G | 0.54 | 0.67 | 0.84 | 0.69 | 0.73 | 0.011 | 0.018 | 0.009 | −0.004 | 0.011 | H/L | 0.08 (0.07) |
| HIP1 | (0.002) | (0.008) | (0.010) | (0.028) | (0.006) | |||||||||
| 8p23.1 | rs983309 | A/C | 0.13 | 0.21 | 0.28 | 0.02 | 0.25 | 0.022 | 0.026 | 0.024 | −0.082 | 0.026 | All | 2×10⁻⁵ (0.02) |
| PPP1R3B | (0.003) | (0.010) | (0.008) | (0.103) | (0.006) | |||||||||
| 10q25.2 | rs7903146 | A/G | 0.27 | 0.25 | 0.28 | 0.08 | 0.27 | −0.013 | −0.014 | −0.022 | 0.023 | −0.019 | AA, TE | 1×10⁻³ (0.51) |
| TCF7L2 | (0.002) | (0.009) | (0.008) | (0.057) | (0.006) | |||||||||
| 12q23.2 | rs35767 | A/G | 0.18 | 0.24 | 0.44 | 0.33 | 0.36 | −0.003 | −0.014 | 0.006 | −0.050 | −0.004 | None | 0.43 (0.28) |
| IGF1 | (0.003) | (0.011) | (0.008) | (0.032) | (0.006) | |||||||||
| 19q13.11 | rs731839 | A/G | 0.66 | 0.61 | 0.63 | 0.48 | 0.61 | −0.015 | −0.016 | −0.003 | −0.037 | −0.012 | H/L, TE | 0.03 (0.23) |
| PEPD | (0.002) | (0.008) | (0.008) | (0.026) | (0.005) | |||||||||
EUR, European-descent individuals from Scott et al. genotyped on Metabochip. Models included continuous BMI covariate,
rs12440695 used as an LD proxy (r2=0.98) for the index SNP rs11071657, which did not pass QC; β: allelic effect size for an additive genetic model corresponding to the coded (C) allele, in units of mmol/l for fasting glucose, and natural log transformed pmol/l for fasting insulin. p values shown for the transethnic meta-analysis and heterogeneity (Het.) in effect across populations. Full results for models with and without BMI covariate for fasting glucose and fasting insulin are shown in ESM Tables 5 and 6, respectively.
Fine-mapping of European glycaemic trait loci
Among the 15 glycaemic trait loci attempted to be fine-mapped on the Metabochip, 10 fasting glucose loci and 2 fasting insulin had one or more SNPs that reached locus-specific significance (α = 0.05/number of SNPs in the locus) in the transethnic meta-analysis. P values ranged from 1.0×10⁻²⁹ at G6PC2-rs560887 to 1.5×10⁻⁴ at PROX1-rs10494973 (Table 3). Although AI/AN ancestries were included in the transethnic meta-analysis, the AI/AN results are not shown because the small sample size was underpowered for population-specific analysis. At four fasting glucose loci, the most significant lead SNP in PAGE transethnic meta-analysis was the same as the European index SNP from prior Metabochip evaluation (G6PC2, ADCY5, MTNR1B, and FADS2). For six fasting glucose loci (PROX1, GCKR, SLC2A2, DGKB, GCK, and GLIS3) and the one fasting insulin locus (GCKR), the lead SNP in PAGE transethnic meta-analysis was in moderate or weak LD with the index SNP in 1000 Genomes Population EUR (r2>0.2). At these 6 loci, the PAGE lead SNP and EUR index SNP were not independent of each other as only one of the two SNP associations maintained nominal significance in transethnic conditional meta-analysis where both lead and index variants were included in the model. This was further supported by investigation of potential fine-mapping through locus zoom plots.
Table 3.
Most significant lead SNPs in 10 fasting glucose and 2 fasting insulin fine-mapping loci identified in transethnic (TE) meta-analysis
| Region | Lead PAGE SNP |
Frequency of Coded (C) Allele
|
Effect β of Coded Allele (SE)
|
p values
|
r2 with EUR Index SNP c
|
No. LD SNPs e
|
||||||||||||||
|---|---|---|---|---|---|---|---|---|---|---|---|---|---|---|---|---|---|---|---|---|
| C/N | TE a | EUR | H/L | AA | ASN | TE Meta |
H/L | AA | ASN | TE Meta b | Het. | EUR SNP d | EUR | H/L | AA | ASN | EUR | TE (% red.)f |
||
| Fasting glucose loci | ||||||||||||||||||||
| 1q32.3 | rs10494973 | C/G | 0.03 | 0.48 | 0.03 | 0.01 | 0.01 | 0.060 | 0.050 | 0.100 | −0.274 | 2×10⁻⁴ | 0.44 | rs340874 | <0.10 | <0.10 | <0.10 | <0.10 | 4 | 1 (75) |
| PROX1 | (0.016) | (0.018)** | (0.036)** | (0.384) | ||||||||||||||||
| 2p23.3 | rs1260326 | A/G | 0.29 | 0.41 | 0.34 | 0.15 | 0.52 | −0.032 | −0.036 | −0.020 | −0.051 | 2×10⁻⁹ | 0.44 | rs780094 | 0.92 | 0.91 | 0.42 | 0.93 | 274 | 90 (67) |
| GCKR | (0.005) | (0.007)*** | (0.010)* | (0.026)* | ||||||||||||||||
| 2q31.1 | rs560887 | A/G | 0.14 | 0.31 | 0.17 | 0.07 | 0.03 | −0.079 | −0.086 | −0.063 | −0.065 | 1×10⁻²⁹ | 0.48 | Same | 1 | 1 | 1 | 1 | 118 | 9 (92) |
| G6PC2 | (0.007) | (0.008)*** | (0.014)*** | (0.077) | ||||||||||||||||
| 3q21.1 | rs11708067 | A/G | 0.78 | 0.82 | 0.75 | 0.84 | 0.97 | 0.031 | 0.021 | 0.052 | −0.254 | 5×10⁻⁸ | 0.02 | Same | 1 | 1 | 1 | 1 | 72 | 18 (75) |
| ADCY5 | (0.006) | (0.007)** | (0.010)*** | (0.171) | ||||||||||||||||
| 3q26.2 | rs1604038 | A/G | 0.44 | 0.29 | 0.34 | 0.58 | 0.23 | −0.026 | −0.031 | −0.023 | 0.037 | 1×10⁻⁷ | 0.2 | rs1280 | 0.38 | 0.45 | 0.34 | 0.09 | 318 | 162 |
| SLC2A2 | (0.005) | (0.007)*** | (0.007)** | (0.032) | (49) | |||||||||||||||
| 7p21.2 | rs62448618 | A/T | 0.34 | 0.50 | 0.38 | 0.27 | 0.50 | 0.022 | 0.030 | 0.014 | −0.001 | 1×10⁻⁵ | 0.33 | rs2191349 | 0.81 | 0.61 | 0.03 | 0.39 | 133 | 12 (91) |
| DGKB | (0.005) | (0.007)*** | (0.008) | (0.026) | ||||||||||||||||
| 7p13 | rs2908286 | A/G | 0.19 | 0.18 | 0.2 | 0.18 | 0.20 | 0.060 | 0.064 | 0.061 | 0.002 | 9×10⁻²⁵ | 0.27 | rs730497 | 0.99 | 0.9 | 0.52 | 0.91 | 25 | 18 (28) |
| GCK | (0.006) | (0.008)*** | (0.009)*** | (0.032) | ||||||||||||||||
| 9p24.2 | rs10974438 | A/C | 0.76 | 0.62 | 0.71 | 0.86 | 0.63 | −0.023 | −0.019 | −0.021 | −0.080 | 6×10⁻⁵ | 0.16 | rs10814916 | 0.53 | 0.27 | 0.08 | 0.69 | 54 | 7 (87) |
| GLIS3 | (0.006) | (0.007)** | (0.010)* | (0.028)** | ||||||||||||||||
| 11q12.2 | rs174547 | A/G | 0.60 | 0.66 | 0.52 | 0.91 | 0.55 | 0.029 | 0.026 | 0.038 | 0.039 | 4×10⁻⁷ | 0.86 | Same | 1 | 1 | 1 | 1 | 147 | 44 (70) |
| FADS2 | (0.006) | (0.007)*** | (0.013)** | (0.027) | ||||||||||||||||
| 11q14.3 | rs10830963 | C/G | 0.81 | 0.78 | 0.79 | 0.93 | 0.59 | −0.068 | −0.062 | −0.090 | −0.078 | 7×10⁻²⁷ | 0.21 | Same | 1 | 1 | 1 | 1 | 94 | 1 (99) |
| MTNR1B | (0.006) | (0.008)*** | (0.014)*** | (0.026)** | ||||||||||||||||
| Fasting insulin loci | ||||||||||||||||||||
| 2p23.3 | rs1260326 | A/G | 0.29 | 0.41 | 0.35 | 0.16 | 0.52 | −0.035 | −0.034 | −0.034 | −0.010 | 1×10⁻⁸ | 0.20 | rs780094 | 0.92 | 0.91 | 0.42 | 0.93 | 274 | 90 (67) |
| GCKR | (0.006) | (0.008)*** | (0.010)*** | (0.027) | ||||||||||||||||
| 12q23.2 | rs10860845 | A/C | 0.6 | 0.83 | 0.48 | 0.74 | 0.65 | −0.023 | −0.025 | −0.023 | 0.002 | 3×10⁻⁵ | 0.76 | rs860598 | <0.10 | <0.10 | <0.10 | <0.10 | 322 | 64 (80) |
| IGF1 | (0.006) | (0.008)*** | (0.008)** | (0.028) | ||||||||||||||||
AA, African Ancestries including African Americans; H/L, Hispanics/Latinos; ASN, Asian/Pacific Islanders; EUR, Europeans;
Significant at region-specific Bonferroni corrected p values (ranging from α=1.41×10⁻⁵ to α=4.1×10⁻⁴); β: effect size from an additive multivariate model including BMI and corresponding to the coded (C) allele, in units of mmol/l for fasting glucose, and natural log transformed pmol/l for fasting insulin;
Minor allele frequency averaged across ethnicities H/L, AI/AN, and ASN from the TE meta-analysis for coded allele.
p value from the transethnic meta-analysis
LD calculated from 1000 genomes Phase 3 super populations (EUR, AFR, AMR, and ASN);
European SNP index defined as most significant SNP from the Scott et al. Metabochip analysis.
Number of SNPs in LD using r2>0.2 calculated from 1000 genomes Phase 3 super populations with TE equal to the intersect of SNPs in EUR, AFR, AMR and ASN.
% reduction in the number of SNPs
indicate significance for race/ethnic specific analyses (*p<0.05, **p<0.01, ***p<0.001).
For each of the 11 glycaemic trait loci with potential transethnic fine-mapping (fasting glucose loci—PROX1, G6PC2, ADCY5, MTNR1B, FADS2, GCKR, SLC2A2, DGKB, GCK, and GLIS3; fasting insulin locus—GCKR), we found that the number of SNPs in LD with the most significant marker in the transethnic results (r2≥0.2 in the 1KG super populations AFR and AMR) were less than the number of SNPs tagged by the EUR marker (r2≥0.2 in EUR). Visual inspection of locus zoom plots indicated that transethnic meta-analysis refined each of these loci by (1) reducing the number of highly correlated SNPs reaching the same level of significance, and/or (2) narrowing the genomic region containing putative causal SNPs (ESM Fig. 2). On average the number of variants in high LD was reduced by 72.5% with the number of LD SNPs ranging from 1 at MTNR1B to 162 at SLC2A2 in the PAGE transethnic meta-analysis results. Refinement was most evident at the SLC2A2 locus (Fig. 2). Bioinformatic functional follow-up was performed for each of the eleven glycaemic trait loci with one or more variants passing region-specific significance threshold in our transethnic meta-analysis. We observed an overlap of promoter and enhancer sequences at each locus and identified potential target genes. These data not only provided further support for the fine-mapping results but also revealed additional insights into etiology of glycaemic traits. UCSC Genome Browser images of each locus are provided in ESM Fig. 3. The results of our in silico functional annotations are summarised in ESM Table 7.
Fig. 2.
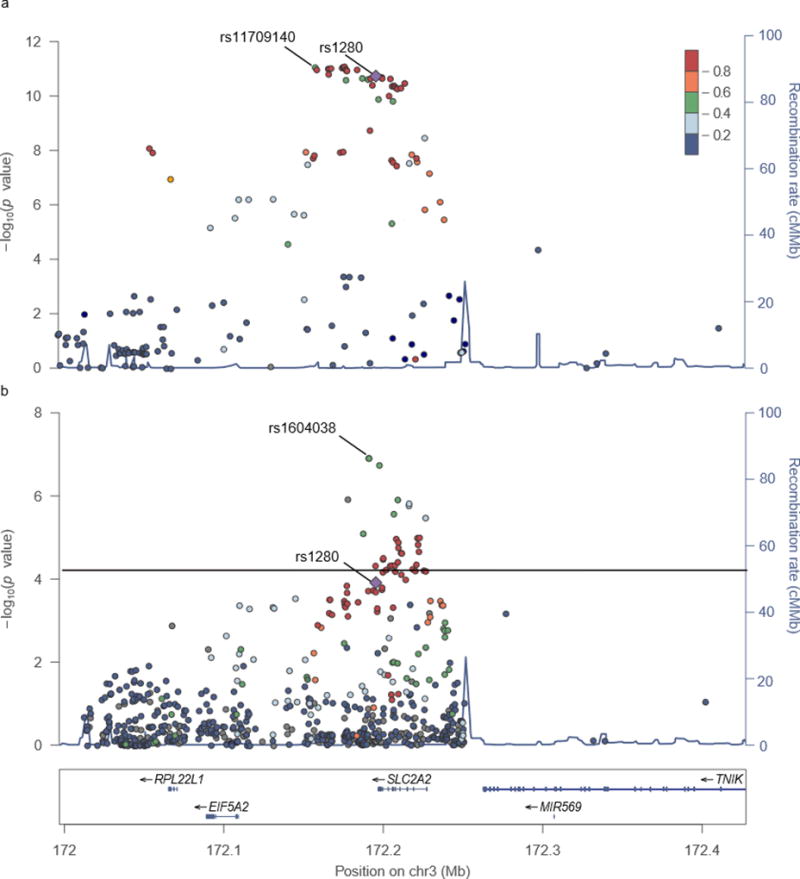
SLC2A2 Regional Plot. Regional plots of SNP associations (-log10 p value) with fasting glucose are shown for the MAGIC Europeans (Fig. 3a) and the PAGE transethnic (TE) (Fig. 3b) meta-analyses. Not all SNPs used in the transethnic meta-analysis were present in the available MAGIC data (http://www.magicinvestigators.org/downloads/) due to mapping issues [16]. SNPs not passing QC or outside of fine-mapping region were removed from the TE plots. The colour scale legend indicates linkage disequilibrium (r2) between each fine-mapping SNP and the GWAS index SNP (rs1280, purple diamond), which was calculated using 1000 Genomes Populations (CEU for MAGIC and AMR for PAGE). The population chosen for LD colouring in the transethnic meta-analysis was based on population-specific analysis results (choosing the one with strongest underlying SNP associations). Most significant SNP in MAGIC fine-mapping (rs11709140) and PAGE (rs1604038) are labeled.
Secondary associations at known glycaemic trait loci
In order to identify additional independent association signals at significant loci, conditional analyses were performed. Significant results of the conditional analyses and population-specific associations are shown in Table 4. For transethnic conditional meta-analyses, ten fasting glucose loci and two fasting insulin loci were analysed. Independent secondary associations were identified at two fasting glucose loci (G6PC2-rs477224, and GCK-rs2908286). The second round of conditional analyses did not identify significant tertiary signals. Bioinformatic follow-up of rs477224 suggests that the variant is positioned within a pancreatic islet enhancer. The rs2908290 variant was in weak LD (AMR r2=0.26, AFR r2=0.23) with a variant, rs2971677, predicted to alter splicing efficiency of GCK.
Table 4.
Independent secondary signals at known fasting glucose and fasting insulin loci
| Locus | Secondary SNPa |
Frequency of Coded (C) for secondary SNP
|
Effect of Coded (C) for secondary SNP
|
p value b | Primary SNP c | LD r2d | Cond. p value (Second./Primar.)e |
|||||||||
|---|---|---|---|---|---|---|---|---|---|---|---|---|---|---|---|---|
| C/N | TE | AA | H/L | AI/AN | ASN | TE | AA | H/L | AI/AN | ASN | ||||||
| Transethnic meta-analysis fasting glucose | ||||||||||||||||
| G6PC2 | rs477224 | A/G | 0.575 | 0.486 | 0.645 | 0.659 | 0.820 | −0.036 | −0.034 | −0.042 | 0.035 | −0.006 | 3×10⁻¹⁴ | rs560887 | <0.1 | 2×10⁻⁵/5×10−26 |
| (0.005) | (0.007)*** | (0.007)*** | (0.042) | (0.035) | ||||||||||||
| GCK | rs2908290 | A/G | 0.450 | 0.534 | 0.388 | 0.367 | 0.427 | 0.040 | 0.043 | 0.038 | −0.009 | 0.058 | 10×10−18 | rs2908286 | <0.1 | 2×10⁻⁸/6×10−16 |
| (0.005) | (0.007)*** | (0.006)*** | (0.041) | (0.027)* | ||||||||||||
| Population Specific - AA fasting glucose | ||||||||||||||||
| G6PC2 | rs77719485† | A/C | 0.976 | 0.973 | 0.996 | 0.995 | … | 0.138 | 0.143 | 0.115 | −0.046 | … | 6×10⁻¹¹ | rs560887 | <0.1 | 2×10⁻⁶/5×10−7 |
| (0.020) | (0.022)*** | (0.054) | (0.283) | |||||||||||||
Sequential conditional analysis performed on 10 fasting glucose and 2 fasting insulin loci.
Lead SNP from conditional analysis reaching locus specific significance.
p value from the secondary SNP not adjusted for the primary SNP;
Lead SNP from primary (unconditional) analysis;
LD r2 between primary and secondary SNP;
p values from conditional analysis;
In the AA fasting glucose analysis, rs77719485 was the most significant SNP in the locus and rs560887 was the second most significant. AA effects for, rs560887 are shown in Table 3.
indicate significance for race/ethnic specific analyses (*p<0.05, **p<0.01, ***p<0.001)
To identify population-specific loci, we conducted separate conditional analyses for significant loci in the primary H/L (GCKR-rs1260326, G6PC2-rs560887, SLC2A2-rs1280, DGKB-rs1005256, GCK-rs1799884, FADS3-rs12577276, MTNR1B-rs10830963, C2CD4A-rs7167881), AA (G6PC2-rs77719485, GCK-rs2908286, CRY2-rs117493014, MADD-rs77082299, ADCY5-rs11708067, MTNR1B-rs10830963), and Asian populations (GLIS3-rs4395942). A population-specific variant was detected in the AA analysis of the G6PC2 locus. The lead fasting glucose SNP, rs77719485, is less frequent in AA (MAF 2.4%), but rare or monomorphic in the other populations (MAF 0.4% in H/L). Like the transethnic lead SNP, rs560887, bioinformatic follow-up suggests that rs77719485 may impact splicing efficiency for exon 4 for of G6PC2.
Association testing outside of glycaemic trait fine-mapping regions to identify potential novel variants
In secondary analyses, we conducted Metabochip-wide scan to identify potential novel or pleiotropic variants given that the chip included variants with suggestive signals in established loci for many know metabolic traits. Models were run with and without BMI as a covariate (ESM Table 8, ESM Fig. 4–5). Using the Bonferroni significance threshold (0.05/182,055=2.7×10−7) we identified one novel association for fasting insulin (rs75862513, p value=4.3×10⁻⁸, Fig. 3) at the SLC17A2 locus previously associated with height and blood pressure [25, 26]. After BMI adjustment (ESM Fig. 5) the association was attenuated suggesting that the effects may be mediated by BMI.
Fig. 3.

Fasting insulin association p values for each Metabochip variant from the transethnic meta-analysis in model without BMI. The –log10 of p values for each SNP on the Metabochip is plotted against chromosomal positions. Gray and dark gray colouring of SNPs alternates by chromosome. Red squares represent the SNPs in previously reported glycaemic trait loci (within 1 Mb of index SNP n=28,580). Blue diamonds represent the novel SNP associations reaching Metabochip-wide significance (all are in the same locus). The solid line is the threshold for Metabochip-wide significance (0.05/174,898 = 2.9×10⁻⁷); dashed line is the threshold for genome-wide significance α = 5.0×10⁻⁸.
Discussion
In this large multi-ethnic study population of close to 30,000 participants, we used transethnic fine-mapping to narrow the list of putative causal variants for eleven glycaemic trait loci. On average, we observed a 72% reduction in the number of candidate SNPs, before bioinformatic follow-up. We further demonstrated that many of the genetic variants associated with glycaemic traits likely exert their effects through regulatory mechanisms (splicing or enhancer activity), and provide detailed annotations for subsequent laboratory follow-up. These regulatory annotations provide putative targets for laboratory follow-up (eg. genome editing) and important insights into strong targets for future therapeutic interventions. For example, this study found that the majority implicated enhancer elements were binding sites for the transcription factor FOXA2 in pancreatic islets, and previous studies have suggested that differential expression of FOXA2 is a genetic determinant of fasting glucose levels, as well as type 2 diabetes risk [27, 28]. Like the previous European Metabochip analysis, we found that rs6113722, which is positioned within a lncRNA adjacent to FOXA2, was associated (p value=3.2×10⁻⁸) with fasting glucose. As such, expression levels of FOXA2 could be a particularly important regulator of glucose homeostasis and a putative target for genome editing. Although clinical application of genome editing is in its infancy, in vivo studies have already demonstrated the utility of the CRISPR/Cas9 technique. For example, to mimic observations of the naturally occurring loss of function mutation in the LDL receptor antagonist PCSK9, a previous mouse study used CRISPR/Cas9 vectors to decrease in PCSK9 protein levels, which resulted in increased hepatic LDL receptor levels, and a subsequent decrease in blood cholesterol levels[29]. Identification of key targets, like FOXA2, and potential regulatory elements of these targets for laboratory follow-up is a critical first step in the translation of GWAS findings.
Analysis of known glycaemic trait loci in this diverse population study suggests the genetic determinants of glycaemic trait levels are likely to be similar across populations. In comparison to previous glycaemic trait studies conducted in diverse populations, [7, 30] the replication of effects across populations is more extensive, likely due to the size of this study population. Although most the European discovered loci were generalizable across populations, this study exemplified that analysis in diverse populations can both refine known loci, as well as help in the discovery of novel, sometimes population specific associations. For instance, in addition to the well-established splice variant rs560887 that has been robustly associated with fasting glucose, transethnic meta-analysis of the G6PC2 locus identified an additional signal that may implicate regulatory functionality in glycaemia-related tissues. At this same locus, a AA-specific variant, rs77719485, was found to be strongly associated with fasting glucose and like rs560887, [31] is predicted to have effects on splicing efficiency. By expanding our analysis to the entire Metabochip we discovered strong associations with SLC17A2, that had not previously been reported by the Scott et al. Metabochip analysis in Europeans. The rs75862513 is a relatively rare variant that appears to be monomorphic in Europeans, and was most frequent in the Asian (0.04-A), and H/L (0.001-A) of this study. If replicated in an independent dataset, this finding may represent a new locus not previously detected in European or AA specific analyses. These examples illustrate the power of transethnic analysis for locus refinement and novel discovery.
Particular strengths of this study include the large study size, high-density genotyping and representation of multiple diverse populations. In light of the heavy burden of hyperglycaemia in H/L and AA populations, this study begins to address the major gap in knowledge related to the genetic architecture of glycaemic traits in understudied American minority populations. The large study population, combined with new annotation resources, allowed transethnic fine-mapping and prediction of regulatory elements. However, there were several limitations that should be noted. Although this study included populations from four major racial/ethnic groups, the greatest proportions of participants were Hispanic/Latino and African American. As such, this study was limited in its ability to detect associations with more prominent effects in Asian populations [32, 33]. We also acknowledge that fine-mapping approaches only serve as an initial step in determining the underlying causal variant(s) driving association signals by prioritizing likely causal candidates for more onerous laboratory follow-up. To further meet this objective, functional elements and variants were identified using bioinformatics databases. However, given that the functional evidence detected by these datasets is incomplete, future functional studies are critical in determining the underlying causal variants. That being said, the combination of fine-mapping with bioinformatics data is particularly useful for reducing both the physical genomic regions of interest and prioritizing candidates for molecular characterization. Furthermore, the in silico approaches help to provide richer inferences into the biological mechanisms modulating fasting glucose and insulin levels. As such, fine-mapping is an essential step in functional interpretation of GWAS signals because laboratory follow-up of all possible variants in GWAS loci is prohibitively expensive and time-intensive.
This transethnic study comprehensively fine-mapped known common variants associated with concentrations of fasting glucose and insulin. Genomic regions harboring known risk variants were refined, novel functional candidates were proposed, new independent signals in previously fasting glucose-implicated genes were identified, and one novel locus was discovered. Thus, these results suggest that transethnic meta-analysis can help in translating GWAS results into new biological insight.
Supplementary Material
Acknowledgments
The Population Architecture Using Genomics and Epidemiology (PAGE) program is supported by CALiCo, MEC, WHI and the Coordinating Center. The contents of this paper are solely the responsibility of the authors and do not necessarily represent the official views of the NIH. The complete list of PAGE members can be found at PAGE website (http://www.pagestudy.org). The data and materials included in this report result from a collaboration between the following studies:
The Multiethnic Cohort study (MEC) characterization of epidemiological architecture.
The Mount Sinai BioMe™ Biobank.
“Epidemiology of putative genetic variants: The Women’s Health Initiative” study. The authors thank the WHI investigators and staff for their dedication, and the study participants for making the program possible. A full listing of WHI investigators can be found at: http://www.whiscience.org/publications/ WHI_investigators_shortlist.pdf.
The Genetic Epidemiology of Causal Variants Across the Life Course (CALiCo) program. The following studies contributed to this manuscript: The Atherosclerosis Risk in Communities (ARIC) Study. The authors thank the staff and participants of the ARIC study for their important contributions. The Coronary Artery Risk Development in Young Adults Study (CARDIA). The Hispanic Community Health Study/Study of Latinos.
Assistance with phenotype harmonisation, SNP selection and annotation, data cleaning, data management, integration and dissemination, and general study coordination was provided by the PAGE Coordinating Center. The authors gratefully acknowledge Dr. Ben Voight for sharing the Metabochip SNP linkage disequilibrium and minor allele frequency statistics estimated in the Malmö Diet and Cancer Study. The PAGE consortium thanks the staff and participants of all PAGE studies for their important contributions.
Funding
The Population Architecture Using Genomics and Epidemiology (PAGE) program is funded by the National Human Genome Research Institute (NHGRI), supported by U01HG004803 (CALiCo), U01HG004802 (MEC), U01HG004790 (WHI), and U01HG004801 (Coordinating Center), and their respective NHGRI ARRA supplements.
The Multiethnic Cohort study (MEC) characterization of epidemiological architecture is funded through the NHGRI PAGE program (U01HG004802 and its NHGRI ARRA supplement). The MEC study is funded through the National Cancer Institute (R37CA54281, R01 CA63, P01CA33619, U01CA136792, and U01CA98758).
Funding support for the “Epidemiology of putative genetic variants: The Women’s Health Initiative” study is provided through the NHGRI PAGE program (U01HG004790 and its NHGRI ARRA supplement). The WHI program is funded by the National Heart, Lung, and Blood Institute; NIH; and U.S. Department of Health and Human Services through contracts N01WH22110, 24152, 32100-2, 32105-6, 32108-9, 32111-13, 32115, 32118-32119, 32122, 42107-26, 42129-32, and 44221.
Funding support for the Genetic Epidemiology of Causal Variants Across the Life Course (CALiCo) program was provided through the NHGRI PAGE program (U01HG004803 and its NHGRI ARRA supplement). The following studies are funded by the following agencies: The Atherosclerosis Risk in Communities (ARIC) Study is carried out as a collaborative study supported by National Heart, Lung, and Blood Institute contracts (HHSN268201100005C, HHSN268201100006C, HHSN268201100007C, HHSN268201100008C, HSN268201100009C, HHSN268201100010C, HHSN268201100011C, and HHSN268201100012C), R01HL087641, R01HL59367 and R01HL086694; National Human Genome Research Institute contract U01HG004402; and National Institutes of Health contract HHSN268200625226C. Infrastructure was partly supported by Grant Number UL1RR025005, a component of the National Institutes of Health and NIH Roadmap for Medical Research. The Coronary Artery Risk Development in Young Adults Study (CARDIA) is supported by contracts HHSN268201300025C, HHSN268201300026C, HHSN268201300027C, HHSN268201300028C, HHSN268201300029C, and HHSN268200900041C from the National Heart, Lung, and Blood Institute (NHLBI), the Intramural Research Program of the National Institute on Aging (NIA), and an intra-agency agreement between NIA and NHLBI (AG0005).
The Hispanic Community Health Study/Study of Latinos was carried out as a collaborative study supported by contracts from the National Heart, Lung, and Blood Institute (NHLBI) to the University of North Carolina (N01-HC65233), University of Miami (N01-HC65234), Albert Einstein College of Medicine (N01-HC65235), Northwestern University (N01-HC65236), and San Diego State University (N01-HC65237). Additional support was provided by 1R01DK101855-01 and 13GRNT16490017. The following Institutes/Centers/Offices contribute to the HCHS/SOL through a transfer of funds to the NHLBI: National Center on Minority Health and Health Disparities, the National Institute of Deafness and Other Communications Disorders, the National Institute of Dental and Craniofacial Research, the National Institute of Diabetes and Digestive and Kidney Diseases, the National Institute of Neurological Disorders and Stroke, and the Office of Dietary Supplements.
The Mount Sinai BioMe Biobank is supported by The Andrea and Charles Bronfman Philanthropies.
Funding support for the PAGE Coordinating Center is provided through the NHGRI PAGE program (U01HG004801-01 and its NHGRI ARRA supplement). The National Institutes of Mental Health also contributes to the support for the Coordinating Center. The authors gratefully acknowledge Dr. Ben Voight for sharing the Metabochip SNP linkage disequilibrium and minor allele frequency statistics estimated in the Malmö Diet and Cancer Study. The PAGE consortium thanks the staff and participants of all PAGE studies for their important contributions.
Abbreviations
- AA
African Ancestry
- AI/AN
American Indian/Alaskan Native
- ARIC
Atherosclerosis Risk in Communities Study
- ASN
Asian and Pacific Islander
- BMI
Body Mass Index
- CARDIA
Coronary Artery Risk Development in Young Adults Study
- eQTL
Expression quantitative trait locus
- GWAS
Genome-wide association studies
- HCHS/SOL
Hispanic Community Health Study/Study of Latinos
- H/L
Hispanic/Latino
- Index variant
First reported variant in GWAS discovery
- LD
Linkage disequilibrium
- MAF
Minor allele frequency
- MAGIC
Meta-Analyses of Glucose and Insulin-related traits
- MEC
The Multiethnic Cohort
- NHGRI
National Human Genome Research Institute
- PAGE
Population Architecture using Genetic Epidemiology
- PC
Principal component
- QC
Quality Control
- SHARe
WHI SNP Health Association Resource
- SNP
Single-nucleotide polymorphism
- TE
Transethnic
- WHI
Women’s Health Initiative
Footnotes
The authors declare that there is no duality of interest associated with this manuscript.
Contribution statement
Each of the co-authors on this manuscript made substantial contributions in each of the three following areas 1) conception and design, acquisition of data, or analysis and interpretation of data; 2) drafting the article or revising it critically for important intellectual content; and 3) final approval of the version to be published. Charles Kooperberg and Stephanie Bien are responsible for the integrity of the work as a whole.
References
- 1.Guariguata L, Whiting DR, Hambleton I, et al. Global estimates of diabetes prevalence for 2013 and projections for 2035. Diabetes Res Clin Pract. 2014;103:137–149. doi: 10.1016/j.diabres.2013.11.002. [DOI] [PubMed] [Google Scholar]
- 2.Yki-Järvinen H. Pathogenesis of non-insulin-dependent diabetes mellitus. The Lancet. 1994;343:91–95. doi: 10.1016/s0140-6736(94)90821-4. [DOI] [PubMed] [Google Scholar]
- 3.Almgren P, Lehtovirta M, Isomaa B, et al. Heritability and familiality of type 2 diabetes and related quantitative traits in the Botnia Study. Diabetologia. 2011;54:2811–2819. doi: 10.1007/s00125-011-2267-5. [DOI] [PubMed] [Google Scholar]
- 4.Schousboe K, Visscher PM, Henriksen JE, et al. Twin study of genetic and environmental influences on glucose tolerance and indices of insulin sensitivity and secretion. Diabetologia. 2003;46:1276–1283. doi: 10.1007/s00125-003-1165-x. [DOI] [PubMed] [Google Scholar]
- 5.Dupuis J, Langenberg C, Prokopenko I, et al. New genetic loci implicated in fasting glucose homeostasis and their impact on type 2 diabetes risk. Nat Genet. 2010;42:105–116. doi: 10.1038/ng.520. [DOI] [PMC free article] [PubMed] [Google Scholar]
- 6.Manning AK, Hivert M-F, Scott RA, et al. A genome-wide approach accounting for body mass index identifies genetic variants influencing fasting glycemic traits and insulin resistance. Nat Genet. 2012;44:659–669. doi: 10.1038/ng.2274. [DOI] [PMC free article] [PubMed] [Google Scholar]
- 7.Fesinmeyer MD, Meigs JB, North KE, et al. Genetic variants associated with fasting glucose and insulin concentrations in an ethnically diverse population: results from the Population Architecture using Genomics and Epidemiology (PAGE) study. BMC Med Genet. 2013;14:98. doi: 10.1186/1471-2350-14-98. [DOI] [PMC free article] [PubMed] [Google Scholar]
- 8.Liu EY, Buyske S, Aragaki AK, et al. Genotype imputation of Metabochip SNPs using a study-specific reference panel of ~4,000 haplotypes in African Americans from the Women’s Health Initiative. Genet Epidemiol. 2012;36:107–117. doi: 10.1002/gepi.21603. [DOI] [PMC free article] [PubMed] [Google Scholar]
- 9.Rasmussen-Torvik LJ, Guo X, Bowden DW, et al. Fasting glucose GWAS candidate region analysis across ethnic groups in the Multiethnic Study of Atherosclerosis (MESA) Genet Epidemiol. 2012;36:384–391. doi: 10.1002/gepi.21632. [DOI] [PMC free article] [PubMed] [Google Scholar]
- 10.Voight BF, Kang HM, Ding J, et al. The metabochip, a custom genotyping array for genetic studies of metabolic, cardiovascular, and anthropometric traits. PLoS Genet. 2012;8:e1002793. doi: 10.1371/journal.pgen.1002793. [DOI] [PMC free article] [PubMed] [Google Scholar]
- 11.Scott RA, Lagou V, Welch RP, et al. Large-scale association analyses identify new loci influencing glycemic traits and provide insight into the underlying biological pathways. Nat Genet. 2012;44:991–1005. doi: 10.1038/ng.2385. [DOI] [PMC free article] [PubMed] [Google Scholar]
- 12.Matise TC, Ambite JL, Buyske S, et al. The Next PAGE in understanding complex traits: design for the analysis of Population Architecture Using Genetics and Epidemiology (PAGE) Study. Am J Epidemiol. 2011;174:849–859. doi: 10.1093/aje/kwr160. [DOI] [PMC free article] [PubMed] [Google Scholar]
- 13.Buyske S, Wu Y, Carty CL, et al. Evaluation of the metabochip genotyping array in African Americans and implications for fine mapping of GWAS-identified loci: the PAGE study. PLoS ONE. 2012;7:e35651. doi: 10.1371/journal.pone.0035651. [DOI] [PMC free article] [PubMed] [Google Scholar]
- 14.1000 Genomes Project Consortium. Abecasis GR, Auton A, et al. An integrated map of genetic variation from 1,092 human genomes. Nature. 2012;491:56–65. doi: 10.1038/nature11632. [DOI] [PMC free article] [PubMed] [Google Scholar]
- 15.Peterson LE. Partitioning large-sample microarray-based gene expression profiles using principal components analysis. Comput Methods Programs Biomed. 2003;70:107–119. doi: 10.1016/s0169-2607(02)00009-3. [DOI] [PubMed] [Google Scholar]
- 16.Purcell S, Neale B, Todd-Brown K, et al. PLINK: a tool set for whole-genome association and population-based linkage analyses. Am J Hum Genet. 2007;81:559–575. doi: 10.1086/519795. [DOI] [PMC free article] [PubMed] [Google Scholar]
- 17.Pruim RJ, Welch RP, Sanna S, et al. LocusZoom: regional visualization of genome-wide association scan results. Bioinformatics. 2010;26:2336–2337. doi: 10.1093/bioinformatics/btq419. [DOI] [PMC free article] [PubMed] [Google Scholar]
- 18.Lin D-Y, Tao R, Kalsbeek WD, et al. Genetic association analysis under complex survey sampling: the Hispanic Community Health Study/Study of Latinos. Am J Hum Genet. 2014;95:675–688. doi: 10.1016/j.ajhg.2014.11.005. [DOI] [PMC free article] [PubMed] [Google Scholar]
- 19.Willer CJ, Li Y, Abecasis GR. METAL: fast and efficient meta-analysis of genomewide association scans. Bioinformatics. 2010;26:2190–2191. doi: 10.1093/bioinformatics/btq340. [DOI] [PMC free article] [PubMed] [Google Scholar]
- 20.Xiong HY, Alipanahi B, Lee LJ, et al. RNA splicing. The human splicing code reveals new insights into the genetic determinants of disease. Science. 2015;347:1254806. doi: 10.1126/science.1254806. [DOI] [PMC free article] [PubMed] [Google Scholar]
- 21.Friedman RC, Farh KK-H, Burge CB, Bartel DP. Most mammalian mRNAs are conserved targets of microRNAs. Genome Res. 2009;19:92–105. doi: 10.1101/gr.082701.108. [DOI] [PMC free article] [PubMed] [Google Scholar]
- 22.Roadmap Epigenomics Consortium. Kundaje A, Meuleman W, et al. Integrative analysis of 111 reference human epigenomes. Nature. 2015;518:317–330. doi: 10.1038/nature14248. [DOI] [PMC free article] [PubMed] [Google Scholar]
- 23.ENCODE Project Consortium. An integrated encyclopedia of DNA elements in the human genome. Nature. 2012;489:57–74. doi: 10.1038/nature11247. [DOI] [PMC free article] [PubMed] [Google Scholar]
- 24.GTEx Consortium. The Genotype-Tissue Expression (GTEx) project. Nat Genet. 2013;45:580–585. doi: 10.1038/ng.2653. [DOI] [PMC free article] [PubMed] [Google Scholar]
- 25.He M, Xu M, Zhang B, et al. Meta-analysis of genome-wide association studies of adult height in East Asians identifies 17 novel loci. Hum Mol Genet. 2015;24:1791–1800. doi: 10.1093/hmg/ddu583. [DOI] [PMC free article] [PubMed] [Google Scholar]
- 26.Simino J, Shi G, Bis JC, et al. Gene-age interactions in blood pressure regulation: a large-scale investigation with the CHARGE, Global BPgen, and ICBP Consortia. Am J Hum Genet. 2014;95:24–38. doi: 10.1016/j.ajhg.2014.05.010. [DOI] [PMC free article] [PubMed] [Google Scholar]
- 27.Pasquali L, Gaulton KJ, Rodríguez-Seguí SA, et al. Pancreatic islet enhancer clusters enriched in type 2 diabetes risk-associated variants. Nat Genet. 2014;46:136–143. doi: 10.1038/ng.2870. [DOI] [PMC free article] [PubMed] [Google Scholar]
- 28.Ng MCY, Saxena R, Li J, et al. Transferability and fine mapping of type 2 diabetes loci in African Americans: the Candidate Gene Association Resource Plus Study. Diabetes. 2013;62:965–976. doi: 10.2337/db12-0266. [DOI] [PMC free article] [PubMed] [Google Scholar]
- 29.Ding Q, Strong A, Patel KM, et al. Permanent alteration of PCSK9 with in vivo CRISPR-Cas9 genome editing. Circ Res. 2014;115:488–492. doi: 10.1161/CIRCRESAHA.115.304351. [DOI] [PMC free article] [PubMed] [Google Scholar]
- 30.Liu C-T, Ng MCY, Rybin D, et al. Transferability and fine-mapping of glucose and insulin quantitative trait loci across populations: CARe, the Candidate Gene Association Resource. Diabetologia. 2012;55:2970–2984. doi: 10.1007/s00125-012-2656-4. [DOI] [PMC free article] [PubMed] [Google Scholar]
- 31.Baerenwald DA, Bonnefond A, Bouatia-Naji N, et al. Multiple functional polymorphisms in the G6PC2 gene contribute to the association with higher fasting plasma glucose levels. Diabetologia. 2013;56:1306–1316. doi: 10.1007/s00125-013-2875-3. [DOI] [PMC free article] [PubMed] [Google Scholar]
- 32.Wang H, Liu L, Zhao J, et al. Large scale meta-analyses of fasting plasma glucose raising variants in GCK, GCKR, MTNR1B and G6PC2 and their impacts on type 2 diabetes mellitus risk. PLoS ONE. 2013;8:e67665. doi: 10.1371/journal.pone.0067665. [DOI] [PMC free article] [PubMed] [Google Scholar]
- 33.Sakai K, Imamura M, Tanaka Y, et al. Replication study for the association of 9 East Asian GWAS-derived loci with susceptibility to type 2 diabetes in a Japanese population. PLoS ONE. 2013;8:e76317. doi: 10.1371/journal.pone.0076317. [DOI] [PMC free article] [PubMed] [Google Scholar]
Associated Data
This section collects any data citations, data availability statements, or supplementary materials included in this article.