

Abstract
Recent advances in neuroimaging techniques have provided significant insights into developmental trajectories of human brain function. Characterizations of typical neurodevelopment provide a framework for understanding altered neurodevelopment, including differences in brain function related to developmental disorders and psychopathology. Historically, most functional connectivity studies of typical and atypical development operate under the assumption that connectivity remains static over time. We hypothesized that relaxing stationarity assumptions would reveal novel features of both typical brain development related to children on the autism spectrum. We employed a ‘chronnectomic’ (recurring, time-varying patterns of connectivity) approach to evaluate transient states of connectivity using resting-state functional MRI in a population-based sample of 774 6-to-10 year-old children. Dynamic connectivity was evaluated using a sliding-window approach, and revealed four transient states. Inter-network connectivity increased with age in modularized dynamic states, illustrating an important pattern of connectivity in the developing brain. Furthermore, we demonstrated that higher levels of autistic traits, as well as ASD diagnosis, were associated with longer dwell times in a globally disconnected state. These results provide a roadmap to the chronnectomic organization of the developing brain and suggest that characteristics of functional brain connectivity are related to children on the autism spectrum.
Keywords: functional connectivity, dynamic connectivity independent component analysis, resting-state fMRI
Introduction
Human cognition and behavior are driven by a wide array of complex and dynamic processes that occur throughout development (Brenhouse and Andersen, 2011). Recent techniques that offer insight into the complexity of functional brain development can be used to quantify brain functional connectivity; referring to the correlated temporal fluctuations among distant brain regions. These techniques have been used to study the functional connectivity of the brain in both typically developing children and children with developmental and psychiatric disorders.
Evidence suggests that short-range or intra-network functional connectivity is more dominant during infancy (Fransson, et al., 2007; Gao, et al., 2011) and decreases with age during childhood and adolescence, with long-range or inter-network connectivity becoming more dominant in early adulthood (Dosenbach, et al., 2010). Atypical development of neural interactions is considered a major basis in theoretical models of neuropsychiatric disorders (Geschwind and Levitt, 2007; Uddin, et al., 2013b). Indeed, one of the prominent hypotheses on the origins of autism spectrum disorder (ASD) is an aberrant development of neuronal connections throughout the brain (i.e., ‘developmental disconnection syndrome’, Geschwind and Levitt, 2007). Thus, the study of functional connectivity of the brain in children is well suited for identifying neurobiological correlates associated with ASD.
ASD is a heterogeneous neurodevelopmental condition, with central features of impairment in reciprocal social interactions, as well as restricted, stereotypical behaviors. With an estimated prevalence between 1-to-3%, ASD is generally recognized in early childhood and is accompanied by severe burden, both for the affected individual as well as for caregivers (Baxter, et al., 2015). Despite the presence of an extensive and expanding literature, the neurobiological etiology of autism spectrum disorder remains elusive. Along with most psychiatric disorders, ASD has traditionally been conceptualized categorically, but is increasingly recognized as the severe end of a continuum of traits that extend into the general population (Constantino and Todd, 2003). While not strictly pathological, such variation in autistic traits in the general population serves as an important dimensional behavioral phenotype for clinical autism. Thus, imaging studies using this phenotype of quantitative social impairment can complement case-control studies to better understand the underlying neurobiology of ASD.
Recent studies exploring functional connectivity in ASD have shown conflicting results, with studies that show both stronger and weaker connectivity (Hull, et al., 2016). These discrepancies have previously been attributed to small sample sizes, differences in study populations, as well as differences in methodologies. However, it has been suggested that such discrepancies could also be related age-related changes in connectivity, which is different in individuals with ASD (i.e., younger children display hyper-connectivity while adults display hypo-connectivity) (Nomi and Uddin, 2015). Alternatively, recent work has suggested that the traditional static approach to measure functional connectivity may contribute to such discrepancies in the literature (Chen, et al., 2017).
Along these lines, the majority of existing models applied to the connectome operate under the assumption that the spatial characteristics of the brain’s functional architecture is static over a period of multiple minutes. This has been shown to be a major limitation, as important transient spatial patterns of connectivity could be overlooked (Calhoun, et al., 2014). The concept of dynamic connectivity estimation and its application was introduced earlier in the decade by Sakoglu and colleagues, where they studied the task-modulation of functional brain connections (Sakoglu, et al., 2010). Most recently, chronnectomic approaches relaxing traditional stationarity assumptions aim to more accurately model the brain’s independent component networks (ICNs), avoiding the omission of transient, yet potentially relevant, patterns of functional connectivity (Allen, et al., 2014). Dynamic functional network connectivity (dFNC) has already been shown to offer unique chronnectomic information (Allen, et al., 2014; Hutchison, et al., 2013a). Further, it is sensitive to neurobiological features of normal brain development (Hutchison and Morton, 2015) and psychopathology (Rashid, et al., 2014). Interestingly, a recent study (Wee, et al., 2016) proposed a cluster-based framework to diagnose ASD using temporally independent dynamic connectivity networks and achieved 71% classification accuracy, suggesting improvement in autism diagnosis by incorporating the temporal features of connectivity. Moreover, another classification study (Price, et al., 2014) implemented the analysis of sliding-window based dynamic connectivity features in a multi-network, multi-scale framework and classified childhood autism. The results showed significant improvement in ASD classification with the features from multiple integrated networks on different dynamic scales.
Within this context, we utilized resting-state fMRI scans from a large, population-based study of children ages 6-to-10 years to search for both underlying maturational and sex-specific properties of chronnectivity, and an underlying neurobiological substrate of ASD traits in the general population. We also isolated a subset of children from the cohort with clinical ASD diagnoses and matched controls, in order to more closely mirror traditional case-control designs and compliment the dimensional, trait-based approach. Within this restricted and largely pre-pubescent age-range, marked improvements in various cognitive and social abilities occur. Further, as many forms of psychopathology either emerge or manifest at this time, it is crucial to first possess a solid understanding of how the brain develops in the absence of psychopathology before we can meaningfully interpret any related deviations in functional networks (Di Martino, et al., 2014).
We hypothesized the presence of dynamic connectivity states in children that are similar to those reported in adults, as reported by several recent works (Faghiri, et al., 2018; Hutchison and Morton, 2015). Another study showed evidence of correlation between disrupted control network functions and altered dynamic connectivity in adult ASD subjects, suggesting that dynamic functional connectivity is an efficient measure while examining brain development in subjects with ASD (de Lacy, et al., 2017). Additional support for this hypothesis stems from evidence that static connectivity networks are present at a young age (Gao, et al., 2011). Further, we hypothesized age-related correlates of dynamic connectivity to resemble previously observed adult-like patterns, where increasing age is associated with states previously reported in adults. (Allen, et al., 2014) Lastly, as previous work has shown aberrant connectivity dynamics in psychopathology, we hypothesized to see an association between aberrant dynamic connectivity and features of autism. As the static connectivity literature has uncovered widespread patterns of both hyper- and hypo-connectivity in ASD, we hypothesize multiple regions throughout the brain to associate with autistic traits along a continuum in the general population. In particular, given numerous reports of the default-mode network have shown attenuated within- and between network connectivity in ASD, we hypothesize dynamic (hypo-) connectivity in this network to be of particular relevance.
Materials and Methods
Participants
The current study is embedded in the Generation R Study, which is a large, population-based birth cohort in Rotterdam, the Netherlands (Jaddoe, et al., 2012). One thousand seventy children, ages 6-to-10 years, were scanned between September 2009 and July 2013 as part of a sub-study within the Generation R Study (White, et al., 2013). General exclusion criteria for the current study include severe motor or sensory disorders (deafness or blindness), neurological disorders, moderate to severe head injuries with loss of consciousness, claustrophobia, and contraindications to MRI. Raw fMRI data from 964 subjects were available for our study, and after excluding children with bad data (e.g., motion, for details see below) 774 datasets were available for statistical analysis. Informed consent was obtained from the parents, and all procedures were approved by the Medical Ethics Committee of the Erasmus Medical Center. For more information on participant see Table S6, Table S7 and supplementary section 5.
Autistic Traits and Autism Spectrum Disorder
The Social Responsiveness Scale (SRS) was administered when children were roughly age 6 years (range: 4.89–8.90 years) to measure autistic traits based on parental observation during the last six months (Constantino, 2002). The SRS score provides a valid, quantitative measure of subclinical and clinical autistic traits, where higher scores indicate more symptoms related to ASD (Constantino, 2002). We utilized the total score derived from the abbreviated, 18-item short-form of the scale, which shows correlates of 0.93 and higher with the full scale in three different large studies (Blanken, et al., 2015). Cutoffs used in sensitivity analyses (described below) were based on recommendations for screening in population-based settings (consistent with weighted scores of 1.078 for boys and 1.000 for girls) (Constantino, 2002).
Autism Spectrum Disorder diagnoses
At approximately age 7 years, children who scored in the top 15th percentile on the Child Behavior Checklist-1.5–5 total score and those who scored in the top 2nd percentile on the Pervasive Developmental Problems sub-scale underwent a screening procedure for ASD using the Social Communication Questionnaire (SCQ), a 40-item parent-reported screening instrument to assess characteristic autistic behavior. SCQ scores ≥15 are considered positive for screening (Berument, et al., 1999). We approached the general practitioners of children who scored screen-positive on the SRS, SCQ or for whom the mother reported a diagnosis of ASD in order to confirm this diagnosis with medical records. In the Netherlands, the general practitioner holds the central medical records, including information on treatment by (medical) specialists. In this sample, 22 children with usable MRI data also had a confirmed diagnosis of ASD.
MRI Data Acquisition
Magnetic resonance imaging data were acquired on a 3 Tesla scanner (Discovery 750, General Electric, Milwaukee, WI) using a standard 8-channel, receive-only head coil. A three-plane localizer was run first and used to position all subsequent scans. Structural T1-weighted images were acquired using a fast spoiled gradient-recalled echo (FSPGR) sequence (TR = 10.3 ms, TE = 4.2 ms, TI = 350 ms, NEX = 1, flip angle = 16°, matrix = 256 × 256, field of view (FOV) = 230.4 mm, slice thickness = 0.9mm). Echo planar imaging was used for the rs-fMRI session with the following parameters: TR = 2000 ms, TE = 30 ms, flip angle = 85°, matrix = 64 × 64, FOV = 230 mm x 230 mm, slice thickness = 4 mm (Muetzel, et al., 2016). In order to determine the number of TRs necessary for functional connectivity analyses, early acquisitions acquired 250 TRs (acquisition time = 8min 20sec). After it was determined fewer TRs were required for these analyses, the number of TRs was reduced to 160 (acquisition time = 5min 20sec)(White, et al., 2014). Children were instructed to stay awake and keep their eyes closed during the rs-fMRI scan.
Image Preprocessing
Data preprocessing was performed using a combination of toolboxes (AFNI, http://afni.nimh.nih.gov, SPM, http://www.fil.ion.ucl.ac.uk/spm, GIFT, http://mialab.mrn.org/software/gift), and custom scripts were written in Matlab. As mentioned above, some scans were collected with 250 volumes, which were first trimmed at the end of the acquisition to match the majority of scans with 160 volumes. We performed rigid body motion correction using the INRIAlign (Freire and Mangin, 2001) toolbox in SPM to correct for subject head motion followed by slice-timing correction to account for timing differences in slice acquisition. Then the fMRI data were despiked using AFNI’s 3dDespike algorithm to mitigate the impact of outliers. The fMRI data were subsequently nonlinearly warped to a Montreal Neurological Institute (MNI) template (http://www.mni.mcgill.ca) and resampled to 3 mm3 isotropic voxels (see supplementary Section 3.11 for additional information on template normalization). The data were then smoothed with a Gaussian kernel to 5 mm full width at half maximum (FWHM). Each voxel time course was variance normalized prior to performing group independent component analysis as this has shown to better decompose subcortical sources in addition to cortical networks. In order to limit the impact of severe head motion, we excluded subjects’ data with a maximum translation of > 5 mm and/or with signal-to-noise fluctuation ratio (SFNR) <200 from our analyses, resulting in a final dataset with 774 subjects.
Group Independent Component Analysis (ICA)
After preprocessing the data, functional data were analyzed using spatial group independent component analysis (GICA) framework as implemented in the GIFT software (Allen, et al., 2012; Calhoun, et al., 2001a). Spatial ICA decomposes the subject data into linear mixtures of spatially independent components that exhibit a unique time course profile. A subject-specific data reduction step was first used to reduce 160 time point data into 120 directions of maximal variability using principal component analysis. Then subject-reduced data were concatenated across time and a group data PCA step reduced this matrix further into 100 components along directions of maximal group variability. One hundred independent components were obtained from the group PCA reduced matrix using the infomax algorithm (Bell and Sejnowski, 1995). To ensure stability of estimation, we repeated the ICA algorithm 20 times in ICASSO (http://www.cis.hut.fi/projects/ica/icasso), and aggregated spatial maps were estimated as the modes of component clusters (Himberg, et al., 2004). Subject specific spatial maps and time courses were obtained using the spatiotemporal regression back reconstruction approach (Calhoun, et al., 2001b; Erhardt, et al., 2011) implemented in GIFT software.
Post-ICA processing
Subject specific spatial maps and time courses underwent post-processing as described in our earlier work (Allen, et al., 2014). Briefly, we obtained one sample t-test maps for each spatial map across all subjects and thresholded these maps to obtain clusters of voxels with higher intensities for that component; we also computed mean power spectra of the corresponding time courses.
The criteria for identifying independent components as intrinsic connectivity networks (ICNs) were implemented in a semi-automated framework. We identified a subset of the independent components to be classified as ICNs (as opposed to physiological artifacts and motion-related noisy components) in two steps. First, we used AFNI software to automatically extract the peak MNI coordinates of each component and their corresponding MNI regions. Next, we inspected the aggregate spatial maps and average power spectra of each of the independent components (Figure 2 and Figure S9). Three viewers were provided with the MNI regions as extracted by AFNI, and they rated the components from 0 (definite artifact) to 1 (definite ICN) based on expectations that ICNs should exhibit cluster of voxels with higher intensities in gray matter, low spatial overlap with known vascular, ventricular, motion, and susceptibility artifacts, and time courses dominated by low frequency fluctuations (Cordes et al., 2001). To facilitate evaluation, power spectra of the components were characterized with two previously used metrics to classify components (Robinson, et al., 2009): dynamic range, defined by the difference between the peak power and minimum power at frequencies to the right of the peak, and low frequency to high frequency power ratio, the ratio of the integral of spectral power below 0.10 Hz to the integral of power between 0.15 and 0.25 Hz (Figure S9). Combined votes from the three raters were used to separate components into three broad classes: artifact (score equal to zero), mixed (score between zero and three), and RSN (score of three or greater and no votes equal to zero). This selection procedure resulted in 38 ICNs out of the 100 independent components obtained. Figures highlighting the dynamic range (Figure S9) and low frequency to high frequency power ratio (Figure S10) are provided in supplementary information.
Figure 2. Non-artifactual intrinsic connectivity networks (ICNs).
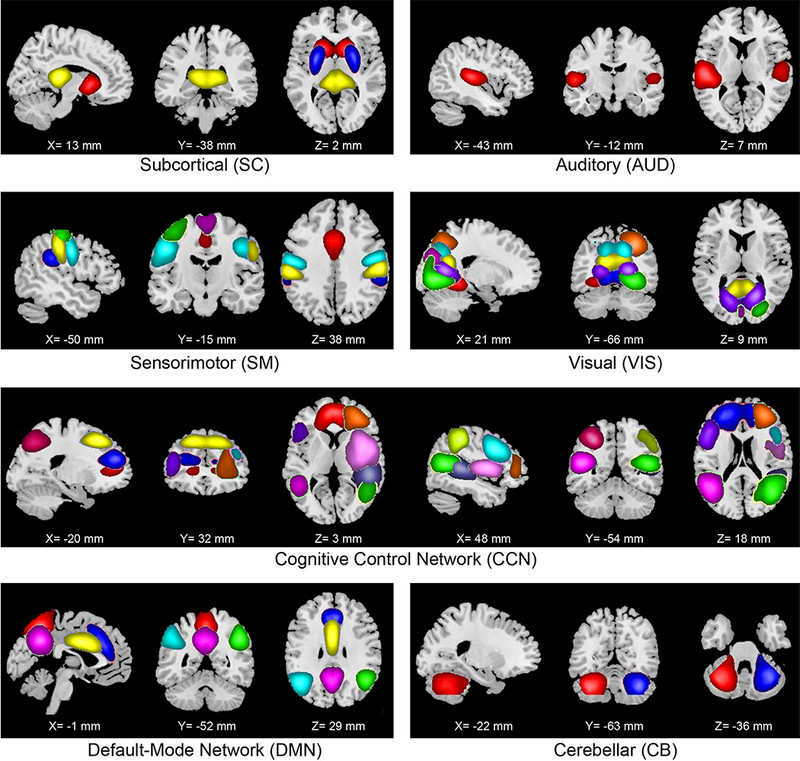
Composite maps of the 38 identified intrinsic connectivity networks (ICNs) used in static and dynamic functional network connectivity (FNC) analyses. The ICNs are divided into seven subcategories and arranged based on their anatomical and functional properties. Within each functional network, each color in the composite maps corresponds to a different ICN. Component labels and peak coordinates are provided in Supplemental Table S8.
The subject-specific time courses corresponding to the ICNs selected from the back-reconstructed data were detrended, orthogonalized with respect to estimated subject motion parameters, and then despiked. The despiking procedure involved detecting spikes as determined by AFNI’s 3dDespike algorithm and replacing spikes by values obtained from third order spline fit to neighboring clean portions of the data. The despiking process reduces the impact/ bias of outliers on subsequent FNC measures (see Supplemental Fig. 1 in (Allen, et al., 2014)). Lastly, single-subject post-ICA motion parameters regression from time-series at the voxel level was performed. This step, in combination with despiking and the ability of group ICA to remove signals attributable to noise and artifact (including motion) ensures the data are suitable for statistical analysis.
Static Functional Network Connectivity (sFNC)
We computed functional network connectivity (FNC), defined as pairwise correlation between ICN time courses, as a measure of average connectivity among different ICNs during the scan duration. In this work, the FNC computed using the whole ICN time courses is referred to as stationary or static FNC (sFNC). Since correlation among brain networks is primarily shown to be driven by low frequency fluctuations in BOLD fMRI data (Cordes, et al., 2001), we band pass filtered the processed ICN time courses between [0.01–0.154 Hz using 5th order Butterworth filter prior to computing FNC between ICNs. The mean sFNC matrix was computed over subjects. For partitioning sFNC matrix based on modularity, we followed our prior work (Allen, et al., 2014) to identify the main modules (sub-cortical, auditory, visual, sensorimotor, cognitive control, default mode network and cerebellum), and using those same partitioned modules as our main modules, rather than partitioning the frontal and attention-networks as seen in some of the prior published work. For organization of the ICNs inside these main modules, we applied the Louvain algorithm of the brain connectivity toolbox (https://sites.google.com/site/bctnet), and arranged the ICN components accordingly. To address the stochastic nature of the Louvain algorithm, we ran the Louvain algorithm 100 times and compared the number of times we got the same arrangement of ICNs. Finally, we used the arrangement that occurred maximum number of times. The rows of sFNC matrix were partitioned into sub-cortical (SC), auditory (AUD), visual (VIS), sensorimotor (SM), a broad set of regions involved in cognitive control (CCN) and attention, default-mode network (DMN) regions, and cerebellar (CB) components as shown in Figure S1. Note that, the limitation of adopting a particular network modularity scheme as presented in our earlier work (Allen, et al., 2014) is that we have grouped the identified salience components with default-mode components, which are all grouped together in DMN module.
Dynamic Functional Network Connectivity (dFNC)
As recent studies both in animals and humans have highlighted the nonstationary nature of functional connectivity in BOLD fMRI data (Chang and Glover, 2010; Hutchison, et al., 2013b; Uddin, et al., 2013b), we sought to determine whether the observed sFNC differences were primarily driven by certain connectivity configurations (Hutchison, et al., 2013b). Following our recent work (Allen, et al., 2014), dynamic FNC (dFNC) between all ICA time courses was computed using a sliding window approach with a window size of 22 TR (44 s) in steps of 1 TR (Figure 1). As in our earlier work, the window constituted a rectangular window of 22 time points convolved with Gaussian of sigma 3 TRs to obtain tapering along the edges (Allen, et al., 2014). Since estimation of covariance using time series of shorter length can be noisy, we estimated covariance from regularized inverse covariance matrix (ICOV) (Smith, et al., 2011; Varoquaux, et al., 2010) using the graphical LASSO framework (Friedman, et al., 2008). We imposed an additional L1 norm constraint on the inverse covariance matrix to enforce sparsity. The regularization parameter was optimized for each subject by evaluating the log-likelihood of unseen data of the subject in a cross-validation framework. After computing dFNC values for each subject, these covariance values were Fisher-Z transformed to stabilize variance prior to further analysis.
Figure 1. Graphical depiction of the analysis method and key findings.
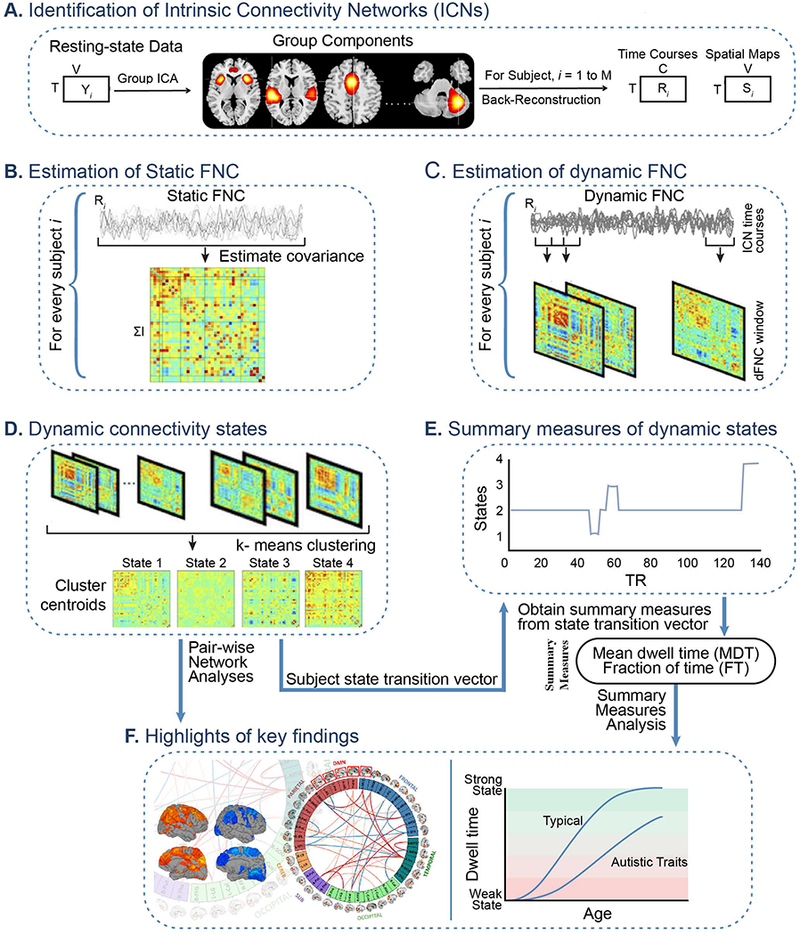
(A) The static and dynamic functional network connectivity (FNC) approach begin with group independent component analysis (ICA) to decompose resting-state fMRI data into intrinsic connectivity networks (ICNs). The group ICA approach provides a measure of the component time courses and spatial maps for each subject using the back-reconstruction technique. (B) Static FNC between components is estimated as the covariance of the time courses. (C) Dynamic FNC is estimated as the covariance from windowed portions of the time courses. (D) K-means clustering is used to identify discrete dynamic connectivity states. (E) Results obtained from k-means clustering are used to determine which state a given subject is occupying at a given time, and summary measures of dynamic states, such as, mean dwell time (MDT) and fraction of time (FT) spent in each state over the duration of the measurement period are computed. (F) Highlights of the key findings for pairwise network analyses and summary measures analyses in association with age, sex and autistic traits.
Clustering and Dynamic States Detection
Based on our observation that patterns of dFNC connectivity reoccur within subjects across time and also across subjects, we used a k-means algorithm to cluster these dynamic FNC windows, subdividing the data into a set of separate clusters so as to maximize the correlation within a cluster to the cluster centroid. Instead of clustering all of the dFNC windows across all subjects, initial clustering was performed on a subset of windows from each subject, called subject exemplars hereafter, corresponding to windows of maximal variability in correlation across component pairs. To obtain the exemplars (see Figure S11), we first computed variance of dynamic connectivity across all pairs at each window. We then selected windows corresponding to local maxima in this variance time course. The optimal number of centroid states was estimated using the elbow criterion, defined as the ratio of within cluster to between cluster distances (see supplementary Section 3.6 and Figure S8 for detailed information). A k of 4 was obtained using this method in a search window of k from 2 to 9. The correlation distance metric was chosen, as it is more sensitive to the connectivity pattern irrespective of magnitude. We repeated the clustering method using different distance functions (cosine and L1-norm, rather than the correlation function) and also found very similar results. Once we identified these subject exemplars, we then used them to initialize a clustering approach, which used all of the windows (i.e. windowed connectivity matrices) from all of the subjects and estimated the cluster centroids or connectivity states (more details on clustering approach can be found in (Allen, et al., 2014)). Information on validation of the clustering approach with respect to a null model can be found in supplementary Section 3.9 and Figures S12 and S13. Moreover, a discussion on the assumption of dynamic states is provided in supplementary Section 6 and Figures S15 and S16.
Also, summary measures such as mean dwell time (MDT) and fraction of time (FT) were computed from the state transition vector. Using the following equations (i) and (ii), we computed MDT and FT for each subject:
| (i) |
where,
| (ii) |
The pseudo code for computing MDT using the above equation is:
For each subject i and for each dynamic state k
Compute start_t by first taking the difference between the adjacent elements of the state vector for that particular subject, and then by finding the differences that are equal to 1.
Compute end_t by first taking the difference between the adjacent elements of the state vector for that particular subject, and then by finding the differences that are equal to −1.
If the first value of the state vector is equal to the current state k, store start_t as [0;start_t].
If the last value of the state vector is equal to the current state k, store end_t as [end_t,Number_of_windows].
subtract the start_t vector from the end_t vector, and take the mean of the resulting vector to compute the mean dwell time (MDT) of that subject on that particular state.
Repeat step 1 to step 5 for all subjects i and all states k.
Statistical Analyses
Statistical analyses were carried out in Matlab (version R2011b) using the statistics toolbox and linear model class. Multiple linear regression was used to examine associations between connectivity metrics and explanatory variables (i.e., age, sex, and autistic traits). Two separate models were used to investigate associations with sFNC, dFNC and summary metrics from dFNC such as MDT and FT: first, a model where age and sex were entered as independent (predictor) variables and main effects for each were examined, and a second model where autistic traits (SRS) was entered as the independent variable and age and sex were added as covariates. All of the results reported correspond to a false discovery rate multiple comparison correction threshold p < 0.05.
Note that, for all of our analyses we also started with a full model that included interaction terms (age-sex and SRS-age and SRS-sex), and the backward model selection led us to a first-order model. In the backward model selection procedure, unimportant or less significant variables are eliminated one at a time. The process starts from the full model, and isolates the least important predictor left in the model, and checks its significance. We used the Akaike information criterion (AIC), a penalized-likelihood criteria of the relative goodness-of-fit of a statistical model to the observed data. A 0.10 significant level has been used for this strategy while dropping the less significant variables. Final results were corrected for false discovery rate (FDR) at p<0.05 level. We have used step ( ) function from R Programming to employ this approach. (https://www.rdocumentation.org/packages/stats/versions/3.4.3/topics/step).
After backward model selection, the following models were used for investigating associations with sFNC matrices:
For dFNC analyses, we computed a subject median (computed element-wise) for each subdivision from the subject windows that were assigned to that subdivision as a representative pattern of connectivity of the subject for that state. To investigate if the observed effects of age, sex and SRS on sFNC are primarily driven by certain dynamic FNC states, we used these subject medians for each state, as well as the summary matrices for each state, and evaluated the associations using two separate models as mentioned above, and are adapted for the dFNC below:
Similar to sFNCs, we started with a full model that included interaction terms (age-sex, age-SRS and sex-SRS), and the backward model selection led us to a first-order model.
Pair-wise associations from the above mentioned models are depicted in connectivity matrices and in connectograms (Langen, et al., 2015) as seen in Figure 4.
Figure 4. Connectogram and rendering maps showing age and sex associations across the dynamic connectivity states.
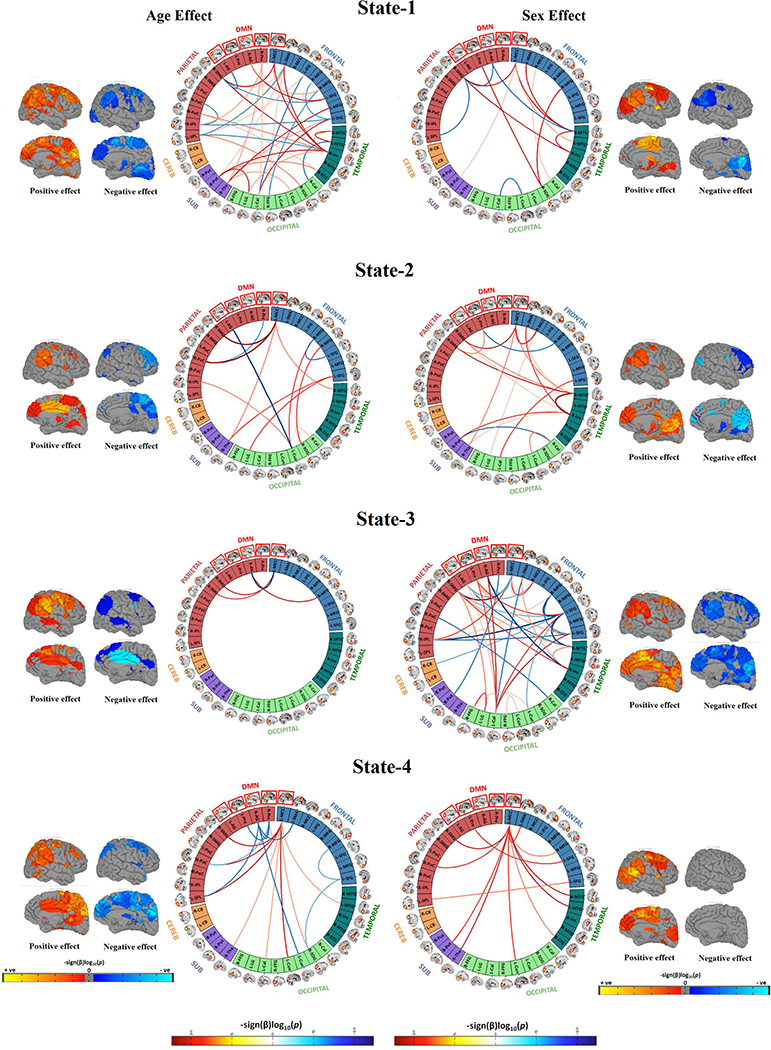
Connectograms are sorted by major brain lobes. Rendering maps are divided into average positive and negative effects. For age analyses, red lines indicate positive association between a particular pairwise connection and age, whereas blue lines indicate a negative age association. For analyses of sex, red lines indicate where female subjects showed stronger connectivity than male subjects, and blue lines indicate where male subjects showed stronger connectivity compared to female subjects. All the results presented in the connectograms survived the false discovery rate (FDR) multiple comparison correction threshold of pFDR = 0.05.
The following models were used for investigating associations with summary metrics of dFNC (MDT and FT):
In order to ensure linear terms were the best fit for the data, quadratic and cubic age terms were also tested, however model fits were not improved when these higher order terms were added. This has also been evaluated using several residual plots, which showed linear trend of the data.
Several sensitivity analyses were run in order to ensure results were not influenced various confounding factors, and are reported in the supplemental Section 3. First, to ensure behavioral problems did not influence age- and sex-related associations, analyses were run where children with high levels of behavioral problems were excluded. Similarly, to test whether continuous associations between autistic traits and connectivity were truly along a continuum and not driven by extreme cases, analyses were run after excluding children scoring above the screening threshold on the SRS and those with a clinical ASD diagnosis. In order to disentangle the effects of SRS and age, an SRS-by-age interaction term was added to MDT and FT models (note that, the full model included age-sex, SRS-age and SRS-sex interaction terms, where the reduced model led to a first-order model). Further, for SRS models examining MDT and FT, the sample was refined into an age-restricted sample (ages 8-to-9 years only) to minimize the residual confounding effects of age. Lastly, to ensure motion-related artifacts were not responsible for any age-related or SRS-related associations, children with more than 3mm maximum translation during rs-fMRI acquisition were dropped from analyses, and common motion parameters (e.g., frame-wise displacement) were added to the models. Note that, the motion parameters were only added to the models for sensitivity analyses that are presented in supplementary Section 3.
Results
Characterizing static and dynamic functional network connectivity in children
Our first goal was to characterize the connectivity in typical development through age associations in a large sample of 774 school-age children. This was accomplished by evaluating the properties of both static and dynamic connectivity (Figure 1(A-D)) of the developing brain using 38 ICNs (extracted from a 100 component group independent component analysis (Calhoun, et al., 2001a)) grouped into brain networks according to their anatomical and functional properties (Figure 2). The static FNC of the developing brain showed similar patterns as previous large-scale analyses of adults (Allen, et al., 2014; Damaraju, et al., 2014) for both intra- and inter-network connectivity. The default mode network was strongly connected within itself, and less connected to other brain networks (Figure S1). Dynamic connectivity analyses (Figure 3) identified two modularized (i.e., bearing resemblance to previously reported static connectivity configurations): State-1: globally modularized, static-like, i.e. FNCs were present globally in intra- and inter-network connectivity, and State-3: default-mode modularized, i.e. strong intra-network positive connectivity and inter-network negative connectivity in DMN. In addition, a globally disconnected state was identified (State-2: globally loosely connected intra- and inter-network connectivity) and one globally hyperconnected state (State-4: high positive connectivity found globally). Previous dynamic connectivity studies in adults reported each of these dynamic states, except for State-2, the globally disconnected state (Allen, et al., 2014). Details on quantitative measures based dynamic state assignment criteria can be found in supplementary section 4 and Figure S14.
Figure 3. Dynamic functional network connectivity (FNC) states.
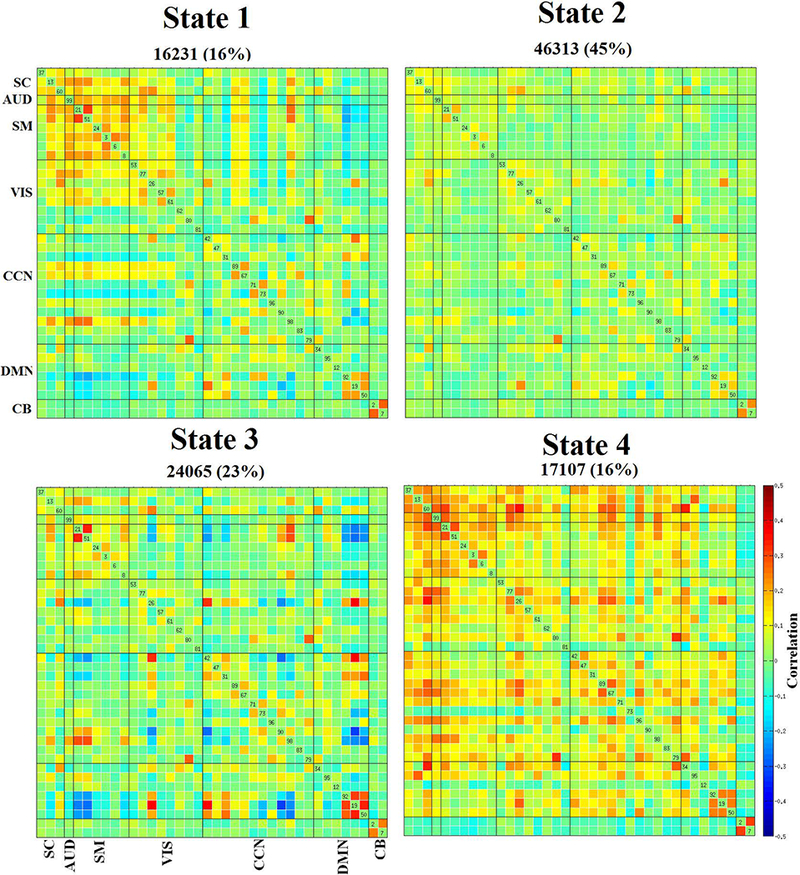
The four dynamic states represented in connectivity matrices are symmetrically grouped by functional networks, and colors represent the average strength and direction of the pairwise correlation between two components, with red-yellow indicating a positive correlation, and blue indicating a negative correlation. Here, SC: subcortical, AUD: auditory, SM: sensorimotor, VIS: visual, CCN: cognitive control network, DMN: default-mode network, and CB: cerebellar network. Labels for the dynamic states include, state-1: globally modularized, state-2: globally disconnected, state-3: DMN modularized, and state-4: globally hyperconnected.
Development of dynamic FNC states
Next, we evaluated the relationship of age and sex with the discrete dynamic states to evaluate the development of transient states from less-to-more mature representations of FNC (Figure 4). Age-related associations were mostly localized in (but not limited to) State-1, the globally modularized dynamic state. In particular, positive age-related associations among frontal-temporal components, and both positive and negative age-related associations among frontal-parietal and temporal-parietal components were observed in State-1. Also, sex differences were mostly localized in (but not limited to) State-3, a state characterized by a modularized DMN. This particular dynamic state showed greater connectivity among frontal-temporal and frontal-occipital components in girls, and greater connectivity between a parietal component (right angular gyrus, also a DMN component) and a temporal component (right middle temporal gyrus) in boys. In other dynamic states, the age- and sex-specific effects were mostly localized to the DMN. Specifically, the left middle cingulate cortex (MCC) DMN component showed stronger inter-network connectivity with age in all FNC states, and stronger intra-network connectivity with age in State-4. Lastly, the left MCC showed higher inter-network connectivity for girls in all FNC states, and higher intra-network connectivity for boys in State-3.
Dwell time in dynamic states: age associations and sex differences
Next, we explored how different quantitative summary metrics of dynamic connectivity, such as mean dwell time (MDT) and fraction of time spent in dynamic states (FT), change as functions of age and sex (Figure 5). For each of the dynamic FNC states, we computed the MDT (how long an individual spends in a given state on average) and FT (total time spent in a given state). We found that older children showed longer MDT and FT in the globally modularized dFNC state (State-1). Conversely, younger subjects showed longer MDT and FT in the globally disconnected state (State-2). We also investigated sex differences in MDT and FT in the dynamic states and found that boys showed higher FT in the disconnected state (State-2), whereas girls showed higher MDT and FT in the DMN-modularized state (State-3). The other two dynamic states, the globally modularized state (State-1) and the globally hyperconnected state (State-4) showed trend-level sex effects, where boys had higher MDT and FT compared to girls in States-1 and −4.
Figure 5. Summary metrics and age- and sex- effects.
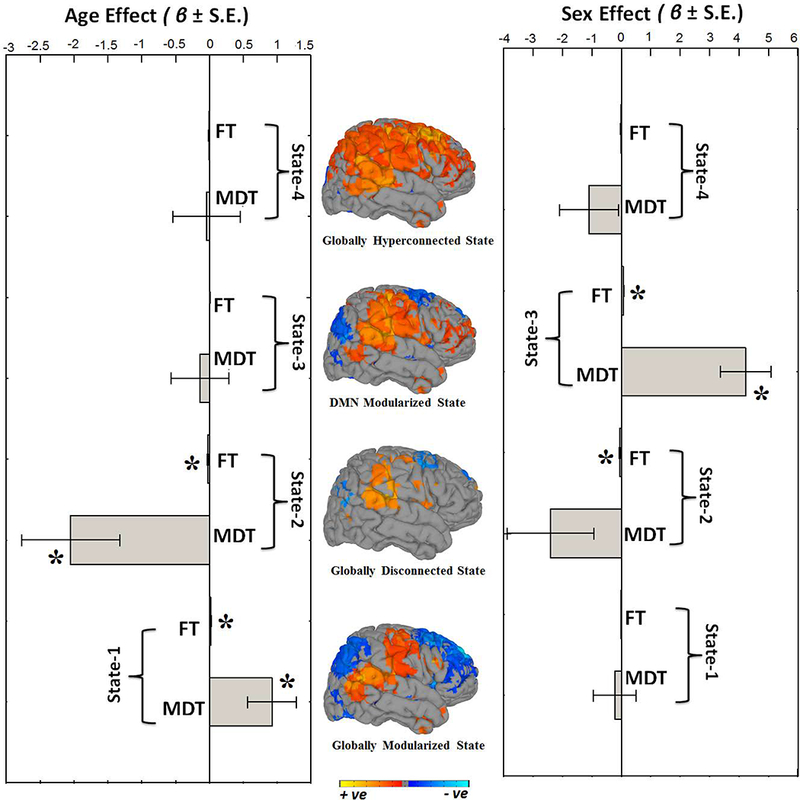
Summary metrics from the four dynamic connectivity states in relation to age and sex. Mean dwell time (MDT) represents how long an individual spends in a given state on average, and fraction of time (FT) is the summed total time spent in a given state over the course of the measurement period. For age associations, positive beta coefficient (β) indicates older children spend more time in that particular state whereas negative beta coefficient (β) indicates younger children spend more time in a particular state. For sex analyses, positive beta coefficient (β) indicates girls spend more time in the state relative to boys, and negative beta coefficient (β) indicates that boys spend more time in the state relative to girls. Bar graphs indicate the unstandardized beta coefficients (β) with standard error (S.E.) from regression models, and asterisks (*) indicate the results survived the false discovery rate (FDR) multiple comparison correction threshold of pFDR = 0.05. The rendering brain maps are showing modularized positive (red) and negative (blue) connectivity for the corresponding dynamic states.
Characterization of dynamic chronnectopathy: autistic traits and autism spectrum disorder
In addition to characterizing static and dynamic FNCs in typical development, we also studied the chronnectopathy, or disruption of the typical dynamic connectivity patterns, through autistic traits in the general population as well as in clinical autism spectrum disorder. We assessed autistic traits using the Social Responsiveness Scale (SRS) (Constantino, et al., 2003) in a subset of children in the original sample (n=560). For static connectivity, one component pair (the left supplementary motor area, i.e. SMA, and the right supramarginal gyrus, i.e. SmG), showed an association with autistic traits. Specifically, children with more autistic traits showed weaker static connectivity. Interestingly, for dFNC State-3, children with more autistic traits showed higher connectivity in three component pairs (right insula and left superior frontal gyrus, right SmG and left precuneus i.e. preC, and right insula and left preC) and lower connectivity in two component pairs (right-insula and right SmG, and left SMA and right SmG). Next, we assessed how MDT and FT vary with respect to autistic trait scores (Figure 6). In the globally disconnected state (State-2), autistic traits showed a positive association with MDT. In the DMN-modularized state (State-3), autistic traits were negatively associated with MDT. Thus, children with high levels of autistic traits had longer dwell times in the globally disconnected state (State-2) and children with fewer traits had longer dwell times in the DMN-modularized state (State-3). Results remained highly consistent when models were additionally adjusted for non-verbal IQ. Further, a similar pattern of effects was observed at the severe end of the spectrum, when a sub-sample of 22 children with clinical ASD were compared to 88 age, sex and IQ matched controls (Figure S6). In order to assess whether the above-mentioned associations are a core feature of the trait-continuum or if the associations were driven by the most severely affected children, sensitivity analyses were run. When children with clinical ASD or an autistic traits score above the screening threshold were excluded, results remained consistent (Figure S7), demonstrating that underlying neurobiological features covary with sub-clinical and clinical autistic traits.
Figure 6. Summary metrics and autistic trait effects.
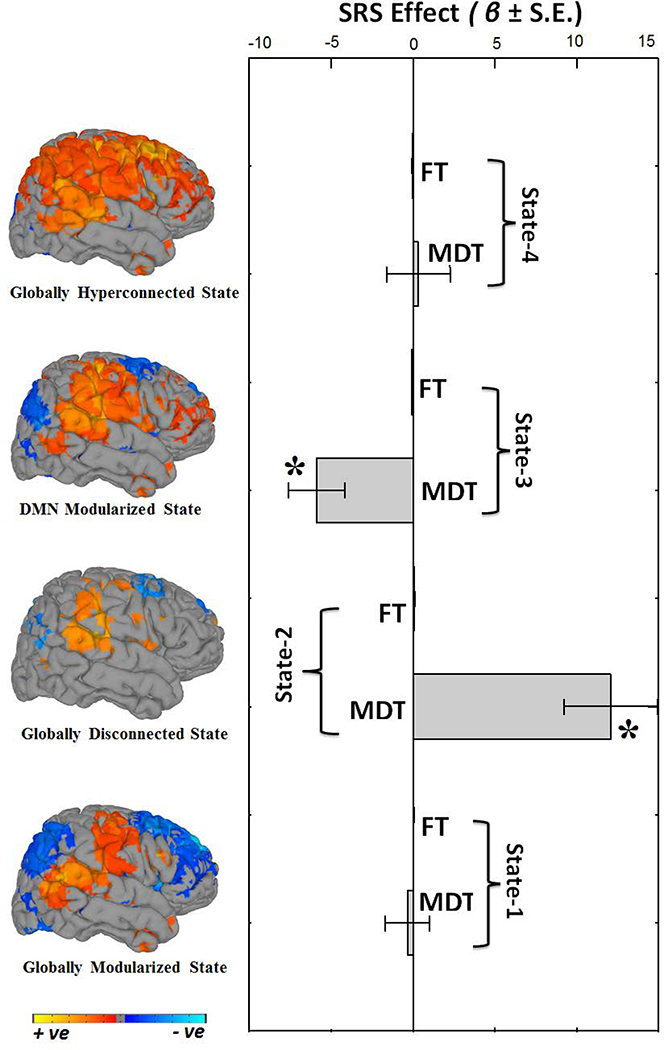
Summary metrics from the four dynamic connectivity states in relation to autistic traits. Mean dwell time (MDT) represents how long an individual spends in a given state on average, and fraction of time (FT) is the summed total time spent in a given state over the course of the measurement period. Positive beta coefficient (β) indicates that higher levels of autistic traits are associated with more time spent in a particular state; whereas negative beta coefficient (β) indicate lower levels of autistic traits are associated with more time spent in a particular state. Bar graphs indicate the unstandardized beta coefficients (β) with standard error (S.E.) from regression models, and Asterisks (*) indicate the results survived the false discovery rate (FDR) multiple comparison correction threshold of pFDR = 0.05. The rendering brain maps are showing modularized positive (red) and negative (blue) connectivity for the corresponding dynamic states.
Discussion
Here we implement a recent approach to the study of brain connectivity, both in typical and atypical child development. Complementing the existing static functional connectivity literature, we show age-related associations with discrete dynamic states that illustrate higher order maturational effects on chronnectivity. We also provide additional support for a disconnection construct in children with autistic traits and clinical ASD using dynamic functional connectivity. Lastly, we demonstrate the utility and potential clinical relevance of quantitative metrics that summarize large amounts of complex chronnectomic information.
The development of whole-brain dynamic connectivity in young children
In a large group of young children with a narrow age-range, we demonstrate that older children on average have longer dwell times in dynamic states typically observed in previous studies on healthy adults. Age-related associations with static connectivity were consistent with previous reports, including increased integration of brain networks (Johnson and Munakata, 2005). This validation of the existing static connectivity literature is nicely complemented with new information where assumptions of network stationarity are relaxed, and quantitative summary metrics, such as mean dwell time, are examined (Hutchison and Morton, 2015). Interestingly, evidence for sexual dimorphism in dynamic connectivity was also observed with girls showing longer dwell times in the modularized default-mode state and boys showing longer dwell times in the globally disconnected state. While no age-by-sex interaction was observed, given the narrow age range, this could complement existing evidence showing neuromaturational processes begin earlier in girls (Lenroot and Giedd, 2006; Simmonds, et al., 2014).
Functional connectivity, autistic traits and autism spectrum disorder
Novel neuroimaging findings in combination with a characteristic early onset have brought momentum to ASD being conceptualized as a developmental disconnection syndrome (Geschwind and Levitt, 2007). Previous studies of static FNC in ASD have revealed mixed patterns of increased and decreased connectivity strength (Uddin, et al., 2013b). Similarly, within the discrete dynamic FNC states, we found local patterns of stronger as well as weaker connection strength. Specifically, we observed decreased connectivity between the right supramarginal gyrus and the right insula, which is consistent with findings of lower insula activation in subjects with ASD in a large number task-based neuroimaging studies, covering a range of social processing tasks (Di Martino, et al., 2009a). However, we also found hyperconnectivity in the right insula, with the precuneus and the left superior frontal gyrus. Hyperconnectivity of the salience network, in which the insula is a key region, is particularly well replicated in the context of childhood ASD (Uddin, et al., 2013a). Our findings in children in a similar age range suggest that the hyperconnectivity of the insula may also extend beyond regions of the salience network. Further, divergent findings of hypo- and hyperconnectivity in this region across studies, which have been previously attributed to developmental differences between samples (Uddin, et al., 2013b), may be in fact be present at the same developmental stage, but across different dynamic states, and thus only be revealed simultaneously when using dynamic connectivity approaches.
Here, in a large cohort of 774 children we demonstrate that children with higher levels of autistic traits have longer dwell times in a globally disconnected state during rest, whereas children with lower levels of autistic traits have longer dwell times in a globally modularized state that more resembles an adult-like pattern of connectivity as previously found in adult subjects’ studies (Allen, et al., 2014). Interestingly, in schizophrenia, another disorder frequently classified as a disconnection syndrome, patients also spend more time in weakly connected dynamic states compared to healthy controls (Damaraju, et al., 2014; Rashid, et al., 2014), and showed decreased hemispheric connectivity (Agcaoglu, et al., 2017) . This also potentially fits with previous work in adults showing that, at the individual level, those with ASD may have distinct, noisy patterns of connectivity that may even mask ‘typical’ patterns of connectivity (Hasson, et al., 2009). Higher levels of autistic traits were also associated with lower dwell times in a default-mode modularized state; a state where nodes from the well-documented default-mode network were prominent. Despite heterogeneity in much of the functional connectivity literature, there is a growing body of evidence suggesting that the default mode network is more weakly connected in individuals with ASD (Jung, et al., 2014; Stigler, et al., 2011). Interestingly, task-based data examining the effect of a cognitive load on the DMN has previously suggested the DMN does not ‘deactivate’ during a task in ASD (Kennedy, et al., 2006). However, in the context of our findings and other reports of weaker connectivity in the DMN, it is possible that rather failing to deactivate, the DMN actually fails to ‘activate’ in individuals with ASD; an alternative interpretation that could be made from task-rest contrasts of BOLD activation. We also demonstrated that, in the absence of clinically relevant cases, autistic symptoms in the general pediatric population are related to dynamic aspects of network connectivity. This is further evidence that aspects of the neurobiology of autistic traits, similar to the symptomatology, indeed lie on a continuum (Blanken, et al., 2015; Constantino and Todd, 2003; Di Martino, et al., 2009b). In addition to the dimensional trait approach, children with clinical ASD were compared to a group of age- and sex-matched controls, revealing similar patterns of longer dwell time within the globally disconnected state. Thus, we show that these dynamic functional connectivity features of autistic traits are also present in the most severely affected children. We propose the label “chronnectopathy” where patterns of dynamic functional connectivity in clinical groups deviate from those observed in the reference group without the disorder. While autistic traits in the general population are by no means pathological, this dimensional behavioral phenotype for clinical autism, which is considered pathological, serves as the basis for the term chronnectopathy. Interestingly, the longer mean dwell time in a less connected state observed in children with autistic traits and ASD which mimics the patterns in younger, typically developing children, potentially indicative of a delayed or halted trajectory (Di Martino, et al., 2014).
Additional considerations
Strengths of this study include the large, population-based sample of children in a narrow age range, enabling us to show subtle age effects during a crucial, pre-adolescent period of development. Further, the age-range included in the current study is particularly under-studied in the context of ASD (Uddin, et al., 2013b). Another major strength is the use of a dynamic approach to resting-state connectivity combined with an efficient and interpretable presentation of a wealth of data. While there is some consistency in the expansive static connectivity literature in ASD, it is unfortunately plagued by heterogeneity in clinical characteristics of the subjects, image acquisition, analysis strategy, and ultimately the core findings (Hernandez, et al., 2015; Uddin, et al., 2013b). The quantitative summary measures presented here could potentially aid in simplifying interpretations of complex network information, which historically are often subjectively evaluated. For instance, specific and isolated features of large (e.g., 80×80) connectivity matrices are often summarized when undoubtedly more complex patterns are present. While the present study also assigned labels to the four dynamic states, most of the interpretation comes from quantitative metrics, such as MDT. The subjects were all scanned on the same MRI scanner, which reduces vendor- and hardware-dependent differences. Finally, the study of ASD is approached dimensionally as well as from a traditional case-control perspective, revealing dynamic connectivity features of ASD that lie along a continuum in the general population. While many studies of ASD include only boys, our sample was sex-balanced and also presented in the context of typical brain development. However, some limitations deserve mention. While increased scan duration is likely to reveal the complexity of dynamic connectivity states and their temporal aspects more accurately, our rs-fMRI scan was limited to just over 5 minutes to ensure high quality data given the scale of the study and to minimize the burden on our young participants (White, et al., 2014). Further, our study was cross-sectional and all participants were of school-age, so the interpretation of our results can not be extended to other stages of development. Longitudinal studies are warranted to reveal trajectories of dynamic connectivity in typical and atypical development.
In conclusion, our approach suggests that a hallmark of childhood is not limited to the under-development of the frontal lobe, but also about the efficient utilization of vast interconnections; in essence, younger children are less frequently tapping into the resources that they have. Also, children with higher levels of autistic traits are even less likely to efficiently use such connections and may have less capacity in this regard. This study revealed novel aspects of psychopathology and future studies should evaluate the utility of this methodology in, for example, the classification, evaluation and treatment response prediction of conditions like ASD.
Supplementary Material
Acknowledgements
We gratefully acknowledge the contribution of children and parents, general practitioners, hospitals, midwives and pharmacies in Rotterdam.
Funding
This study received support from the Sophia Children’s Hospital Research Foundation (SSWO) Project 639, Simons Foundation Autism Research Initiative (SFARI - 307280) and the Netherlands Organization for Health Research and Development (ZonMw) TOP grant number 91211021. The project was also supported by NIH grants P20GM103472, R01EB005846, R01EB020407 and NSF 1539067. MRI data acquisition was sponsored in part by the European Community’s 7th Framework Programme (FP7/2008–2013, 212652). The Generation R Study is conducted by the Erasmus Medical Center in close collaboration with the School of Law and Faculty of Social Sciences of the Erasmus University Rotterdam, the Municipal Health Service Rotterdam area, Rotterdam, the Rotterdam Homecare Foundation, Rotterdam and the Stichting Trombosedienst & Artsenlaboratorium Rijnmond (STAR-MDC), Rotterdam. The general design of Generation R Study is made possible by financial support from the Erasmus Medical Center, Rotterdam, the Erasmus University Rotterdam, ZonMw, the Netherlands Organisation for Scientific Research (NWO), and the Ministry of Health, Welfare and Sport.
Footnotes
Conflict of Interest:
The authors declare no competing financial interests in relation to the work presented.
References
- Agcaoglu O, Miller R, Damaraju E, Rashid B, Bustillo J, Cetin M, Van Erp T, McEwen S, Preda A, Ford J (2017) Decreased hemispheric connectivity and decreased intra-and inter-hemisphere asymmetry of resting state functional network connectivity in schizophrenia. Brain Imaging and Behavior:1–16. [DOI] [PMC free article] [PubMed] [Google Scholar]
- Allen EA, Damaraju E, Plis SM, Erhardt EB, Eichele T, Calhoun VD (2012) Tracking Whole-Brain Connectivity Dynamics in the Resting State. Cereb Cortex. [DOI] [PMC free article] [PubMed] [Google Scholar]
- Allen EA, Damaraju E, Plis SM, Erhardt EB, Eichele T, Calhoun VD (2014) Tracking whole-brain connectivity dynamics in the resting state. Cereb Cortex, 24:663–76. [DOI] [PMC free article] [PubMed] [Google Scholar]
- Baxter AJ, Brugha TS, Erskine HE, Scheurer RW, Vos T, Scott JG (2015) The epidemiology and global burden of autism spectrum disorders. Psychol Med, 45:601–13. [DOI] [PubMed] [Google Scholar]
- Bell AJ, Sejnowski TJ (1995) An information-maximization approach to blind separation and blind deconvolution. Neural Comput, 7:1129–59. [DOI] [PubMed] [Google Scholar]
- Berument SK, Rutter M, Lord C, Pickles A, Bailey A (1999) Autism screening questionnaire: diagnostic validity. Brit J Psychiat, 175:444–451. [DOI] [PubMed] [Google Scholar]
- Blanken LME, Mous SE, Ghassabian A, Muetzel RL, Schoemaker NK, El Marroun H, van der Lugt A, Jaddoe VWV, Hofman A, Verhulst FC, Tiemeier H, White T (2015) Cortical Morphology in 6-to 10-Year Old Children With Autistic Traits: A Population-Based Neuroimaging Study. Am J Psychiat, 172:479–486. [DOI] [PubMed] [Google Scholar]
- Brenhouse HC, Andersen SL (2011) Developmental trajectories during adolescence in males and females: a cross-species understanding of underlying brain changes. Neuroscience & Biobehavioral Reviews, 35:1687–1703. [DOI] [PMC free article] [PubMed] [Google Scholar]
- Calhoun VD, Adali T, Pearlson G, Pekar JJ (2001a) Group ICA of functional MRI data: separability, stationarity, and inference. Proc. Int. Conf. on ICA and BSS San Diego, CA. [Google Scholar]
- Calhoun VD, Adali T, Pearlson GD, Pekar JJ (2001b) A method for making group inferences from functional MRI data using independent component analysis. Hum Brain Mapp, 14:140–51. [DOI] [PMC free article] [PubMed] [Google Scholar]
- Calhoun VD, Miller R, Pearlson G, Adali T (2014) The chronnectome: time-varying connectivity networks as the next frontier in fMRI data discovery. Neuron, 84:262–74. [DOI] [PMC free article] [PubMed] [Google Scholar]
- Chang C, Glover GH (2010) Time-frequency dynamics of resting-state brain connectivity measured with fMRI. Neuroimage, 50:81–98. [DOI] [PMC free article] [PubMed] [Google Scholar]
- Chen H, Nomi JS, Uddin LQ, Duan X, Chen H (2017) Intrinsic functional connectivity variance and state-specific under-connectivity in autism. Human brain mapping, 38:5740–5755. [DOI] [PMC free article] [PubMed] [Google Scholar]
- Constantino J (2002) Social Responsiveness Scale (SRS), Manual. Los Angeles: Western Psychological services. [Google Scholar]
- Constantino JN, Davis SA, Todd RD, Schindler MK, Gross MM, Brophy SL, Metzger LM, Shoushtari CS, Splinter R, Reich W (2003) Validation of a brief quantitative measure of autistic traits: Comparison of the social responsiveness scale with the autism diagnostic interview-revised. J Autism Dev Disord, 33:427–433. [DOI] [PubMed] [Google Scholar]
- Constantino JN, Todd RD (2003) Autistic traits in the general population: a twin study. Arch Gen Psychiatry, 60:524–30. [DOI] [PubMed] [Google Scholar]
- Cordes D, Haughton VM, Arfanakis K, Carew JD, Turski PA, Moritz CH, Quigley MA, Meyerand ME (2001) Frequencies contributing to functional connectivity in the cerebral cortex in “resting-state” data. AJNR Am J Neuroradiol, 22:1326–33. [PMC free article] [PubMed] [Google Scholar]
- Damaraju E, Allen EA, Belger A, Ford JM, McEwen S, Mathalon DH, Mueller BA, Pearlson GD, Potkin SG, Preda A, Turner JA, Vaidya JG, van Erp TG, Calhoun VD (2014) Dynamic functional connectivity analysis reveals transient states of dysconnectivity in schizophrenia. Neuroimage-Clin, 5:298–308. [DOI] [PMC free article] [PubMed] [Google Scholar]
- de Lacy N, Doherty D, King B, Rachakonda S, Calhoun V (2017) Disruption to control network function correlates with altered dynamic connectivity in the wider autism spectrum. NeuroImage: Clinical, 15:513–524. [DOI] [PMC free article] [PubMed] [Google Scholar]
- Di Martino A, Fair DA, Kelly C, Satterthwaite TD, Castellanos FX, Thomason ME, Craddock RC, Luna B, Leventhal BL, Zuo XN, Milham MP (2014) Unraveling the miswired connectome: a developmental perspective. Neuron, 83:1335–53. [DOI] [PMC free article] [PubMed] [Google Scholar]
- Di Martino A, Ross K, Uddin LQ, Sklar AB, Castellanos FX, Milham MP (2009a) Functional brain correlates of social and nonsocial processes in autism spectrum disorders: an activation likelihood estimation meta-analysis. Biol Psychiatry, 65:63–74. [DOI] [PMC free article] [PubMed] [Google Scholar]
- Di Martino A, Shehzad Z, Kelly C, Roy AK, Gee DG, Uddin LQ, Gotimer K, Klein DF, Castellanos FX, Milham MP (2009b) Relationship between cingulo-insular functional connectivity and autistic traits in neurotypical adults. Am J Psychiatry, 166:891–9. [DOI] [PMC free article] [PubMed] [Google Scholar]
- Dosenbach NUF, Nardos B, Cohen AL, Fair DA, Power JD, Church JA, Nelson SM, Wig GS, Vogel AC, Lessov-Schlaggar CN, Barnes KA, Dubis JW, Feczko E, Coalson RS, Pruett JR, Barch DM, Petersen SE, Schlaggar BL (2010) Prediction of Individual Brain Maturity Using fMRI. Science, 329:1358–1361. [DOI] [PMC free article] [PubMed] [Google Scholar]
- Erhardt EB, Rachakonda S, Bedrick EJ, Allen EA, Adali T, Calhoun VD (2011) Comparison of multi-subject ICA methods for analysis of fMRI data. Human brain mapping, 32:2075–95. [DOI] [PMC free article] [PubMed] [Google Scholar]
- Faghiri A, Stephen JM, Wang YP, Wilson TW, Calhoun VD (2018) Changing brain connectivity dynamics: From early childhood to adulthood. Human brain mapping, 39:1108–1117. [DOI] [PMC free article] [PubMed] [Google Scholar]
- Fransson P, Skiold B, Horsch S, Nordell A, Blennow M, Lagercrantz H, Aden U (2007) Resting-state networks in the infant brain. P Natl Acad Sci USA, 104:15531–15536. [DOI] [PMC free article] [PubMed] [Google Scholar]
- Freire L, Mangin JF (2001) Motion correction algorithms may create spurious brain activations in the absence of subject motion. Neuroimage, 14:709–22. [DOI] [PubMed] [Google Scholar]
- Friedman J, Hastie T, Tibshirani R (2008) Sparse inverse covariance estimation with the graphical lasso. Biostatistics, 9:432–41. [DOI] [PMC free article] [PubMed] [Google Scholar]
- Gao W, Gilmore JH, Giovanello KS, Smith JK, Shen D, Zhu H, Lin W (2011) Temporal and spatial evolution of brain network topology during the first two years of life. PLoS One, 6:e25278. [DOI] [PMC free article] [PubMed] [Google Scholar]
- Geschwind DH, Levitt P (2007) Autism spectrum disorders: developmental disconnection syndromes. Curr Opin Neurobiol, 17:103–111. [DOI] [PubMed] [Google Scholar]
- Hasson U, Avidan G, Gelbard H, Vallines I, Harel M, Minshew N, Behrmann M (2009) Shared and idiosyncratic cortical activation patterns in autism revealed under continuous real-life viewing conditions. Autism Res, 2:220–31. [DOI] [PMC free article] [PubMed] [Google Scholar]
- Hernandez LM, Rudie JD, Green SA, Bookheimer S, Dapretto M (2015) Neural signatures of autism spectrum disorders: insights into brain network dynamics. Neuropsychopharmacology, 40:171–89. [DOI] [PMC free article] [PubMed] [Google Scholar]
- Himberg J, Hyvarinen A, Esposito F (2004) Validating the independent components of neuroimaging time series via clustering and visualization. Neuroimage, 22:1214–22. [DOI] [PubMed] [Google Scholar]
- Hull JV, Jacokes ZJ, Torgerson CM, Irimia A, Van Horn JD (2016) Resting-State Functional Connectivity in Autism Spectrum Disorders: A Review. Front Psychiatry, 7:205. [DOI] [PMC free article] [PubMed] [Google Scholar]
- Hutchison RM, Morton JB (2015) Tracking the Brain’s Functional Coupling Dynamics over Development. J Neurosci, 35:6849–59. [DOI] [PMC free article] [PubMed] [Google Scholar]
- Hutchison RM, Womelsdorf T, Allen EA, Bandettini PA, Calhoun VD, Corbetta M, Penna S, Duyn JH, Glover GH, Gonzalez-Castillo J, Handwerker DA, Keilholz S, Kiviniemi V, Leopold DA, Pasquale F, Sporns O, Walter M, Chang C (2013a) Dynamic functional connectivity: Promise, issues, and interpretations. Neuroimage, 80:360–378. [DOI] [PMC free article] [PubMed] [Google Scholar]
- Hutchison RM, Womelsdorf T, Gati JS, Everling S, Menon RS (2013b) Resting-state networks show dynamic functional connectivity in awake humans and anesthetized macaques. Human brain mapping, 34:2154–77. [DOI] [PMC free article] [PubMed] [Google Scholar]
- Jaddoe VWV, van Duijn CM, Franco OH, van der Heijden AJ, van IIzendoorn MH, de Jongste JC, van der Lugt A, Mackenbach JP, Moll HA, Raat H, Rivadeneira F, Steegers EAP, Tiemeier H, Uitterlinden AG, Verhulst FC, Hofman A (2012) The Generation R Study: design and cohort update 2012. Eur J Epidemiol, 27:739–756. [DOI] [PubMed] [Google Scholar]
- Johnson MH, Munakata Y (2005) Processes of change in brain and cognitive development. Trends in cognitive sciences, 9:152–158. [DOI] [PubMed] [Google Scholar]
- Jung M, Kosaka H, Saito DN, Ishitobi M, Morita T, Inohara K, Asano M, Arai S, Munesue T, Tomoda A, Wada Y, Sadato N, Okazawa H, Iidaka T (2014) Default mode network in young male adults with autism spectrum disorder: relationship with autism spectrum traits. Mol Autism, 5:35. [DOI] [PMC free article] [PubMed] [Google Scholar]
- Kennedy DP, Redcay E, Courchesne E (2006) Failing to deactivate: resting functional abnormalities in autism. Proc Natl Acad Sci U S A, 103:8275–80. [DOI] [PMC free article] [PubMed] [Google Scholar]
- Langen CD, White T, Ikram MA, Vernooij MW, Niessen WJ (2015) Integrated Analysis and Visualization of Group Differences in Structural and Functional Brain Connectivity: Applications in Typical Ageing and Schizophrenia. PLoS One, 10:e0137484. [DOI] [PMC free article] [PubMed] [Google Scholar]
- Lenroot RK, Giedd JN (2006) Brain development in children and adolescents: insights from anatomical magnetic resonance imaging. Neurosci Biobehav Rev, 30:718–29. [DOI] [PubMed] [Google Scholar]
- Muetzel RL, Blanken LM, Thijssen S, van der Lugt A, Jaddoe VW, Verhulst FC, Tiemeier H, White T (2016) Resting-state networks in 6-to-10 year old children. Human brain mapping, 37:4286–4300. [DOI] [PMC free article] [PubMed] [Google Scholar]
- Nomi JS, Uddin LQ (2015) Developmental changes in large-scale network connectivity in autism. NeuroImage: Clinical, 7:732–741. [DOI] [PMC free article] [PubMed] [Google Scholar]
- Price T, Wee C-Y, Gao W, Shen D (Multiple-network classification of childhood autism using functional connectivity dynamics). In; 2014. Springer; p 177–184. [DOI] [PubMed] [Google Scholar]
- Rashid B, Damaraju E, Pearlson GD, Calhoun VD (2014) Dynamic connectivity states estimated from resting fMRI Identify differences among Schizophrenia, bipolar disorder, and healthy control subjects. Front Hum Neurosci, 8:897. [DOI] [PMC free article] [PubMed] [Google Scholar]
- Robinson S, Basso G, Soldati N, Sailer U, Jovicich J, Bruzzone L, Kryspin-Exner I, Bauer H, Moser E (2009) A resting state network in the motor control circuit of the basal ganglia. BMC neuroscience, 10:1. [DOI] [PMC free article] [PubMed] [Google Scholar]
- Sakoglu U, Pearlson GD, Kiehl KA, Wang YM, Michael AM, Calhoun VD (2010) A method for evaluating dynamic functional network connectivity and task-modulation: application to schizophrenia. MAGMA, 23:351–66. [DOI] [PMC free article] [PubMed] [Google Scholar]
- Simmonds DJ, Hallquist MN, Asato M, Luna B (2014) Developmental stages and sex differences of white matter and behavioral development through adolescence: a longitudinal diffusion tensor imaging (DTI) study. Neuroimage, 92:356–68. [DOI] [PMC free article] [PubMed] [Google Scholar]
- Smith SM, Miller KL, Salimi-Khorshidi G, Webster M, Beckmann CF, Nichols TE, Ramsey JD, Woolrich MW (2011) Network modelling methods for FMRI. Neuroimage, 54:875–91. [DOI] [PubMed] [Google Scholar]
- Stigler KA, McDonald BC, Anand A, Saykin AJ, McDougle CJ (2011) Structural and functional magnetic resonance imaging of autism spectrum disorders. Brain Res, 1380:146–61. [DOI] [PMC free article] [PubMed] [Google Scholar]
- Uddin LQ, Supekar K, Lynch CJ, Khouzam A, Phillips J, Feinstein C, Ryali S, Menon V (2013a) Salience Network-Based Classification and Prediction of Symptom Severity in Children With Autism. Jama Psychiat, 70:869–879. [DOI] [PMC free article] [PubMed] [Google Scholar]
- Uddin LQ, Supekar K, Menon V (2013b) Reconceptualizing functional brain connectivity in autism from a developmental perspective. [DOI] [PMC free article] [PubMed]
- Varoquaux G, Baronnet F, Kleinschmidt A, Fillard P, Thirion B (2010) Detection of brain functional-connectivity difference in post-stroke patients using group-level covariance modeling. Med Image Comput Comput Assist Interv, 13:200–8. [DOI] [PubMed] [Google Scholar]
- Wee CY, Yap PT, Shen D (2016) Diagnosis of Autism Spectrum Disorders Using Temporally Distinct Resting‐State Functional Connectivity Networks. CNS neuroscience & therapeutics, 22:212–219. [DOI] [PMC free article] [PubMed] [Google Scholar]
- White T, El Marroun H, Nijs I, Schmidt M, van der Lugt A, Wielopolki PA, Jaddoe VWV, Hofman A, Krestin GP, Tiemeier H, Verhulst FC (2013) Pediatric population-based neuroimaging and the Generation R Study: the intersection of developmental neuroscience and epidemiology. Eur J Epidemiol, 28:99–111. [DOI] [PubMed] [Google Scholar]
- White T, Muetzel R, Schmidt M, Langeslag SJ, Jaddoe V, Hofman A, Calhoun VD, Verhulst FC, Tiemeier H (2014) Time of acquisition and network stability in pediatric resting-state functional magnetic resonance imaging. Brain Connect, 4:417–27. [DOI] [PMC free article] [PubMed] [Google Scholar]
Associated Data
This section collects any data citations, data availability statements, or supplementary materials included in this article.