

Abstract
Few studies have investigated in vivo changes of the cholinergic basal forebrain in Alzheimer’s disease (AD) and amnestic mild cognitive impairment (MCI), an at risk stage of AD. Even less is known about alterations of cortical projecting fiber tracts associated with basal forebrain atrophy. In this study, we determined regional atrophy within the basal forebrain in 21 patients with AD and 16 subjects with MCI compared to 20 healthy elderly subjects using deformation-based morphometry of MRI scans. We assessed effects of basal forebrain atrophy on fiber tracts derived from high-resolution diffusion tensor imaging (DTI) using tract-based spatial statistics. We localized significant effects relative to a map of cholinergic nuclei in MRI standard space as determined from a postmortem brain. Patients with AD and MCI subjects showed reduced volumes in basal forebrain areas corresponding to anterior medial and lateral, intermediate and posterior nuclei of the Nucleus basalis of Meynert (NbM) as well as in the diagonal band of Broca nuclei (P < 0.01). Effects in MCI subjects were spatially more restricted than in AD, but occurred at similar locations. The volume of the right antero-lateral NbM nucleus was correlated with intracortical projecting fiber tract integrity such as the corpus callosum, cingulate, and the superior longitudinal, inferior longitudinal, inferior fronto-occipital, and uncinate fasciculus (P < 0.05, corrected for multiple comparisons). Our findings suggest that a multimodal MRI-DTI approach is supportive to determine atrophy of cholinergic nuclei and its effect on intracortical projecting fiber tracts in AD.
Keywords: Nucleus basalis Meynert, basal forebrain, cholinergic degeneration, diffusion tensor imaging, early diagnosis
INTRODUCTION
Several postmortem studies have reported loss of cholinergic neurons in the basal forebrain (BF) [Cullen and Halliday, 1998; Geula et al., 2008; Lehericy et al., 1993; Vogels et al., 1990; Whitehouse et al., 1981] and decline of cortical choline-acetyltransferase and cholinesterase activity [Gil-Bea et al., 2005; McGeer et al., 1984; Ruberg et al., 1990] in patients with Alzheimer’s disease (AD) compared to nondemented control subjects.
Given the relevance for clinical diagnosis of AD, considerable efforts have been made in recent years to determine in vivo the integrity of the BF cholinergic nuclei by using MRI-based imaging studies. The majority of these nuclei are located ventral to the anterior commissure within the substantia innominata [Mesulam, 1996; Mesulam and Geula, 1988]. The thickness of the substantia innominata was found to be reduced at the level of the anterior commissure in patients with AD compared to healthy control subjects [Hanyu et al., 2002, 2007]. Automated voxel-based morphometry (VBM) also revealed significant reductions of the substantia innominata in both AD and patients with Lewy bodies dementia, although the pattern of cortical atrophy was markedly different between both clinical populations [Whitwell et al., 2007]. Furthermore, a significantly increased risk to develop dementia was found over 4 years follow-up in cognitively normal subjects with atrophy of the BF at baseline [Hall et al., 2008]. This study points to incipient damage of BF cholinergic structures in the pre-clinical stages of AD, although information on specific cholinergic nuclei affected within the BF would provide valuable insights into the pathophysiology of early AD.
By using histological sections of postmortem brains and correspondent MRI, two independent studies have located BF changes in areas corresponding to anterior lateral and anterior medial as well as posterior Nucleus basalis of Meynert (NbM) in patients with AD and MCI subjects [Grothe et al., 2009; Teipel et al., 2005] using anatomical maps from postmortem MRI [Heinsen et al., 2006] and newly developed probabilistic, cytoarchitectonic maps of BF magnocellular compartments in MNI space [Zaborszky et al., 2008].
Impact of cholinergic degeneration on AD not only extends to the cholinergic neurons in the NbM, but also to their fiber systems projecting to cortical input areas. Cholinergic fibers innervating the human cerebral cortex originate mainly from the NbM Ch4 region [Mesulam and Geula, 1988], and their spatial distribution was determined in one seminal study of postmortem sections [Selden et al., 1998]. However, little is known about the distribution of cholinergic fiber tracts in the human brain from in vivo imaging data. Previous studies have visually rated white matter hyperintensities within cholinergic pathways in patients with AD and then related these lesions to changes in cognitive function [Behl et al., 2007; Bocti et al., 2005], but this approach does not provide information about the topographic distribution of damage within the cholinergic fiber system. Diffusion tensor imaging (DTI) has evolved as a powerful approach to detect and quantify white matter fiber tracts in the human brain [Assaf and Pasternak, 2008; Mori and Zhang, 2006], which could have further implications to broaden our understanding about the pathophysiology of AD [Teipel et al., 2008]. Fractional anisotropy together with descriptors obtained from tract-based spatial statistics have been used to demonstrate the spatial distribution of fiber tracts and neuronal networks in the living human brain in an unbiased way [Damoiseaux et al., 2009; Stricker et al., 2009].
This study was aimed at determining (i) atrophic changes in the BF cholinergic nuclei of subjects with MCI and patients with AD, and (ii) whether the subcortical fiber tracts associated with the NbM Ch4 cholinergic nuclei show significant changes. Since the antero-lateral region of the NbM cholinergic nuclei (Ch4al) has consistently been found to be atrophied in two previous studies encompassing independent samples [Grothe et al., 2009; Teipel et al., 2005], we focused on this region to determine associations between BF atrophy and fiber tract integrity. We combined BF volumetry, mapped in reference to the localization of the cholinergic nuclei in MRI standard space based on postmortem data [Teipel et al., 2005], with DTI-based detection of fiber tract integrity to determine fiber tracts that were associated with the atrophy of specific cholinergic nuclei in amnestic MCI subjects, and patients with AD. We expect that these data will help us to determine the distribution of cholinergic fiber tracts in the living human brain and will be useful to establish an in vivo marker of the structural integrity and functionality of the BF cholinergic system in AD.
SUBJECTS AND METHODS
Subjects
We examined 21 patients with the clinical diagnosis of probable AD, and 16 subjects with the clinical diagnosis of amnestic MCI. For comparison, we investigated 20 cognitively healthy elderly subjects. Group characteristics are summarized in Table I. The Mini-Mental-State Examination (MMSE) was used to assess the overall level of cognitive impairment [Folstein et al., 1975].
TABLE I.
Group characteristics
| Group | m/fa | Age in yearsb (SD)/range | Education in yearsc (SD)/range | MMSE (SD)/range |
|---|---|---|---|---|
| Healthy controls | 12/8 | 67.0 (7.3)/56–83 | 12.9 (3.6) 8–20 | 29.0 (0.7) 28–30 |
| AD patients | 9/12 | 76.1 (7.4)/58–87 | 11.0 (1.9) 8–18 | 22.9 (3.0) 17–29 |
| MCI patients | 9/7 | 73.6 (7.8)/60–88 | 11.6 (2.3) 7–17 | 26.5 (1.1) 24–28 |
Not significantly different between the three groups, χ2 = 0.86, 2 df, P = 0.65
Significantly different between AD and controls, T = −3.98, 39 df, P < 0.001, and MCI and controls T = −2.60, 34 df, P < 0.015. Not significantly different between AD and MCI, T = 1.03, 35 df, P = 0.31.
Significantly different between AD and controls, T = 2.17, 39 df, P < 0.05. Not significantly different between MCI and controls, T = 1.32, 34 df, P = 0.19, and between AD and MCI, T = 0.81, 35 df, P = 0.42.
Clinically probable AD was diagnosed according to NINCDS-ADRDA criteria [McKhann et al., 1984]. Amnestic MCI was diagnosed according to Mayo Clinic Criteria [Petersen, 2004] with subjects showing subjective memory impairment, scoring more than 1.5 standard deviations below the age- and education-adjusted mean in tests of immediate and delayed verbal and nonverbal memory, having unimpaired general cognition and activities of daily living and receiving a Clinical Dementia Rating (CDR) score of 0.5 [Fillenbaum et al., 1996]. Healthy volunteers were spouses of our patients who had no subjective memory complaints, and normal scores in subtests of the CERAD cognitive battery [Berres et al., 2000], trail making test part A and B [Chen et al. 2000], and clock drawing test [Shulman et al., 1986]. All healthy control subjects scored 0 in the CDR rating [Morris, 1993].
The clinical assessment included detailed medical history, clinical, psychiatric, neurological and neuropsychological examinations (CERAD battery [Berres et al. 2000], clock-drawing-test [Shulman et al., 1986], trail-making test [Chen et al., 2000]), and laboratory tests (complete blood count, electrolytes, glucose, blood urea nitrogen, creatinine, liver-associated enzymes, cholesterol, HDL, triglycerides, serum B12, folate, thyroid function tests, coagulation, and serum iron).
Selection of subjects included a semiquantitative rating of T2-weighted MRI scans [Scheltens et al., 1993]. To exclude subjects with significant subcortical cerebrovascular lesions, only subjects were included which had no subcortical white matter hyperintensities exceeding 10 mm in diameter or 3 in number.
The study was approved by the institutional review board of the Medical Faculty of the University of Munich. Written informed consent was obtained in every case before examination.
MRI Acquisition
MRI acquisitions of the brain were conducted with a 3.0-Tesla scanner with parallel imaging capabilities (Magnetom TRIO, Siemens, Erlangen, Germany), maximum gradient strength: 45 mT/m, maximum slew rate: 200 T/m/s, 12 element head coil.
For anatomical reference, a sagittal high-resolution three-dimensional gradient-echo sequence was performed (MPRAGE, field-of-view: 250 mm; spatial resolution: 0.8 × 0.8 × 0.8 mm3; repetition time: 2,400 ms; echo time: 3.06 ms; inversion time: 900 ms; flip angle: 20°; number of slices: 160). To identify white matter lesions, a two-dimensional T2-weighted sequence was performed (fluid attenuation inversion recovery FLAIR, field-of-view: 230 mm; repetition time: 9,000 ms; echo time: 117 ms; inversion time: 2,500 ms; voxel size: 0.9 × 0.9 × 5.0 mm3; flip angle: 180°; number of slices: 28).
Diffusion-weighted imaging was performed with an echo-planar-imaging sequence (field-of-view: 256 mm; repetition time: 9,300 ms; echo time: 102 ms; voxel size: 2 × 2 × 2 mm3; four repeated acquisitions, b-value = 1,000, 12 directions, 64 slices, no overlap). Parallel imaging was performed with a generalized autocalibrating partially parallel acquisition [Griswold et al., 2002] reconstruction algorithm and an acceleration factor of 2.
Structural MRI Processing
The processing of structural MRI scans was implemented through statistical parametric mapping, SPM5 (Wellcome Dept. of Imaging Neuroscience, London) and in-house written software algorithms in MATLAB 7.1 (Mathworks, Natwick).
Creation of deformation maps
Deformation maps were created according to a protocol that has been described in detail [Teipel et al., 2007a]. First, we constructed a group specific anatomical template for high-dimensional normalization using low-dimensional [Ashburner and Friston, 2000; Ashburner et al., 1997] and high-dimensional normalization with symmetric priors [Ashburner et al., 1999] based on MPRAGE scans. Second, the individual anatomical scans in standard space (after low-dimensional normalization) were normalized to the anatomical template using high-dimensional image warping [Ashburner et al., 1999]. These normalized images were resliced to a final isotropic voxel size of 1 mm3. Third, we derived Jacobian determinant maps from the voxel-based transformation tensors. These maps were masked for cerebrospinal fluid (CSF) spaces using masks from the segmented anatomical template [Ashburner and Friston, 1997]. We took the logarithm of the masked maps of the Jacobian determinants [Scahill et al., 2002] and then applied a 4-mm full width at half maximum isotropic Gaussian kernel.
Definition of the substantia innominata volumes
The substantia innominata has no clear anatomical borders at its anterior, posterior, and lateral extent. We followed the experience from our previous study based on postmortem histology and in vivo MRI data [Teipel et al., 2005], as well as the findings from two previous morphometric studies based on postmortem data [Grinberg and Heinsen, 2007; Halliday et al., 1993].
We defined for each deformation map two square regions of interest (ROI), one for each cerebral hemisphere, based on the location of the anterior commissure, which forms the boundary of the superior part of the posterior end of the anterior third of the substantia innominata. The ROI extended 25 mm lateral from the midline, 13 mm ventral from the superior edge of the anterior commissure at the midline, and 6 mm anterior and 12 mm posterior from the middle of the anterior commissure, covering a volume of 5,850 mm3 in each hemisphere. The ROI was aligned to the middle of the anterior commissure in the left-right direction, the middle of the anterior commissure in the anterior-posterior direction, and the superior border of the anterior commissure in cranial-ventral direction.
Postmortem Map
The creation of the localization map of BF cholinergic nuclei in MNI standard space has previously been described [Teipel et al., 2005]. We used this map to relate the group effects in local deformations to the anatomical position of the BF nuclei in MNI space. See Figure 1 for a three-dimensional representation of the anatomical details of the BF cholinergic nuclei determined from the brain of a 29-year-old man [Grinberg and Heinsen, 2007].
Figure 1.
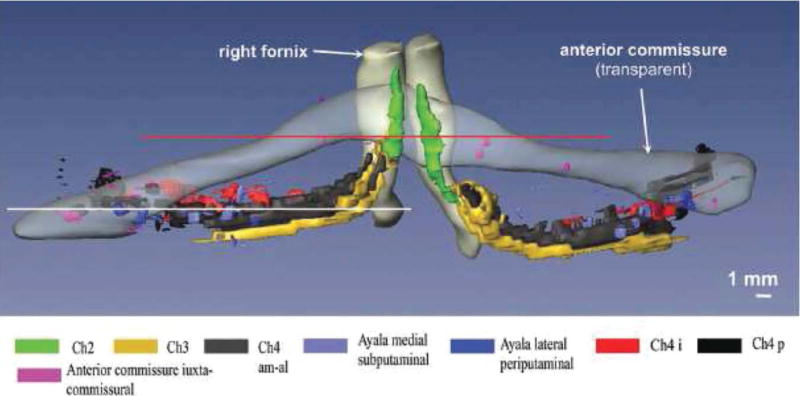
Anatomy of the basal forebrain complex. 3D-reconstruction of the basal forebrain complex (BFC–view from anterior) from the brain of a 29-year-old man who had died of pulmonary arrest [Grinberg and Heinsen, 2007]. The BFC is located within the substantia innominata that is delimited by the caudal rim of the ventral striatum, the ventral pallidum, the ventral parts of the internal capsule and the regions medial to the outlines of the anterior commissure. The BCF can be subdivided into four cell groups arranged in an arch-like path mainly beneath the anterior commissure: Ch1 or medial septal nucleus; Ch2 and Ch3 or the nucleus of vertical and horizontal limb of the diagonal band of Broca, respectively; and Ch4 also called as the nucleus basalis of Meynert [Mesulam et al., 1983]. The nucleus subputaminalis, also called Ayala’s nucleus, has only been described in the human brain so far [Heinsen et al., 2006; Simic et al., 1999]. The volume of the BFC in the human brain varies from 58 to 154 mm3 [Grinberg and Heinsen, 2007; Halliday et al., 1993].
Diffusion Tensor Imaging Analysis
DTI data were analyzed using tract-based spatial statistics (TBSS) v1.2 implemented in FSL 4.1 (FMRIB Analysis Group, Oxford, UK, http://www.fmrib.ox.ac.uk/analysis/research/tbss) [Smith et al., 2006]. TBSS allows spatial reorientation of fractional anisotropy (FA) maps into standard space without systematic effects of spatial transformation on fiber tract directionality and without the need to select a spatial smoothing kernel that may impact the effects of interest. First, FA images were created by fitting a tensor model to the raw diffusion data using FDT (FMRIB’s Diffusion Toolbox integrated in the FSL software), and then brain-extracted using BET (Brain Extraction Tool) [Smith, 2002]. All subjects’ FA data were then aligned into a common space using the nonlinear registration tool FNIRT [Andersson et al., 2007a,b], which uses a b-spline representation of the registration warp field [Rueckert et al., 1999]. Next, the mean FA image was created and thinned to obtain a mean FA skeleton which represents the centers of all tracts common to the group. Each subject’s aligned FA data was then projected onto this skeleton and the resulting data fed into voxelwise cross-subject statistics.
Localization
Localization of peak effects was based on the coordinates from the MNI template. We used a nonlinear algorithm provided by Matthew Brett (MRC Cognition and Brain Sciences Unit, Cambridge, UK) [Brett et al., 2002], to transform MNI into Talairach coordinates. Peak correlations then were identified from the Talairach and Tournoux atlas [Talairach and Tournoux, 1988] based on these coordinates. The effects of BF atrophy on FA values were projected in MNI space (Fig. 4). To find the corresponding z-coordinate in Talairach-Tournoux space, the original MNI space axial slices were compared to the Talairach and Tournoux atlas and the slice from the atlas that was closest to the given MNI space slice defined the z-coordinate in Talairach-Tournoux space.
Figure 4.
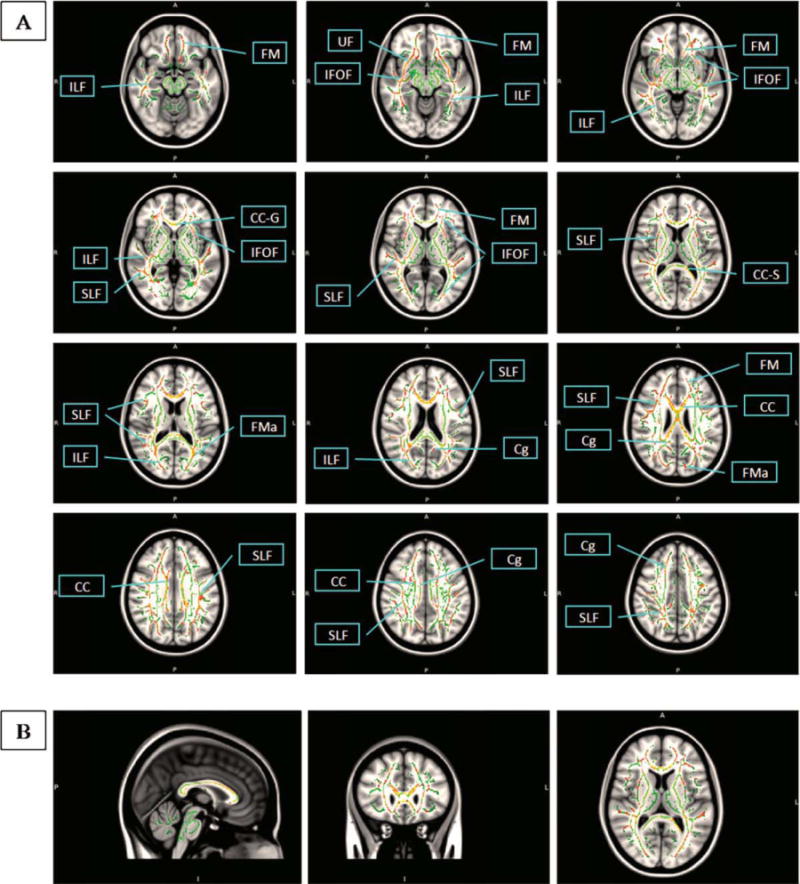
Effects of basal forebrain atrophy on fiber tract integrity. Atrophy effects in right antero-lateral basal forebrain (Ch4al) regressed on DTI-based FA maps of fiber tract integrity determined using TBSS, P < 0.05, corrected for multiple comparisons using permutation test. Effects (red) are projected on a fiber tract template in MNI standard space (green). Axial slices go from MNI (Talairach-Tournoux) coordinate z = −12 to z = 43 (40) and are 5 mm apart in MNI space. A, anterior/P, posterior; L, left/R, right; I, inferior; CC, corpus callosum; CC-G, corpus callosum genu; CC-S, corpus callosum splenium; Cg, cingulate; FM, forceps minor; FMa, forceps major; IFOF, inferior fronto-occipital fasciculus; ILF, inferior longitudinal fasciculus; SLF, superior longitudinal fasciculus; UF, uncinate fasciculus.
Statistical Analysis
Structural MRI data
For statistical analysis we used the general linear model on a voxel basis implemented in SPM5. Regression analysis was only applied to the Jacobian determinant values of voxels within the defined ROI. Prior to regression analysis, Jacobian determinant values were proportionally scaled to the global mean. We only considered significant effects in the negative direction, i.e. decrease of volume relative to controls in patients with AD and subjects with MCI. Because of the relatively small search volume, results were thresholded at an uncorrected P-level <0.01, and an extent threshold of five contiguous voxels was applied. Independent multiple regression models were calculated for the effect of diagnosis (AD or MCI versus controls) and for the effect of diagnosis controlled for age.
Combination of structural MRI with DTI data
We determined the peak location of the group difference between the patients with AD and controls within the Ch4 region in both hemispheres. We regressed the Jacobian determinant values from these two peak locations on the TBSS FA maps using a voxel-based ANCOVA model with diagnosis and Jacobian determinant values as main effects and interaction terms for diagnosis by Jacobian determinant values. We determined the effect of Jacobian determinant values on fiber tract integrity over all three groups controlling for the effect of diagnosis and separately for each diagnostic group (AD, controls, MCI). Statistical significance was determined at P < 0.05, corrected for multiple comparisons using permutation test as implemented in the FSL 4.1 submodule Randomise (FMRIB Analysis Group, Oxford, UK, http://www.fmrib.ox.ac.uk/analysis/research/tbss) using 500 permutations and threshold-free cluster enhancement.
RESULTS
BF Changes Between AD and Healthy Aging
In the right hemisphere (Supp. Info. Fig. S1 and Table SI) a large cluster of reduced volume in patients with AD compared to controls was observed anterior to the anterior commissure overlapping with areas belonging to Ch2, Ch3 and extending to Ch4am as well as most prominently area Ch4al, following Mesulam’s nomenclature [Mesulam et al., 1983]. More posterior this cluster overlapped with areas belonging to Ch4i and Ch4p. In addition, there was a cluster located in the globus pallidus. For the left hemisphere effects were less pronounced (Supp. Info. Fig. S1 and Table SI). Effects overlapped with Ch2, Ch3, Ch4am, Ch4al. In addition, effects were located lateral from Ch4i and overlapping with Ch4p.
When the linear model was controlled for age, effects were less pronounced. In the right hemisphere the overlap remained with Ch2, Ch3, Ch4al and Ch4am, and Ch4i (Fig. 2, Table II). For the left hemisphere, effects remained for Ch4al (Fig. 2, Table II).
Figure 2.
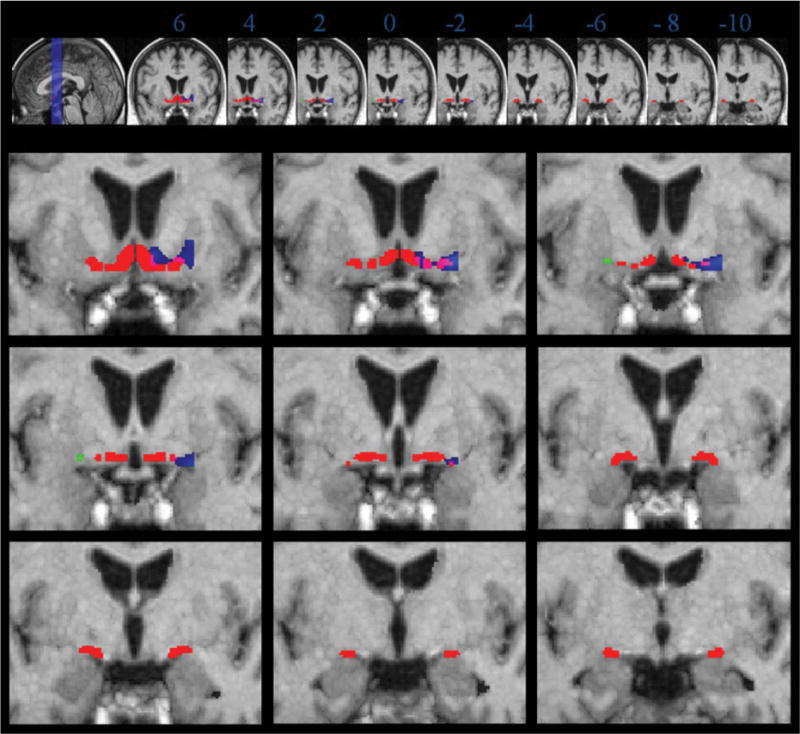
Volume reduction in patients with AD compared to controls, age correction. Coronal sections through the group specific template are from anterior to posterior, 2 mm apart, starting at Talairach-Tournoux coordinate y = 6. Numbers underneath each slice in the upper row indicate the level of the coronal section in Talairach-Tournoux coordinate y. Left of image is left of brain (view from posterior). Red: localization of the postmortem map of basal forebrain cholinergic nuclei in MNI space. Blue: volume reductions in patients with AD compared to controls in the right hemisphere. Green: volume reductions in patients with AD compared to controls in the left hemisphere. Overlapping voxels between the effects of volume reduction and the localization of the postmortem map are indicated in pink (right hemisphere) and yellow (left hemisphere), respectively. Voxel are shown passing the height threshold P < 0.01, uncorrected for multiple comparisons. The cluster extension, representing the number of contiguous voxels was set at ≥5.
TABLE II.
Decrease of volume in patients with AD compared to controls (corrected for age)
| Region | Side | CE | Coordinates (mm)
|
T38 | ||
|---|---|---|---|---|---|---|
| x | y | z | ||||
| Lateral subst. innominata (Ch4al) | R | 566 | 23 | 4 | −7 | 5.21 |
| Anteromedial subst. innominata (Ch2/3) | R | 8 | 6 | −5 | 3.92 | |
| Putamen | R | 24 | 6 | 0 | 3.67 | |
| Posterior subst. innominata (Ch4p) | R | 4 | 24 | −11 | −8 | 2.54 |
| Globus pallidus | R | 3 | 8 | −4 | −1 | 2.49 |
| Lateral subst. innominata (Ch4al) | L | 33 | −23 | 1 | −8 | 3.16 |
The height threshold was set at P < 0.01, uncorrected for multiple comparisons. The cluster extension, representing the number of contiguous voxels passing the height threshold was set at ≥5.
Coordinates in bold delineate a cluster and the peak T-value (38 degrees of freedom) within the cluster. Subsequent nonbold coordinates identify further peaks within the same cluster that meet the significance level.
Brain regions are indicated by Talairach and Tournoux coordinates, x, y, and z [Talairach and Tournoux, 1988]: x, the medial to lateral distance relative to midline (positive = right hemisphere); y, the anterior to posterior distance relative to the anterior commissure (positive = anterior); z, superior to inferior distance relative to the anterior commissure-posterior commissure line (positive = superior). R/L, right/left; CE, cluster extension, number of contiguous voxels passing the height threshold.
BF Changes Between MCI and Healthy Aging
Effects in MCI were less pronounced than in AD. For the right hemisphere, we found one cluster extending from Ch2 and 3 through Ch4al to Ch4i and Ch4p. In addition, there was a peak in the putamen (Supp. Info. Fig. S2 and Table SII). For the left hemisphere, there was a cluster in the putamen extending to Ch4al, together with further clusters located in Ch4i and Ch4p. In addition, a small cluster was found at the border of the third ventricle (Supp. Info. Fig. S2 and Table SII).
When the linear model was controlled for age, effects were less pronounced. In the right hemisphere, results remained overlapping with Ch4al, Ch4am, Ch4i, and Ch4p. In addition, there remained a cluster in the putamen (Fig. 3, Table III). For the left hemisphere, clusters disappeared after age correction at P < 0.01. At a more liberal level of significance with P < 0.05, effects were identical to the findings at P < 0.01 without age correction, overlapping with Ch4al, Ch4i, and Ch4p and including a cluster at the border of the third ventricle (data not shown).
Figure 3.
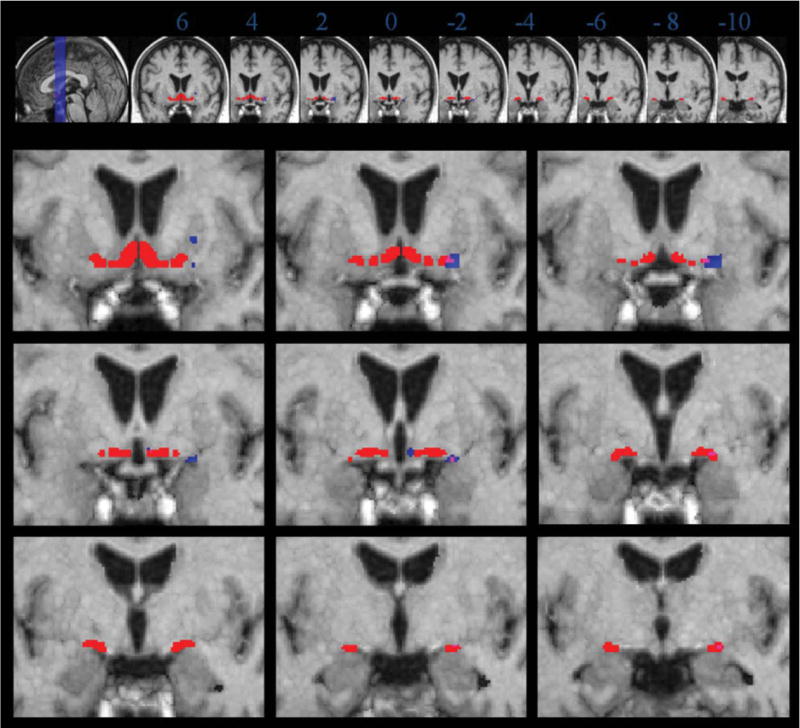
Volume reduction in MCI subjects compared to controls, age correction. Blue: volume reductions in MCI patients compared to controls in the right hemisphere. Green: volume reductions in MCI patients compared to controls in the left hemisphere. For rest of legend see legend to Figure 2.
TABLE III.
Decrease of volume in MCI subjects compared to controls (corrected for age)
| Region | Side | CE | Coordinates (mm)
|
T33 | ||
|---|---|---|---|---|---|---|
| x | Y | z | ||||
| Lateral subst. innominata (Ch4al) | R | 210 | 22 | 3 | −10 | 3.79 |
| Posterior subst. innominata (Ch4p) | R | 15 | 24 | −11 | −8 | 2.98 |
| Putamen | R | 8 | 23 | 6 | 0 | 2.82 |
| Medial subst. innominata (Ch4i) | R | 21 | 4 | −2 | −7 | 2.70 |
The height threshold was set at P < 0.01, uncorrected for multiple comparisons. The cluster extension, representing the number of contiguous voxels passing the height threshold was set at ≥5.
Coordinates in bold delineate a cluster and the peak T-value (33 degrees of freedom) within the cluster. Subsequent nonbold coordinates identify further peaks within the same cluster that meet the significance level.
Brain regions are indicated by Talairach and Tournoux coordinates, x, y, and z [Talairach and Tournoux, 1988]: x, the medial to lateral distance relative to midline (positive = right hemisphere); y, the anterior to posterior distance relative to the anterior commissure (positive = anterior); z, superior to inferior distance relative to the anterior commissure-posterior commissure line (positive = superior). R/L, right/left; CE, cluster extension, number of contiguous voxels passing the height threshold.
Comparing patients with AD and MCI subjects, for the left hemisphere we found one single cluster of reduced volume in patients with AD compared to MCI subjects corresponding to region Ch2/3 (Talairach-Tournoux x/y/z = −5/6/−8). For the right hemisphere, there was one single cluster located in Ch4am (Talairach-Tournoux x/y/z = 12/4/−10), Supporting Information Figure 3.
Effect of BF Atrophy on Fiber Tract Integrity
We extracted Jacobian determinant values at the right and left peak location of the Ch4al cluster representing the difference between patients with AD and controls (Talairach and Tournoux coordinates [x/y/z] = [22/4/−7] for the right hemispheric and [−17/5/−7] for spheric the left hemi-Ch4al peak, respectively, compare Table I and Supp. Info. Table I). We regressed these values on the TBSS FA maps, after controlling for diagnosis. Across the three groups the right hemispheric peak showed a significant correlation with wide-spread clusters involving intracortical projecting fiber tracts such as corpus callosum, cingulate, superior longitudinal fasciculus, inferior longitudinal fasciculus, inferior fronto-occipital fasciculus, forceps minor, and uncinate fasciculus at P < 0.05, corrected for multiple comparisons (Fig. 4). Corticofugal fiber systems were spared. These results were almost entirely driven by the effects in the patients with AD, whereas topographic white matter changes in controls were restricted to the anterior corpus callosum and corpus callosum truncus. The MCI group showed no effect of peak Jacobian determinant values on any fiber tract. The left hemispheric peak showed no significant association with fiber tracts. When the regression models were controlled for age and MMSE score, the effects remained essentially unchanged.
DISCUSSION
Here we investigated if volumetric changes in the BF of patients with AD and MCI subjects were accompanied by variations in white matter fiber tracts. By combining BF morphometry with DTI data, we determined the fiber systems that were associated with BF atrophy in NbM Ch4 regions. In the patients with AD, we found significant atrophy in the anteromedial, lateral, and posterior substantia innominata, matching the localization of cholinergic nuclei Ch2, Ch3, Ch4al, Ch4i, and Ch4p, following Mesulam’s nomenclature [Grinberg and Heinsen, 2007; Mesulam et al., 1983] (Fig. 1 for anatomical details). Effects in MCI subjects were less pronounced than in patients with AD, but occurred in similar localizations. Subjects with MCI showed significant atrophy compared to controls in BF areas including the positions of Ch2, Ch3, Ch4al, Ch4am, and Ch4p. We also found widespread effects of right hemispheric BF atrophy in Ch4al on intracortical projecting fiber tracts that were mainly driven by the AD patients group.
We found significant atrophy in anterolateral, intermediate, and posterior NbM nuclei, as well as in areas of the diagonal band nucleus (Ch2 and Ch3). Effects were more pronounced in the right than the left hemisphere. The effects showed strong overlap with the localization of the BF nuclei as determined from the histological sections and postmortem MRI of the brain of a nondemented elderly woman that had undergone autopsy [Teipel et al., 2005]. These findings agree with those from a previous study in an independent group [Teipel et al., 2005]. Several earlier studies had also described atrophy in the BF but had not mapped the location of changes onto different BF nuclei [Hanyu et al., 2002, 2007; Muth et al., 2010; Whitwell et al., 2007].
Amnestic MCI subjects showed significant atrophy in the BF as well. The localization of the effects was similar to those of the patients with AD. Subjects with amnestic MCI have been found to have an increased risk to develop AD (about 20% conversion per year) [Fischer et al., 2007; Lopez et al., 2007; Maioli et al., 2007]. The locations of the effects were comparable to those in a recent study on BF atrophy in an independent sample of MCI subjects [Grothe et al., 2009] using a mapping of cholinergic nuclei through a probabilistic BF atlas [Zaborszky et al., 2008]. Taken together these findings in two independent samples suggest that BF changes precede the onset of dementia in at risk subjects. This interpretation is also compatible with the reported reductions of BF in cognitively normal subjects who later developed AD using a voxel-based morphometry approach [Hall et al., 2008]. However, the method used in this earlier study did not differentiate atrophy effects within BF areas.
It is still under debate whether loss of BF cholinergic neurons occurs early in AD. Autopsy studies in human brains found a 68–90% decrease of the number of BF large cholinergic neurons in advanced stages of AD [Vogels et al., 1990; Whitehouse et al., 1981]. These findings agree with the 80% reduction of choline-acetyltransferase activity in the hippocampus and cortex and about 60% decrease of cortical choline-acetyltransferase found in the brains of patients with AD [Bowen et al., 1983; DeKosky et al., 1992]. Postmortem data derived from the religious order study suggest a statistically not significant 20% decline of the number of choline-acetyltransferase positive neurons in MCI subjects and patients with mild AD compared to cognitively intact controls [Gilmor et al., 1999]. However, the study had a small sample size (six controls, seven MCI subjects, and nine patients with AD). On the basis of the reported values, the overall effect size was large with Cohen’s f = 1.3 [Cohen, 1988], suggesting that these effects would reach statistical significance (P < 0.05) if the sample size had been slightly increased. Abnormalities in cortical cholinergic axons and tauopathy of BF cholinergic neurons occurred in subjects as early as in their third decade and increased in frequency in brains of elderly subjects and patients with AD [Geula et al., 2008; Sassin et al., 2000]. However, atrophy of the BF may not only indicate loss of neurons, but also result form neuron shrinkage secondary to lesions to their cortical input areas [Pearson et al., 1983; Vogels et al., 1990]. The atrophic changes in the BF in the MCI group suggest that BF atrophy already occurs in at risk stages of AD, but these effects require further replication in independent samples.
In respect to a potential progression of the atrophy with disease across BF subregions, our findings together with the results of two previous studies in independent samples [Grothe et al., 2009; Teipel et al., 2005] suggest an involvement of Ch4al in AD and MCI. In contrast, Ch4am and Ch2/3 were not consistently involved in MCI and were significantly reduced in AD compared to MCI in our present sample, suggesting that these areas may be later affected in the course of disease. This would suggest a sequence of atrophy from Ch4al to Ch4am and Ch2/3. However, this sequence is based on cross-sectional data and needs further testing in a longitudinal design.
The cholinergic system is widespread throughout the entire cerebrum, involving wide-reaching cortico-petal and intracortical projecting fiber tracts. We determined effects of regional atrophy in Ch4al on fiber tract integrity using voxel-based analysis of DTI derived FA maps. We had selected the Ch4al peak because the Ch4al region has the strongest connections to wide-spread cortical areas in the human brain [Mesulam and Geula, 1988; Selden et al., 1998]. In addition, this region has been found to be atrophied already in two previous studies [Grothe et al., 2009; Teipel et al., 2005] and again in the present independent sample so that effects in this region appear to be consistent across samples and scanners. Effects in Ch2/3 and Ch4p were less consistent between the present and the previous studies. For Ch4p this had to be expected due to the high anatomical variability of this region as shown in a previous paper [Zaborszky et al., 2008]. The outline of Ch2 and 3 is not directly comparable between our template which is oriented on the Mesulam nomenclature [Heinsen et al., 2006] and Zaborsky’s study who used their own delineation criteria [Zaborszky et al., 2008]. Therefore, we focused on Ch4al for correlations with fiber tract integrity. We found significant correlations of right hemispheric atrophy in Ch4al with all major intracortical projecting fiber systems with a sparing of corticofugal fiber tracts. Correlations involved superior and inferior longitudinal fasciculus and inferior fronto-occipital fasciculus, connecting frontal, parietal, temporal, and occipital lobes. In addition, there were effects on the uncinate fasciculus, connecting the prefrontal cortex and inferior temporal cortex, and on a large proportion of the corpus callosum, involving splenium, genu, and truncus areas. This widespread effects generally agree with the wide-spread distribution of cholinergic connections from Ch4al, including dorsal and lateral prefrontal cortex, and the temporal, parietal, and occipital neocortex [Mesulam and Geula, 1988; Selden et al., 1998]. Little data are available on commissural cholinergic fibers in the human brain. Previous evidence from rodents suggests that cholinergic fibers run through the corpus callosum [Eckenstein et al., 1988]. Sections of the corpus callosum lead to hypertrophy of BF neurons in both hemispheres in rats [Pearson et al., 1985, 1987]. The only study tracing cholinergic pathways in the human brain was restricted to within hemispheres pathways [Selden et al., 1998]. However, levels of choline acetyltransferase were lower in corpus callosum than in cortical brain areas but could consistently be detected in postmortem brains sections from one adult subject [Bull et al., 1970]. Our data agree with the notion from animal studies that the corpus callosum contains a significant amount of cholinergic fiber tracts. In summary, the combination of structural MRI and DTI data demonstrate that the cholinergic BF is integrated in a large neuronal network involving major intracortical association tracts.
Preferential involvement of intracortical projecting tracts has been shown in a range of previous DTI studies in AD [Fellgiebel et al., 2008; Rose et al., 2000; Teipel et al., 2007b]. This is consistent with the involvement of cortical association areas in AD pathology [Braak et al., 1997]. Therefore, the association between basal forebrain atrophy and fiber tract changes may represent a specific effect or rather an unspecific effect from an underlying common disease factor. In favor for a specific effect, the correlation between atrophy and fiber tract changes was independent from cofactors such as age and MMSE score, as measure of disease severity. In addition, we determined correlations between hippocampus atrophy and fiber tract integrity. The hippocampus has consistently been found atrophied in AD [Schroeter et al., 2009] so that it can serve as structural surrogate marker for disease severity. We had determined the peak areas of significant atrophy in AD compared to controls within the right and left hippocampus, respectively, and correlated the grey matter atrophy in these areas with the fiber tract maps. However, there was no significant correlation between hippocampus atrophy and fiber tract integrity, underscoring the specificity of the findings for the BF.
We cannot finally explain the right hemispheric dominance of our effects, both in extent of atrophy and in the effects on fiber tracts. As confirmed by the predominance of the patients with AD in driving the effects, the results rely on the use of AD as a natural lesion model. Patients with AD undergo degeneration of their cholinergic system involving neurons in the BF, their fiber projections and their cortical input neurons. The direction of the effects is the same for both local atrophy and fiber degeneration. Therefore, a correlation between local atrophy and fiber tract integrity can uncover the significant covariance between both changes. In terms of peak T-values the effects of atrophy were more pronounced in the right compared to the left BF. This may suggest different stages of degeneration in both hemispheres that may account for the different effects on fiber tract integrity. Numbers of pre-alpha neurons were significantly lower in the right compared to the left entorhinal region in 22 postmortem brains covering an age range between 18 and 86 years [Heinsen et al., 1994]. The effect of age on neuron numbers was nearly identical in both hemispheres, suggesting that starting with a lower number of neurons effects of age and neurodegeneration may reach a critical threshold earlier in the right than the left entorhinal region. The entorhinal pre-alpha neurons receive strong cholinergic input from the BF [Graham et al., 2003]. However, data on left-right asymmetries of neuron numbers in BF cholinergic nuclei are still lacking. Future studies are required to further resolve this question.
Age difference between patients and controls might have influenced between group effects. Several postmortem studies have found that total number of nucleus basalis Meynert neurons in the nineth decade was 20–30% below that in newborns [Lowes-Hummel et al., 1989; Mann et al., 1984; McGeer et al., 1984]. However, within a narrower age-range in adults several studies could not detect significant reductions of neuron numbers [Chui et al., 1984]. This makes it unlikely that the average age difference between groups in our study of 7–9 years is the major cause for the atrophy in the substantia innominata in our subjects. This is further supported by the replication of the peak findings in the lateral substantia innominata after linear effects of age had been taken into account. Since age and diagnosis are highly collinear, the linear model gives a conservative estimate of age-adjusted effects of diagnosis.
A potential limitation in the interpretation of our data is variation of the localization of cholinergic nuclei between subjects. When we compare the localization of our postmortem map that was based on one subject only [Teipel et al., 2005] with a recently published probability map based on 10 postmortem brains [Zaborszky et al., 2008], the localization of Ch2, Ch3, Ch4 al, Ch4 am, and Chi appears to be nearly identical between our map and the probability map. Only Ch4p appears to be different with a more ventral localization of the Ch4p region in our map compared to the probabilistic map. The Ch4p region, however, showed the highest variability in the probability maps among all subregions so that only few voxels were common between subjects in the probabilistic map [Zaborszky et al., 2008].
In summary, our study replicates and extends previous findings on in vivo morphological alterations of the cholinergic system in patients with AD. We further bridged a gap between the integrity of the BF and the cholinergic fibers that innervate the cortical mantle in subjects at high risk for developing AD and patients with AD, suggesting that MRI-based measurement of BF atrophy together with quantitative description of white matter changes may become a valuable in vivo marker for cholinergic neuronal degeneration in AD.
Supplementary Material
Acknowledgments
We thank the staff of the Alzheimer Memorial Center, Department of Psychiatry particularly Christine Sänger and Felician Iancu, and the Department of Radiology at the University of Munich for support and technical assistance.
Contract grant sponsor: Bundesministerium für Bildung und Forschung; Contract grant number: BMBF 01 GI 0102; Contract grant sponsor: Science Foundation Ireland (SFI) Investigator Neuroimaging Program Award; Contract grant number: 08/IN.1/B1846; Contract grant sponsor: Spanish Ministry of Science and Innovation; Contract grant number: SAF2008-03300; Contract grant sponsor: Regional Ministry of Innovation, Science and Enterprise, Junta de Andalucía; Contract grant number: CTS-4604 Contract grant sponsors: Interdisciplinary Faculty; Department “Ageing Science and Humanities” (University of Rostock, Germany); Hirnliga e. V. (Nürmbrecht, Germany); Contract grant sponsor: Janssen-CILAG (Neuss, Germany)
Abbreviations
- AD
Alzheimer’s disease
- BF
basal forebrain
- CERAD
Consortium to establish a registry for Alzheimer’s disease
- CSF
cerebrospinal fluid
- DTI
diffusion tensor imaging
- MCI
mild cognitive impairment
- MMSE
Mini Mental State Examination
- MNI
Montreal Neurological Institute stereotaxic coordinate space
- MPRAGE
magnetization prepared rapid gradient echo
- MRI
magnetic resonance imaging
- NbM
Nucleus basalis of Meynert
- ROI
region of interest
- SPM
statistical parametric mapping
Footnotes
Additional Supporting Information may be found in the online version of this article.
References
- Andersson JLR, Jenkinson M, Smith S. Non-linear optimisation. FMRIB technical report TR07JA1. 2007a www.fmrib.ox.ac.uk/analysis/techrep.
- Andersson JLR, Jenkinson M, Smith S. Non-linear registration, aka Spatial normalisation. FMRIB technical report TR07JA2. 2007b www.fmrib.ox.ac.uk/analysis/techrep.
- Ashburner J, Friston K. Multimodal image coregistration and partitioning—A unified framework. Neuroimage. 1997;6:209–217. doi: 10.1006/nimg.1997.0290. [DOI] [PubMed] [Google Scholar]
- Ashburner J, Friston KJ. Voxel-based morphometry-the methods. Neuroimage. 2000;11(6 Pt 1):805–821. doi: 10.1006/nimg.2000.0582. [DOI] [PubMed] [Google Scholar]
- Ashburner J, Neelin P, Collins DL, Evans A, Friston K. Incorporating prior knowledge into image registration. Neuroimage. 1997;6:344–352. doi: 10.1006/nimg.1997.0299. [DOI] [PubMed] [Google Scholar]
- Ashburner J, Andersson JL, Friston KJ. High-dimensional image registration using symmetric priors. Neuroimage. 1999;9(6 Pt 1):619–628. doi: 10.1006/nimg.1999.0437. [DOI] [PubMed] [Google Scholar]
- Assaf Y, Pasternak O. Diffusion tensor imaging (DTI)-based white matter mapping in brain research: A review. J Mol Neurosci. 2008;34:51–61. doi: 10.1007/s12031-007-0029-0. [DOI] [PubMed] [Google Scholar]
- Behl P, Bocti C, Swartz RH, Gao F, Sahlas DJ, Lanctot KL, Streiner DL, Black SE. Strategic subcortical hyperintensities in cholinergic pathways and executive function decline in treated Alzheimer patients. Arch Neurol. 2007;64:266–272. doi: 10.1001/archneur.64.2.266. [DOI] [PubMed] [Google Scholar]
- Berres M, Monsch AU, Bernasconi F, Thalmann B, Stahelin HB. Normal ranges of neuropsychological tests for the diagnosis of Alzheimer’s disease. Stud Health Technol Inform. 2000;77:195–199. [PubMed] [Google Scholar]
- Bocti C, Swartz RH, Gao FQ, Sahlas DJ, Behl P, Black SE. A new visual rating scale to assess strategic white matter hyperintensities within cholinergic pathways in dementia. Stroke. 2005;36:2126–2131. doi: 10.1161/01.STR.0000183615.07936.b6. [DOI] [PubMed] [Google Scholar]
- Bowen DM, Allen SJ, Benton JS, Goodhardt MJ, Haan EA, Palmer AM, Sims NR, Smith CC, Spillane JA, Esiri MM, Neary D, Snowdon JS, Wilcock GK, Davison AN. Biochemical assessment of serotonergic and cholinergic dysfunction and cerebral atrophy in Alzheimer’s disease. J Neurochem. 1983;41:266–272. doi: 10.1111/j.1471-4159.1983.tb11838.x. [DOI] [PubMed] [Google Scholar]
- Braak H, Griffing K, Braak E. Neuroanatomy of Alzheimer’s disease. Alzheimer’s Res. 1997;3:235–247. [Google Scholar]
- Brett M, Johnsrude IS, Owen AM. The problem of functional localization in the human brain. Nat Rev Neurosci. 2002;3:243–249. doi: 10.1038/nrn756. [DOI] [PubMed] [Google Scholar]
- Bull G, Hebb C, Ratkovic D. Choline acetyltransferase activity of human brain tissue during development and at maturity. J Neurochem. 1970;17:1505–1516. doi: 10.1111/j.1471-4159.1970.tb00518.x. [DOI] [PubMed] [Google Scholar]
- Chen P, Ratcliff G, Belle SH, Cauley JA, DeKosky ST, Ganguli M. Cognitive tests that best discriminate between presymptomatic AD and those who remain nondemented. Neurology. 2000;55:1847–1853. doi: 10.1212/wnl.55.12.1847. [DOI] [PubMed] [Google Scholar]
- Chui HC, Bondareff W, Zarow C, Slager U. Stability of neuronal number in the human nucleus basalis of Meynert with age. Neurobiol Aging. 1984;5:83–88. doi: 10.1016/0197-4580(84)90035-6. [DOI] [PubMed] [Google Scholar]
- Cohen J. Statistical Power Analysis for the Behavioral Sciences. Hillsdale, NY: Erlbaum; 1988. [Google Scholar]
- Cullen KM, Halliday GM. Neurofibrillary degeneration and cell loss in the nucleus basalis in comparison to cortical Alzheimer pathology. Neurobiol Aging. 1998;19:297–306. doi: 10.1016/s0197-4580(98)00066-9. [DOI] [PubMed] [Google Scholar]
- Damoiseaux JS, Smith SM, Witter MP, Sanz-Arigita EJ, Barkhof F, Scheltens P, Stam CJ, Zarei M, Rombouts SA. White matter tract integrity in aging and Alzheimer’s disease. Hum Brain Mapp. 2009;30:1051–1059. doi: 10.1002/hbm.20563. [DOI] [PMC free article] [PubMed] [Google Scholar]
- DeKosky ST, Harbaugh RE, Schmitt FA, Bakay RA, Chui HC, Knopman DS, Reeder TM, Shetter AG, Senter HJ, Markesbery WR. Cortical biopsy in Alzheimer’s disease: Diagnostic accuracy and neurochemical, neuropathological, and cognitive correlations. Intraventricular Bethanecol Study Group. Ann Neurol. 1992;32:625–632. doi: 10.1002/ana.410320505. [DOI] [PubMed] [Google Scholar]
- Eckenstein FP, Baughman RW, Quinn J. An anatomical study of cholinergic innervation in rat cerebral cortex. Neuroscience. 1988;25:457–474. doi: 10.1016/0306-4522(88)90251-5. [DOI] [PubMed] [Google Scholar]
- Fellgiebel A, Schermuly I, Gerhard A, Keller I, Albrecht J, Weibrich C, Muller MJ, Stoeter P. Functional relevant loss of long association fibre tracts integrity in early Alzheimer’s disease. Neuropsychologia. 2008;46:1698–1706. doi: 10.1016/j.neuropsychologia.2007.12.010. [DOI] [PubMed] [Google Scholar]
- Fillenbaum GG, Peterson B, Morris JC. Estimating the validity of the clinical Dementia Rating Scale: The CERAD experience. Consortium to Establish a Registry for Alzheimer’s Disease. Aging (Milano) 1996;8:379–385. doi: 10.1007/BF03339599. [DOI] [PubMed] [Google Scholar]
- Fischer P, Jungwirth S, Zehetmayer S, Weissgram S, Hoenigschnabl S, Gelpi E, Krampla W, Tragl KH. Conversion from subtypes of mild cognitive impairment to Alzheimer dementia. Neurology. 2007;68:288–291. doi: 10.1212/01.wnl.0000252358.03285.9d. [DOI] [PubMed] [Google Scholar]
- Folstein MF, Folstein SE, McHugh PR. Mini-mental-state: A practical method for grading the cognitive state of patients for the clinician. J Psychiatr Res. 1975;12:189–198. doi: 10.1016/0022-3956(75)90026-6. [DOI] [PubMed] [Google Scholar]
- Geula C, Nagykery N, Nicholas A, Wu CK. Cholinergic neuronal and axonal abnormalities are present early in aging and in Alzheimer disease. J Neuropathol Exp Neurol. 2008;67:309–318. doi: 10.1097/NEN.0b013e31816a1df3. [DOI] [PMC free article] [PubMed] [Google Scholar]
- Gil-Bea FJ, Garcia-Alloza M, Dominguez J, Marcos B, Ramirez MJ. Evaluation of cholinergic markers in Alzheimer’s disease and in a model of cholinergic deficit. Neurosci Lett. 2005;375:37–41. doi: 10.1016/j.neulet.2004.10.062. [DOI] [PubMed] [Google Scholar]
- Gilmor ML, Erickson JD, Varoqui H, Hersh LB, Bennett DA, Cochran EJ, Mufson EJ, Levey AI. Preservation of nucleus basalis neurons containing choline acetyltransferase and the vesicular acetylcholine transporter in the elderly with mild cognitive impairment and early Alzheimer’s disease. J Comp Neurol. 1999;411:693–704. [PubMed] [Google Scholar]
- Graham AJ, Ray MA, Perry EK, Jaros E, Perry RH, Volsen SG, Bose S, Evans N, Lindstrom J, Court JA. Differential nicotinic acetylcholine receptor subunit expression in the human hippocampus. J Chem Neuroanat. 2003;25:97–113. doi: 10.1016/s0891-0618(02)00100-x. [DOI] [PubMed] [Google Scholar]
- Grinberg LT, Heinsen H. Computer-assisted 3D reconstruction of the human basal forebrain complex. Dementia Neuropsychol. 2007;2:140–146. doi: 10.1590/s1980-57642008dn10200005. [DOI] [PMC free article] [PubMed] [Google Scholar]
- Griswold MA, Jakob PM, Heidemann RM, Nittka M, Jellus V, Wang J, Kiefer B, Haase A. Generalized autocalibrating partially parallel acquisitions (GRAPPA) Magn Reson Med. 2002;47:1202–1210. doi: 10.1002/mrm.10171. [DOI] [PubMed] [Google Scholar]
- Grothe M, Zaborszky L, Atienza M, Gil-Neciga E, Rodriguez-Romero R, Teipel SJ, Amunts K, Suarez-Gonzalez A, Cantero JL. Reduction of basal forebrain cholinergic system parallels cognitive impairment in patients at high risk of developing Alzheimer’s disease. Cereb Cortex. 2010;20:1685–1695. doi: 10.1093/cercor/bhp232. [DOI] [PMC free article] [PubMed] [Google Scholar]
- Hall AM, Moore RY, Lopez OL, Kuller L, Becker JT. Basal forebrain atrophy is a presymptomatic marker for Alzheimer’s disease. Alzheimers Dement. 2008;4:271–279. doi: 10.1016/j.jalz.2008.04.005. [DOI] [PMC free article] [PubMed] [Google Scholar]
- Halliday GM, Cullen K, Cairns MJ. Quantitation and three-dimensional reconstruction of Ch4 nucleus in the human basal forebrain. Synapse. 1993;15:1–16. doi: 10.1002/syn.890150102. [DOI] [PubMed] [Google Scholar]
- Hanyu H, Asano T, Sakurai H, Tanaka Y, Takasaki M, Abe K. MR analysis of the substantia innominata in normal aging, Alzheimer disease, and other types of dementia. Am J Neuroradiol. 2002;23:27–32. [PMC free article] [PubMed] [Google Scholar]
- Hanyu H, Shimizu S, Tanaka Y, Hirao K, Iwamoto T, Abe K. MR features of the substantia innominata and therapeutic implications in dementias. Neurobiol Aging. 2007;28:548–54. doi: 10.1016/j.neurobiolaging.2006.02.009. [DOI] [PubMed] [Google Scholar]
- Heinsen H, Henn R, Eisenmenger W, Gotz M, Bohl J, Bethke B, Lockemann U, Puschel K. Quantitative investigations on the human entorhinal area: Left-right asymmetry and age-related changes. Anat Embryol (Berl) 1994;190:181–194. doi: 10.1007/BF00193414. [DOI] [PubMed] [Google Scholar]
- Heinsen H, Hampel H, Teipel SJ. Computer-assisted 3D reconstruction of the Nucleus basalis complex, including the Nucleus subputaminalis. Brain. 2006;129(Part 4):E43. [Google Scholar]
- Lehericy S, Hirsch EC, Cervera-Pierot P, Hersh LB, Bakchine S, Piette F, Duyckaerts C, Hauw JJ, Javoy-Agid F, Agid Y. Heterogeneity and selectivity of the degeneration of cholinergic neurons in the basal forebrain of patients with Alzheimer’s disease. J Comp Neurol. 1993;330:15–31. doi: 10.1002/cne.903300103. [DOI] [PubMed] [Google Scholar]
- Lopez OL, Kuller LH, Becker JT, Dulberg C, Sweet RA, Gach HM, Dekosky ST. Incidence of dementia in mild cognitive impairment in the cardiovascular health study cognition study. Arch Neurol. 2007;64:416–420. doi: 10.1001/archneur.64.3.416. [DOI] [PubMed] [Google Scholar]
- Lowes-Hummel P, Gertz HJ, Ferszt R, Cervos-Navarro J. The basal nucleus of Meynert revised: the nerve cell number decreases with age. Arch Gerontol Geriatr. 1989;8:21–27. doi: 10.1016/0167-4943(89)90066-6. [DOI] [PubMed] [Google Scholar]
- Maioli F, Coveri M, Pagni P, Chiandetti C, Marchetti C, Ciarrocchi R, Ruggero C, Nativio V, Onesti A, D’Anastasio C, Pedone V. Conversion of mild cognitive impairment to dementia in elderly subjects: A preliminary study in a memory and cognitive disorder unit. Arch Gerontol Geriatr. 2007;44(Suppl 1):233–241. doi: 10.1016/j.archger.2007.01.032. [DOI] [PubMed] [Google Scholar]
- Mann DM, Yates PO, Marcyniuk B. Changes in nerve cells of the nucleus basalis of Meynert in Alzheimer’s disease and their relationship to ageing and to the accumulation of lipofuscin pigment. Mech Ageing Dev. 1984;25:189–204. doi: 10.1016/0047-6374(84)90140-4. [DOI] [PubMed] [Google Scholar]
- McGeer PL, McGeer EG, Suzuki J, Dolman CE, Nagai T. Aging, Alzheimer’s disease, and the cholinergic system of the basal forebrain. Neurology. 1984;34:741–745. doi: 10.1212/wnl.34.6.741. [DOI] [PubMed] [Google Scholar]
- McKhann G, Drachman D, Folstein M, Katzman R, Price D, Stadlan EM. Clinical diagnosis of Alzheimer’s disease: report of the NINCDS-ADRDA Work Group under the auspices of the Department of Health and Human Services Task Force on Alzheimer’s disease. Neurology. 1984;34:939–944. doi: 10.1212/wnl.34.7.939. [DOI] [PubMed] [Google Scholar]
- Mesulam MM. The systems-level organization of cholinergic innervation in the human cerebral cortex and its alterations in Alzheimer’s disease. Prog Brain Res. 1996;109:285–297. doi: 10.1016/s0079-6123(08)62112-3. [DOI] [PubMed] [Google Scholar]
- Mesulam MM, Geula C. Nucleus basalis (Ch4) and cortical cholinergic innervation in the human brain: Observations based on the distribution of acetylcholinesterase and choline acetyltransferase. J Comp Neurol. 1988;275:216–240. doi: 10.1002/cne.902750205. [DOI] [PubMed] [Google Scholar]
- Mesulam MM, Mufson EJ, Wainer BH, Levey AI. Central cholinergic pathways in the rat: an overview based on an alternative nomenclature (Ch1–Ch6) Neuroscience. 1983;10:1185–1201. doi: 10.1016/0306-4522(83)90108-2. [DOI] [PubMed] [Google Scholar]
- Mori S, Zhang J. Principles of diffusion tensor imaging and its applications to basic neuroscience research. Neuron. 2006;51:527–539. doi: 10.1016/j.neuron.2006.08.012. [DOI] [PubMed] [Google Scholar]
- Morris JC. The Clinical Dementia Rating (CDR): current version and scoring rules. Neurology. 1993;43:2412–2414. doi: 10.1212/wnl.43.11.2412-a. [DOI] [PubMed] [Google Scholar]
- Muth K, Schonmeyer R, Matura S, Haenschel C, Schroder J, Pantel J. Mild cognitive impairment in the elderly is associated with volume loss of the cholinergic basal forebrain region. Biol Psychiatry. 2010;67:588–591. doi: 10.1016/j.biopsych.2009.02.026. [DOI] [PubMed] [Google Scholar]
- Pearson RC, Sofroniew MV, Cuello AC, Powell TP, Eckenstein F, Esiri MM, Wilcock GK. Persistence of cholinergic neurons in the basal nucleus in a brain with senile dementia of the Alzheimer’s type demonstrated by immunohistochemical staining for choline acetyltransferase. Brain Res. 1983;289:375–379. doi: 10.1016/0006-8993(83)90046-x. [DOI] [PubMed] [Google Scholar]
- Pearson RC, Sofroniew MV, Powell TP. Hypertrophy of cholinergic neurones of the rat basal nucleus following section of the corpus callosum. Brain Res. 1985;338:337–340. doi: 10.1016/0006-8993(85)90164-7. [DOI] [PubMed] [Google Scholar]
- Pearson RC, Sofroniew MV, Powell TP. The cholinergic nuclei of the basal forebrain of the rat: Hypertrophy following contralateral cortical damage or section of the corpus callosum. Brain Res. 1987;411:332–340. doi: 10.1016/0006-8993(87)91085-7. [DOI] [PubMed] [Google Scholar]
- Petersen RC. Mild cognitive impairment as a diagnostic entity. J Intern Med. 2004;256:183–194. doi: 10.1111/j.1365-2796.2004.01388.x. [DOI] [PubMed] [Google Scholar]
- Rose SE, Chen F, Chalk JB, Zelaya FO, Strugnell WE, Benson M, Semple J, Doddrell DM. Loss of connectivity in Alzheimer’s disease: An evaluation of white matter tract integrity with colour coded MR diffusion tensor imaging. J Neurol Neurosurg Psychiatry. 2000;69:528–530. doi: 10.1136/jnnp.69.4.528. [DOI] [PMC free article] [PubMed] [Google Scholar]
- Ruberg M, Mayo W, Brice A, Duyckaerts C, Hauw JJ, Simon H, LeMoal M, Agid Y. Choline acetyltransferase activity and [3H]vesamicol binding in the temporal cortex of patients with Alzheimer’s disease, Parkinson’s disease, and rats with basal forebrain lesions. Neuroscience. 1990;35:327–333. doi: 10.1016/0306-4522(90)90086-j. [DOI] [PubMed] [Google Scholar]
- Rueckert D, Sonoda LI, Hayes C, Hill DLG, Leach MO, Hawkes DJ. Non-rigid registration using free-form deformations: Application to breast MR images. IEEE Trans Med Imaging. 1999;18:712–721. doi: 10.1109/42.796284. [DOI] [PubMed] [Google Scholar]
- Sassin I, Schultz C, Thal DR, Rub U, Arai K, Braak E, Braak H. Evolution of Alzheimer’s disease-related cytoskeletal changes in the basal nucleus of Meynert. Acta Neuropathol (Berl) 2000;100:259–269. doi: 10.1007/s004019900178. [DOI] [PubMed] [Google Scholar]
- Scahill RI, Schott JM, Stevens JM, Rossor MN, Fox NC. Mapping the evolution of regional atrophy in Alzheimer’s disease: Unbiased analysis of fluid-registered serial MRI. Proc Natl Acad Sci USA. 2002;99:4703–4707. doi: 10.1073/pnas.052587399. [DOI] [PMC free article] [PubMed] [Google Scholar]
- Scheltens P, Barkhof F, Leys D, Pruvo JP, Nauta JJP, Vermersch P, Steinling M, Valk J. A semiquantitative rating scale for the assessment of signal hyperintensities on magnetic resonance imaging. J Neurol Sci. 1993;114:7–12. doi: 10.1016/0022-510x(93)90041-v. [DOI] [PubMed] [Google Scholar]
- Schroeter ML, Stein T, Maslowski N, Neumann J. Neural correlates of Alzheimer’s disease and mild cognitive impairment: A systematic and quantitative meta-analysis involving 1351 patients. Neuroimage. 2009;47:1196–1206. doi: 10.1016/j.neuroimage.2009.05.037. [DOI] [PMC free article] [PubMed] [Google Scholar]
- Selden NR, Gitelman DR, Salamon-Murayama N, Parrish TB, Mesulam MM. Trajectories of cholinergic pathways within the cerebral hemispheres of the human brain. Brain. 1998;121(Part 12):2249–2257. doi: 10.1093/brain/121.12.2249. [DOI] [PubMed] [Google Scholar]
- Shulman KI, Shedletsky R, Silver IL. The challenge of time: Clock drawing and cognitive function in the elderly. Int J Geriatr Psychiatry. 1986;1:135–140. [Google Scholar]
- Simic G, Mrzljak L, Fucic A, Windblad A, Lovric H, Kostovic I. Nucleus subputaminalis (Ayla): The still disregarded magnocellular component of the basal forebrain may be human specific and connected with the cortical speech area. Neuroscience. 1999;89:73–89. doi: 10.1016/s0306-4522(98)00304-2. [DOI] [PubMed] [Google Scholar]
- Smith S. Fast robust automated brain extraction. Hum Brain Map. 2002;17:143–155. doi: 10.1002/hbm.10062. [DOI] [PMC free article] [PubMed] [Google Scholar]
- Smith SM, Jenkinson M, Johansen-Berg H, Rueckert D, Nichols TE, Mackay CE, Watkins KE, Ciccarelli O, Cader MZ, Matthews PM, Behrens TEJ. Tract-based spatial statistics: Voxelwise analysis of multi-subject diffusion data. Neuroimage. 2006;31:1487–1505. doi: 10.1016/j.neuroimage.2006.02.024. [DOI] [PubMed] [Google Scholar]
- Stricker NH, Schweinsburg BC, Delano-Wood L, Wierenga CE, Bangen KJ, Haaland KY, Frank LR, Salmon DP, Bondi MW. Decreased white matter integrity in late-myelinating fiber pathways in Alzheimer’s disease supports retrogenesis. Neuroimage. 2009;45:10–16. doi: 10.1016/j.neuroimage.2008.11.027. [DOI] [PMC free article] [PubMed] [Google Scholar]
- Talairach J, Tournoux P. Co-Planar Stereotaxic Atlas of the Human Brain. New York: Thieme; 1988. [Google Scholar]
- Teipel SJ, Flatz WH, Heinsen H, Bokde AL, Schoenberg SO, Stockel S, Dietrich O, Reiser MF, Moller HJ, Hampel H. Measurement of basal forebrain atrophy in Alzheimer’s disease using MRI. Brain. 2005;128(Part 11):2626–2644. doi: 10.1093/brain/awh589. [DOI] [PubMed] [Google Scholar]
- Teipel SJ, Born C, Ewers M, Bokde AL, Reiser MF, Moller HJ, Hampel H. Multivariate deformation-based analysis of brain atrophy to predict Alzheimer’s disease in mild cognitive impairment. Neuroimage. 2007a;38:13–24. doi: 10.1016/j.neuroimage.2007.07.008. [DOI] [PubMed] [Google Scholar]
- Teipel SJ, Stahl R, Dietrich O, Schoenberg SO, Perneczky R, Bokde AL, Reiser MF, Moller HJ, Hampel H. Multivariate network analysis of fiber tract integrity in Alzheimer’s disease. Neuroimage. 2007b;34:985–995. doi: 10.1016/j.neuroimage.2006.07.047. [DOI] [PubMed] [Google Scholar]
- Teipel SJ, Meindl T, Grinberg L, Heinsen H, Hampel H. Novel MRI techniques in the assessment of dementia. Eur J Nucl Med Mol Imaging. 2008;35(Suppl 1):S58–S69. doi: 10.1007/s00259-007-0703-z. [DOI] [PubMed] [Google Scholar]
- Vogels OJ, Broere CA, ter Laak HJ, ten Donkelaar HJ, Nieuwenhuys R, Schulte BP. Cell loss and shrinkage in the nucleus basalis Meynert complex in Alzheimer’s disease. Neurobiol Aging. 1990;11:3–13. doi: 10.1016/0197-4580(90)90056-6. [DOI] [PubMed] [Google Scholar]
- Whitehouse PJ, Price DL, Clark AW, Coyle JT, Delong MK. Alzheimer disease: Evidence for selective loss of cholinergic neurons in the nucleus basalis. Ann Neurol. 1981;10:122–126. doi: 10.1002/ana.410100203. [DOI] [PubMed] [Google Scholar]
- Whitwell JL, Weigand SD, Shiung MM, Boeve BF, Ferman TJ, Smith GE, Knopman DS, Petersen RC, Benarroch EE, Josephs KA, Jack CR., Jr Focal atrophy in dementia with Lewy bodies on MRI: A distinct pattern from Alzheimer’s disease. Brain. 2007;130(Part 3):708–719. doi: 10.1093/brain/awl388. [DOI] [PMC free article] [PubMed] [Google Scholar]
- Zaborszky L, Hoemke L, Mohlberg H, Schleicher A, Amunts K, Zilles K. Stereotaxic probabilistic maps of the magnocellular cell groups in human basal forebrain. Neuroimage. 2008;42:1127–1141. doi: 10.1016/j.neuroimage.2008.05.055. [DOI] [PMC free article] [PubMed] [Google Scholar]
Associated Data
This section collects any data citations, data availability statements, or supplementary materials included in this article.