Abstract
The effects of acoustic heterogeneities on transcranial brain imaging with microwave-induced thermoacoustic tomography were studied. A numerical model for calculating the propagation of thermoacoustic waves through the skull was developed and experimentally examined. The model takes into account wave reflection and refraction at the skull surfaces and therefore provides improved accuracy for the reconstruction. To evaluate when the skull-induced effects could be ignored in reconstruction, we further compared the reconstructed images obtained by the proposed method with those obtained with the method based on homogenous acoustic properties. From our simulation and experimental results, it was found that when the target region is close to the center of the brain, the effects caused by the skull layer are minimal and both reconstruction methods work well. As the target region becomes closer to the interface between the skull and brain tissue, however, the skull-induced distortion becomes increasingly severe, and the reconstructed image would be strongly distorted without correcting those effects. In this case, the proposed numerical method can improve image quality by taking into consideration the wave refraction and mode conversion at the skull surfaces. This work is important for obtaining good brain images when the thickness of the skull cannot be ignored.
Keywords: Thermoacoustic tomography, transcranial brain imaging, acoustic heterogeneities
1 Introduction
Microwave-induced thermoacoustic tomography (TAT) is a noninvasive and nonionizing imaging modality that can differentiate different biological tissues based on their dielectric properties. In TAT, the tissue absorbs pulsed electromagnetic energy and subsequently emits acoustic waves through thermoelastic expansion. The generated thermoacoustic waves are then collected by ultrasonic transducers to reconstruct microwave specific absorption within the tissue.1,2 Because malignant tissue and normal tissue differ substantially in their water content, their dielectric properties vary greatly. TAT, therefore, has the potential for application in tumor detection. Because of the large penetration depth of microwave energy in biological tissue, one of the potential applications of TAT is transcranial brain imaging. Current transcranial brain imaging modalities include ultrasound imaging, X-ray computerized tomography (CT), and magnetic resonance imaging (MRI). Ultrasound imaging has been established as a routine technique to image intracranial abnormalities in newborns when the fontanelles are open. The quality of intracranial brain images, however, becomes worse after closure of the fontanelles. Ultrasound imaging is also limited by its ability to differentiate different tissues in the brain, and only a few structures can be identified.3,4 Besides that, ultrasound imaging in reflection mode experiences two-way transmission, whereas TAT has only one-way transmission. Therefore, TAT suffers less attenuation and image distortion than ultrasound imaging. Moreover, a 3 GHz TAT system can be easily made portable because of its small size. Both CT and MRI have been shown to be capable of obtaining good brain images. X-ray CT, however, uses ionizing radiation; it is unsafe for patients who need long time monitoring of brain diseases. The cost and availability of MRI limits its application. Thus it is desirable to develop an inexpensive, portable, non-ionizing, and high-resolution imaging modality, such as TAT, that can be used at the bedside and in the operating room to monitor brain disorders.
Experimental evidence in a previous study has shown that some thermoacoustic energy can propagate through the skull and generate useful information about brain structures.5 Nevertheless, those experimental studies were designed to simulate imaging of infants at the age following closure of the fontanelles. Monkey heads with a skull thickness of approximately 1 mm were used to simulate the human infant's head. The distortion caused by the skull bone was ignored assuming that the thin skull layer has only negligible influence on the reconstructed image. No information, however, has been provided on how the skull bone affects the image quality of TAT. In addition, studies on the properties of the human brain have shown that as a child grows, the differences in dielectric properties of the brain become greater;6 hence, we expect better image contrasts in young adults. The skull bone, however, thickens considerably from the birth of a child to adulthood, and consequently it causes stronger attenuation and phase distortion as a child grows.7 Skull-caused distortion remains an obstacle to further improving image quality in transcranial brain imaging with TAT.
Acoustic speed variations alone can cause displacements of the thermoacoustic signals both axially and tangentially. In a previous study, we corrected the effect of first-order acoustic speed variations on TAT with the acoustic speed distribution measured by ultrasound transmission tomography.8 We compensated only for the displacements of thermoacoustic signals along the assumed linear radiating propagation paths. For tissue that is more highly refractive than soft tissue, such as skull bone, we need to consider the second-order acoustic speed variations that are due to ultrasonic refraction from the assumed straight paths. If we ignore ultrasonic refraction in the reconstruction algorithm, the recorded acoustic signals from a given viewing angle would be back-projected to a wrong location in the imaging region, causing both blurring and dislocation and reducing image contrast. Our experimental data also show that the majority of the frequency components in thermoacoustic signals are below 1 MHz, and in this frequency range the distortion and attenuation by the human skull are shown to be minimal when the incident directions are nearly normal to the skull surface.9 When the incident directions are oblique, however, refraction effects become substantial, and shear waves also arise from mode conversions. It is, therefore, necessary to consider the distortions caused by the skull to obtain good transcranial brain images with TAT.
In this study, we first examined the effects of the skull on transcranial TAT images. Then we proposed a numerical model that considers wave reflection and refraction in calculating the propagation of thermoacoustic waves. In deriving the model, we introduced some reasonable approximations. This model was used with both simulated and experimental data to evaluate the feasibility of transcranial TAT through a skull. To evaluate the skull-induced effects on the image reconstruction, the results obtained with the proposed model were compared with the results without considering the skull-induced distortion. We demonstrated that the image quality could be improved by incorporating the skull shape and acoustic properties into image reconstruction.
2 Theory
2.1 Forward propagation in a heterogeneous medium
Reconstruction algorithms for TAT have been extensively studied for a homogeneous medium, in which a constant acoustic speed is assumed. In biological tissue, the acoustic speed can be spatially variant. In this case, a mathematical model to describe the wave propagation can be written as:10,11
| (1) |
where α(r) is the ultrasonic absorption distribution, ρ(r) is the density distribution, β is the thermal expansion coefficient, Cp is the specific heat, p(r,t) is the measured pressure at position r and time t, c(r) is the acoustic speed distribution, and H(r,t) is the microwave heating function. In the thermal confinement regime, the heating function can be written as a product of a spatial energy deposition function φ(r) and a microwave pulse function I(t) : i.e., H(r,t) = φ(r)· I(t). A microwave pulse of sufficiently short duration in comparison to the acoustic transit time through the characteristic length can be approximated by a delta function δ(t). In the following analysis, we assume that I(t) equals δ(t). The source φ(r) excites the initial wave-field p0(r), which then propagates through the medium with acoustic speed c(r).
In Eq. (1), the speed of sound, density, and ultrasonic absorption are functions of r. The forward problem is nonlinear because the phase distortion depends nonlinearly on the speed variation. In a highly refractive medium, such as the skull bone in soft tissue, where the variation of the speed of sound is more than 50%, existing reconstruction algorithms8,12,13 are incapable of obtaining good image quality without considering wave refraction and other skull-induced distortion. Owing to high acoustic speed and the irregular shape and non-uniform thickness of the skull, it is also practically impossible to obtain an exact closed-form reconstruction formula from Eq. (1). Therefore, we develop a numerical model to simulate the forward problem and to solve the inverse problem. We will discuss the numerical model in section 2.3.
2.2 Effects of skull bone on TAT image
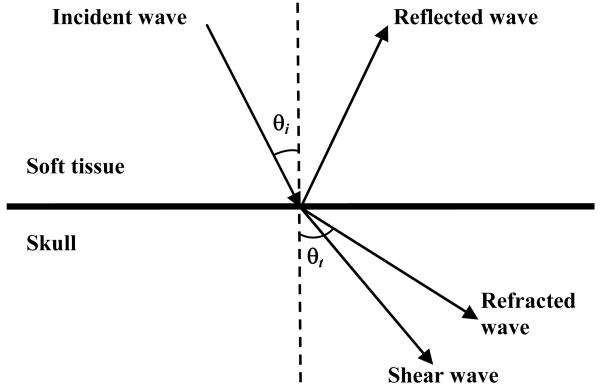
Thermoacoustic waves propagate in brain tissue mainly as longitudinal waves, but on the inner-skull surface they experience mode conversion, reflection and refraction, as shown in Fig. (1), and, thus, we expect both phase and amplitude distortion.
Figure 1.
Schematic illustration of the reflection, refraction, and mode conversion of longitudinal incident waves.
Shear waves can be produced when ultrasound waves travel from soft tissue to bone. They are generally neglected in imaging of soft tissues because they need solid material to be effectively propagated. Shear waves are generated through mode conversion in the skull using some of the energy from the incident longitudinal waves. When ultrasound waves are normally incident on the skull (incident angle θi = 0°), no shear waves are produced, so only longitudinal waves are considered in imaging. In transcranial brain imaging with TAT, oblique incidence is inevitable. As the incident angle increases, conversion to shear waves gradually increases. The previous studies9,14 show that the conversion to shear waves in the skull layer is negligible when the incident angle is less than 20°. As the incident angle becomes greater than 20°, shear waves gradually dominate the transmitted ultrasound waves. When the incident angle becomes greater than the critical angle, only shear waves can propagate into the skull.
Shear wave imaging has some drawbacks. It has been shown that although a shear wave has lower acoustic speed than a longitudinal wave, and thus a better impedance match with the surrounding medium, the attenuation coefficient for the shear wave is much higher than that for the longitudinal wave in the skull.14 Due to the lower acoustic speed in the skull, the wavelength of the shear wave is shorter than that of the longitudinal wave at the same frequency. The resolution of the shear wave, however, may turn out to be worse than that of the longitudinal wave, because the attenuation coefficient increases as the frequency increases. After the ultrasonic pulses pass through the skull, the central frequency of the shear wave is lower than that of the longitudinal wave. For the same reason, the signal-to-noise ratio of longitudinal wave images is better than that of the shear-wave counterparts. In this study we neglect shear waves and, thus, model only longitudinal waves.
Phase distortion is primarily induced by the high acoustic speed in the skull. As the control factor for reconstructing an undistorted TAT image, the phases of the received signals need to be corrected so that, when propagated back to the source, the signals can be added in phase. In normal incidence, the skull thickness of an infant is about 1 mm, and the phase shift caused by the skull is linear over a large range of frequencies. As a child grows, the skull becomes thicker, and the phase shift at higher frequency begins to depart from linearity. Nevertheless, in the frequency range from 0.3 MHz to 1.0 MHz, where the main components of the TAT signals reside, the phase shift caused by the skull remains linear with the frequency.9 Therefore, the phase correction for normal incidence can be easily implemented by adding a constant time shift term when we reconstruct the image in the time domain. If the time shift is much less than 0.5 μs (the pulse-width of the microwave source used in our current TAT system), we can neglect the shift. Oftentimes the thermoacoustic waves are obliquely incident on the inner-skull, and we have to perform phase compensation on each single source to obtain a focused image at the target region inside the brain.
As it travels through the skull, the thermoacoustic wave is attenuated in amplitude by absorption, scattering, and reflection, the absorption and scattering are mainly brought about by the diploe layer in the skull. The diploe layer is cancellous bone with a blood and fat-filled porous structure, and the insertion loss increases with frequency. Infant skull bones are thin, with little or no diploe layers, and the attenuations are low over a large frequency range.9 The absence of a diploe layer also eliminates the dependence of insertion loss with the frequency. We can, therefore, neglect the amplitude attenuation caused by absorption and scattering in the infant skull. For small children, ultrasonic waves passing through the skull reach the receiver with nearly linear attenuations for frequencies less than 1.0 MHz. The attenuation induced by absorption and scattering, however, is smaller than reflection loss,9 and, thus, in this study we simplify Eq. (1) by neglecting the effects of the absorption loss on ultrasonic waves,
| (2) |
Wave reflection and refraction are also important sources of the amplitude distortion. To simplify our analysis, the skull has been treated as a homogenous material, and the thickness of the skull bone is assumed to vary slowly on the scale of the wavelengths used for imaging. Under these assumptions, the skull is modeled as having a local constant thickness, and the pressure transmission coefficient at each interface is expressed as 10
| (3) |
where ρ1 and c1 are the density and acoustic speed of the incident medium, respectively; ρ2 and c2 are the density and acoustic speed of the transmission medium, respectively; and θi and θt are the incident and refracted angles, respectively. The refracted angle can be eliminated by using Snell's law. The expression for the transmittance is more complicated when mode conversion—which involves both longitudinal and shear impedances— is considered. Therefore, Eq. (3) is only an approximation for the forward transmission through the skull. Because we are only interested in longitudinal waves in reconstruction, we will use this approximated form in our numerical model. Multi-path interferences induced by wave reflection at the interfaces can also induce amplitude distortion, and their effects can be corrected by considering wave reflection and refraction in reconstruction.
2.3 Numerical model for acoustically heterogeneous problem
In this section, we describe a method to calculate the forward propagation of thermoacoustic waves through the skull and then propose an image reconstruction method. The simulation is based on a three-layer linear transmission model, which takes into account acoustic wave refraction and reflection at the tissue interfaces. The whole imaging area is divided into three acoustically homogeneous layers: the brain, the skull, and the skin (along with the coupling medium). Here, we assume that the brain, skin, and coupling medium are acoustically identical. Under the assumption that the skull is homogeneous with constant acoustic speed and density, the skull thickness and shape are the main parameters affecting the amplitude attenuation and phase distortion.
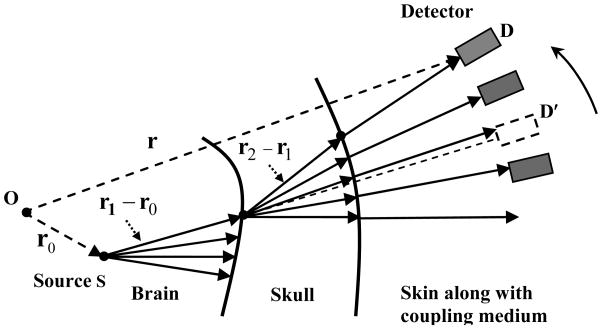
Consider a simple source S at an arbitrary location r0 within the brain, as shown in Fig. 2. Here we assume that source S is at least several wavelengths away from the skull surface. The coordinate origin O is chosen at a selected center—referred to as the image center in this paper—inside the skull. If the source S emits ultrasonic waves isotropically in all directions, the spectrum of the pressure at an arbitrary point r′ within the brain tissue can be written as 12,15,16
Figure 2.
Schematic illustration of forward TAT propagation.
| (4) |
where p0 (r0) = φ(r0)Γ(r0), , and wave number k1 = ω/c1 = 2π/λ (ω is the angular frequency and λ is the wavelength in the brain tissue). We use the Fourier transformation pair and , where t̄ = ct. Because the wavelength in the skull can be comparable to or even larger than the thickness of the skull, diffraction dominates the wave propagation on the inner-skull surface. The condition under which ray theory works is violated,10 and, therefore, we treat the inner-skull surface area as a secondary source. Let's consider a small surface area ds2 on the inner-skull surface. One side of the surface has brain tissue with density ρ1 and sound speed c1, and the other side has skull tissue with density ρ2 and sound speed c2. Here, ds2 can be regarded as a baffled simple source. The spectrum of the pressure at r′ within the brain tissue is related to the velocity potential Φ(r′,k1) by 10
| (5) |
The radial particle velocity with respect to source S in the brain before reaching the skull is
| (6) |
The particle velocity transmission coefficient T12 is written as (ρ1c1/ρ2c2)·T (T is defined in Eq. (3)). The particle velocity in the skull is equal to the product of u1 and T12, and thus the particle velocity u2 that is normal to the interface in the skull becomes u1T12 cos(θ1t), where the refracted angle θ1t in the skull layer is related to the incident angle on the inner-skull surface θ1i by Snell's law. By combining Eqs. (5) and (6), the spectrum of the pressure p(r1) on the inner-skull surface due to the simple source S can be approximated by 15,16
| (7) |
If we divide the imaging region into M small point sources, then the spectrum of the total pressure at r1 on the inner-skull surface can be written as
| (8) |
The subscript m is the index of the simple sources. Similarly, the spectrum of the pressure induced by the inner-skull surface area ds2 at an arbitrary point r″ inside the skull can be written as
| (9) |
where k2 is the wave number in the skull layer. After leaving the skull, the ultrasonic waves propagate into the skin and coupling medium and are received by the ultrasonic transducer in the far field. Because diffraction effects no longer dominate the wave propagation at this interface, under the assumption that energy is transmitted along a well-defined path, we can use rays rather than waves to investigate their effects. Thus, we use Snell's law and Eq. (3) to compute approximately the strength of the pressures obtained by the receiver. Let the inner-skull have N secondary sources and the outer-skull be discretized by L parts. Then the spectrum of the pressure on the transducer at location rd can be computed as
| (10) |
where the subscripts n,l represent the location at the inner-skull and outer-skull surfaces, respectively, T23nl means the transmission coefficient at the outer-skull interface, and k3 is the wave number in the coupling medium. Next, we transform Eq. (10) back into the time domain. By neglecting the imaginary part, we can get the following approximation in the time domain
| (11) |
where t̄1 = c1t1, t̄2 = c2t2 and t̄3 = c3t3. Here we assume the microwave source is a delta function. In a real application, we need to do a convolution of Eq. (11) with the profile of the microwave pulse. In this preliminary study, we neglect multiple reflections at the boundaries. The implementation of Eq. (11) will be discussed in section 3.3.
3 Materials and methods
3.1 Experimental setup
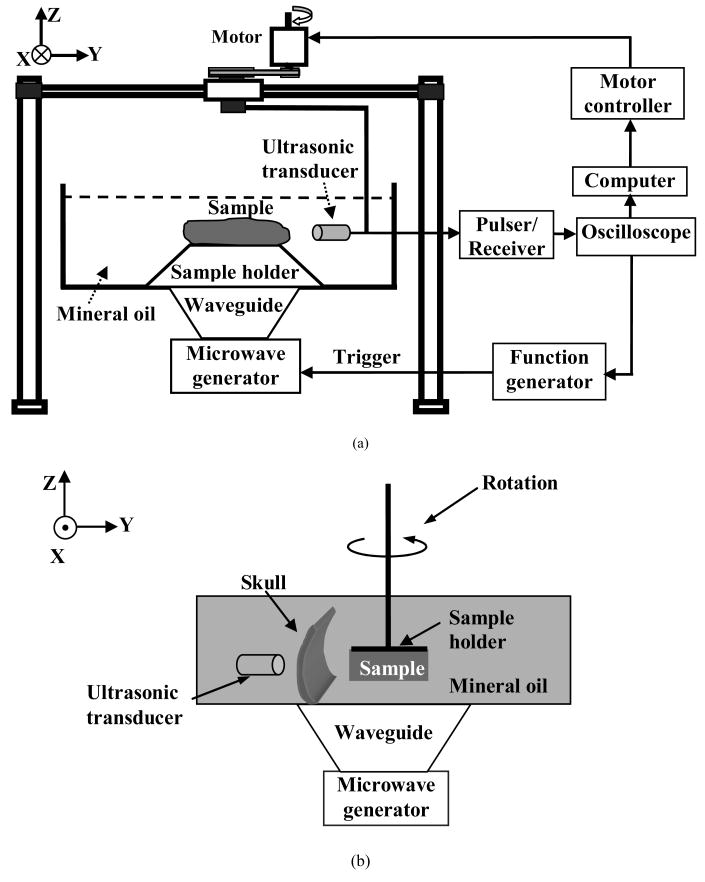
A schematic of the experimental setup for TAT is shown in Fig. 3(a). The experiment was conducted in a plastic container filled with mineral oil, which has a speed of sound of 1.437 mm/μs. The plastic container was large enough that the reflection of the thermoacoustic waves from the boundaries of the container would not interfere with reconstruction. The microwave energy was delivered into the biological tissue through the bottom of the container. The central frequency of the microwave source was 3 GHz, the pulse was 0.5 μs, and the peak power was estimated to be 2 kW. The frequency that contributes to the reconstruction was around 1 MHz. As for the receiver, we used an unfocused ultrasonic transducer (Panametrics-NDT, model C3015, Waltham MA) with a central frequency of 1 MHz and a bandwidth of 0.8 MHz. The amplitude of the received data was at μv level. The received signal was averaged 150 times to minimize the noise. We amplified the thermoacoustic signal by 40-60 dB with an ultrasound pulser-receiver (Panametrics-NDT, model 5072PR, Waltham MA) and then sampled the data with an oscilloscope (Tektronix, model TDS640, Beaverton, OR) at 20 MHz. The data were then transmitted to the computer and recorded for further processing. The microwave radiation level on human subject was estimated to be under the safety limit,5 and, thus, microwave-induced-biological effects were minimal. The microwave radiation time can be further reduced by using an ultrasonic array as the receiver in the future.
Figure 3.
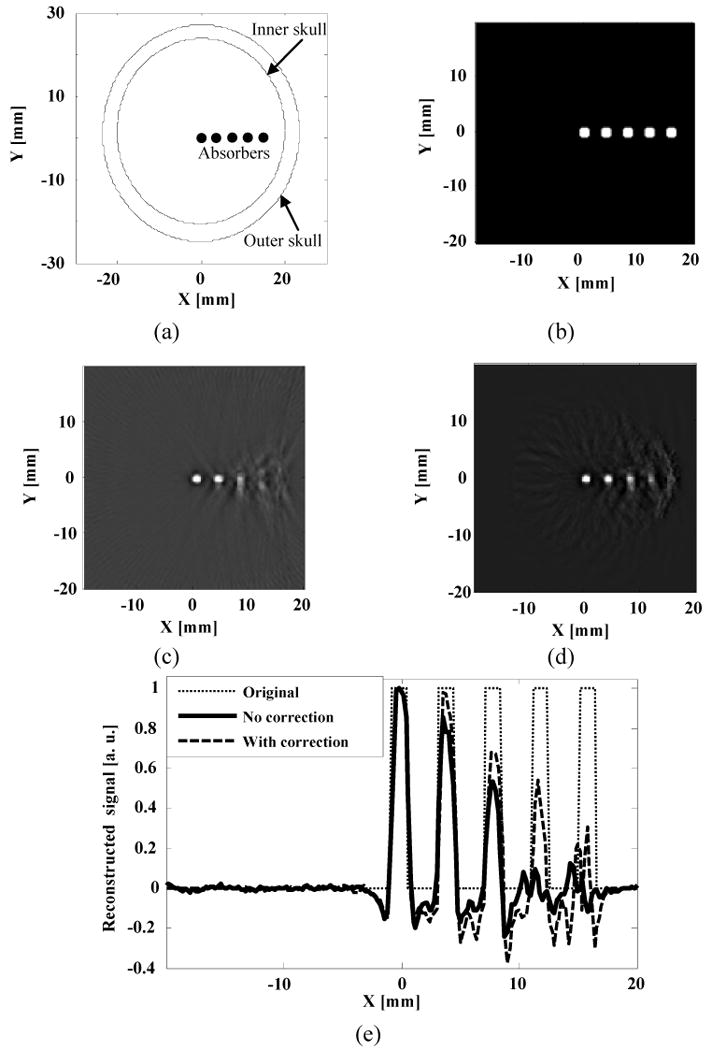
Numerical simulation: (a) Schematic illustration of the phantom sample used in the simulation; (b) Close-up view of the five absorbers, shown as white spots in the imaging area; (c) Reconstructed TAT image without correction for skull effects; (d) Reconstructed image after correction for skull effects; (e) Comparison of the reconstructed signals across the five absorbers.
3.2 Experimental procedure
To study the effects of acoustic heterogeneities on the TAT image, we first applied the proposed method to simulated data. Here we used the previously mentioned three-layer model. The acoustic speeds in the brain tissue, coupling medium, and skull were chosen to be 1.51 mm/μs, 1.43 mm/μs, and 2.37 mm/μs, respectively.9,18 The density of the brain tissue, skull, and coupling medium were chosen to be 1035, 1700, and 850 kg/m3, respectively.17,18 We simulated TAT results of a sample with five small strong absorbers placed in a straight line with an equal space of 4 mm and a diameter of 1.5 mm. The skull surfaces were in elliptic shapes. The outer-skull surface had a semimajor axis of 26 mm and a semiminor axis of 22 mm, and the inner-skull surface had a semimajor axis of 23.5 mm and a semiminor axis of 20 mm as shown in Fig. 4(a). A close-up view of the absorbers is shown in Fig. 4(b).
Figure 4.
(a) Schematic of the experimental setup and (b) Side view of experimental setup using a piece of monkey skull bone.
We then experimentally studied the effects of the skull attenuation on TAT. A side view of the experimental setup is shown in Fig. 3(b). A piece of formaldehyde-fixed parietal bone of a 10-year-old male M. nemestrina monkey was used to simulate the skull-bone of small children. Formaldehyde-fixed skull bone has been shown to be able to maintain the bone properties of a fresh skull,9 and, thus, we assume that the acoustic properties of the skull are similar to those of a fresh skull. The size of the skull segment was large enough to entirely cover the transducer element (6-mm diameter active element). The attenuation of the skull fragment was about 6 dB. It has been shown that the thickness of children's skulls ranges from 1 mm to 7 mm from birth to 16 years old.7 The thickness of the skull used in our experiment was measured to be around 6 mm, which was comparable to the thickness of a child's skull at the age of around 14. A phantom was made by embedding four small pieces of porcine muscle into a piece of porcine fat. Porcine muscle was used as absorbers because of its strong microwave absorption. The size of the porcine fat was approximately 42 mm × 30 mm, and the diameters of the four absorbers were ∼3.5 mm. The phantom sample was fixed on a sample holder and controlled by a stepping motor with a step size of 2.25°. The distance between the inner-skull surface and the image center was approximately 85 mm. The skull was positioned so that the incidence angles of the ultrasonic waves were approximately normal upon the inner-skull surface. The skull segment and phantom sample were immersed in mineral oil. The ultrasonic receiver and the skull remained fixed, and their distance was kept constant during the experiment. The position of the skull was obtained using ultrasonic pulse-echo method.
Finally, we experimentally examined the effects of wave refraction and mode conversion on TAT. The small size of the brain and the skull covering the brain of the monkey used in the previous experiment limited its use in investigating the human skull-induced distortions on TAT. Because we focused on studying the effects of refraction on the TAT image, in this preliminary study we used a PVC tube to mimic the reflection and refraction effects of the skull and to obtain its position by using ultrasonic pulse-echo imaging. We chose a PVC tube because of its high acoustic speed, which was close to the acoustic speed in the skull. The thickness of the PVC tube was approximately 3 mm, the acoustic speed was measured to be 2.39 mm/μs, and the density was estimated to be 1380 kg/m3. First, we made a tissue phantom by embedding two small circular cylindrical absorbers made of porcine muscle into porcine fat. The size of the porcine fat was 30 mm × 15 mm, the diameters of the absorbers were ∼3.5 mm, and the thickness of the tissue phantom was ∼1cm. The whole phantom was then immersed in mineral oil and placed on a sample holder on the X-Y plane. The densities of the fat and mineral oil were approximately 920 kg/ m3 and 850 kg/ m3, respectively.18 The experimental setup is shown in Fig. 3(a). The transducer was mounted on a mechanical arm controlled by a stepping motor, and then scanned around the tissue sample circularly to acquire two dimensional projection data. The position of PVC tube was obtained by ultrasonic pulse-echo imaging. Then, we did another phantom experiment by using porcine fat and a thin metal wire. The size of the porcine fat was 40 mm × 16 mm, the diameter of the metal wire was 0.1143 mm, the length of the metal wire was 40 mm, and the thickness of the tissue phantom was ∼13 mm. The PVC tube was the same as that used for the experiment with two small absorbers.
3.3 Implementation of the proposed method
For the forward transmission, we partitioned the imaging region into small cells (much less than the acoustic wavelengths used for imaging), and then calculated ultrasonic reflection and refraction based on the digitized model. We assumed that the skull surfaces were continuous and differentiable. To compute the refracted angle, we first calculated the normal direction at the intersecting point, and then applied Snell's law. A locally weighted smoothing method with least-squares quadratic polynomial fitting was used when necessary. Depending on the location of the simple source within the brain, the incident angles could be normal or oblique. In calculating the wave refraction on a cell, we took into account the total internal reflection by calculating the incident angle for each ray from any precedent simple source to the current cell and comparing the incident angle with the critical angle. The refracted ray after leaving the outer-skull surface traveled several centimeters before it reached the ultrasonic receiver, and then, it was additively received by the ultrasonic transducer. The computation complexity is determined by the number of simple sources in the imaging area and the secondary simple sources on the inner-skull surface. In our simulations and experiments, nonlinear effects (such as induction of harmonic frequency) and brain tissue absorption were ignored because their effects are minimal in the frequency range used in the experiments.
For the inverse problem, the thermoacoustic signal received by each ultrasonic receiver was back-projected along the refracted path to the imaging region. The path to calculate the phase delay was computed in the same way as in the forward problem, except with an inverted sequence. In order to compensate for the energy loss during transmission, the transmission coefficients are replaced by their inverse value at each interface during reconstruction.
4 Results
4.1 Simulations of transcranial brain imaging with TAT
Because the experimental setup was a two dimensional system, we showed simulations results in two dimensions to make the results comparable with experimental results. Reconstructed images for the simulated data were obtained with a filtered back-projection method (Fig. 4(c))13 and the proposed method (Fig. 4(d)). In Fig. 4(e), we compare the line plots across the five absorbers in the two reconstructed images. We find that when the absorber was close to the image center, we could obtain a good image by simply using the filtered back-projection method. But as the absorber came closer to the inner-skull surface, the filtered back-projection method yielded blurred images due to neglecting the refraction and mode conversion of the skull. By using the proposed numerical method, we obtained better images for the absorbers closer to the skull surfaces, but we can only partially reconstruct the strength of the absorber because shear waves were neglected. This becomes increasingly true when the absorber becomes closer and closer to the inner-skull surface. Nevertheless, compared with the filtered back-projection method, our proposed numerical method still shows much improvement of image quality.
4.2 Experimental results
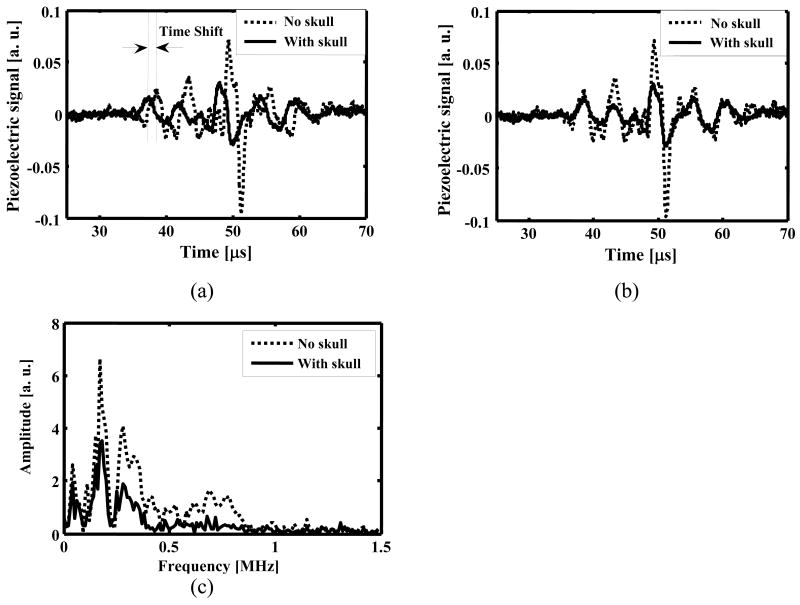
Figure 5(a) shows the time shift induced by acoustic speed variations after thermoacoustic waves passed through the monkey skull. The time shift is marked by two perpendicular dotted lines on the graph. If we assume a constant acoustic speed in the reconstruction, time shifts of this magnitude will have a substantial effect on the formation of a focused TAT image through the skull. After we compensated for the phase distortion, the thermoacoustic signals with and without the skull present were compared in Fig. 5(b). We further compared the spectra of the thermoacoustic signals with and without the skull present in Fig. 5(c). We found that the microwave-generated thermoacoustic signals were mostly below 1 MHz, with the majority of the frequency components less than 0.5 MHz. It was also observed that the attenuation induced by the skull was stronger in the frequency range of >0.5 MHz. Our results agree well with the results obtained by Fry et al.9 on a skull with the same thickness in the same frequency range.
Figure 5.
Thermoacoustic signals after traveling through a monkey skull bone with a thickness of 6 mm: (a) Time shift is marked by two dotted perpendicular lines. The solid line is the thermoacoustic signal with the skull bone present, and the dotted line is the thermoacoustic signal with the skull bone absent; (b) Amplitude attenuation after phase shift has been compensated for. The solid line is the thermoacoustic signal with the skull bone present, and the dotted line is the thermoacoustic signal with the skull bone absent; (c) Comparison of the amplitude spectra of the thermoacoustic signals with and without the skull present.
Because higher frequency components determine the boundary of the reconstructed image, the amplitude of the image boundaries will be dampened most by the skull, and consequently we expect blurred boundaries but still good contrast in the reconstructed image. Figure 6(a) is the reconstructed TAT image with the skull absent, and Fig. 6(b) is the reconstructed TAT image with the skull present, using the filtered back-projection method. To minimize the distortion induced by the higher frequency components, especially noise and other interferences, we filtered out frequency components that were greater than 2 MHz in the post-processing of the data. To get better contrast, we also filtered out DC and low frequency components that were less than 0.1 MHz. We further processed the data using the proposed numerical method based on estimated skull information from ultrasound measurement, and the reconstructed image is shown in Fig. 6(c). With the skull present, skull-induced attenuation was strong, and consequently the intensities of the reconstructed images in Figs. 6(b) and 6(c) were weaker than that in Fig. 6(a), and the boundaries also looked less sharp. In spite of that, both reconstruction methods showed good images when the skull was present. We further compared in Fig. 6(d) the line plots across the three reconstructed images at the depths marked by arrows in Figs. 6(a), 6(b) and 6(c). Although the measurement errors of the skull introduced some noise into the image obtained with the proposed numerical method, the line plots in Fig. 6(d) showed that both reconstruction methods have similar results. The four absorbers were close to the image center in this experiment, and the effects of wave refraction and mode conversion are minimal, and consequently the distortion is negligible in the reconstructed images.
Figure 6.
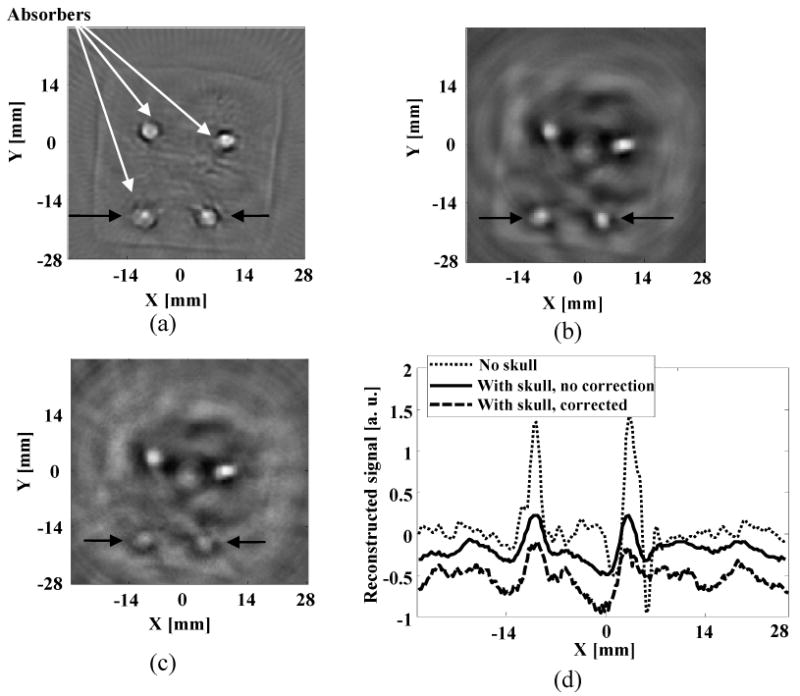
Reconstructed TAT image: (a) using the filtered back-projection method when skull was absent; (b) using the filtered back-projection method when skull was present; (c) using the proposed numerical method when skull was present; (d) comparison of the reconstructed signals at the depth as marked on (a), (b), and (c). We shifted the positions of the plots for (b) and (c) along the y axis by -0.3 and -0.7, respectively.
Figure 7(a) is a schematic of the sample with two small absorbers and the PVC tube used in the experiments, where the phantom sample was close to the left side of PVC tube. Fig. 7(b) is the reconstructed TAT image without the PVC tube present. Here we fixed the sample and rotated the transducer. The reconstructed images for the absorbers were not uniform as compared with the images in Fig. 6 due to non-uniform distribution of electrical field in the tissue. This problem can be alleviated by either rotating the imaging object or microwave source. A detailed discussion of the effects of non-uniform distribution of electrical fields on TAT images is presented in another paper.19 Figure 7(c) is the reconstructed TAT image with the PVC tube present, using the filtered back-projection method. By neglecting the wave refraction and mode conversion at the interfaces between the PVC tube and the surrounding media, the imaging region close to the inner-tube surface was distorted seriously. By using the proposed method, we partially corrected refraction effects and improved the image quality. Figure 7(d) is the corrected image, which shows improvement of the un-compensated image. The boundaries of the distorted absorbers are marked by black arrows in Fig 7(c) and 7(d). In Fig. 7(e) we further compared the two reconstruction methods with the result without the PVC tube present, by plotting their reconstructed signals at the depths marked by arrows in Figs. 7(b), 7(c) and 7(d). The FWHM sizes of the absorbers in Figs. 7(b) and 7(c) are marked by perpendicular lines, respectively, and the FWHM size of the absorber in Fig. 7(d) is marked by two black arrows. The image improvement by the proposed method is obvious, as seen in Fig. 7(e). The major sources of discrepancy between the TAT image without the PVC layer present and the one with the PVC layer present may have resulted from neglecting shear waves and measurement errors.
Figure 7.
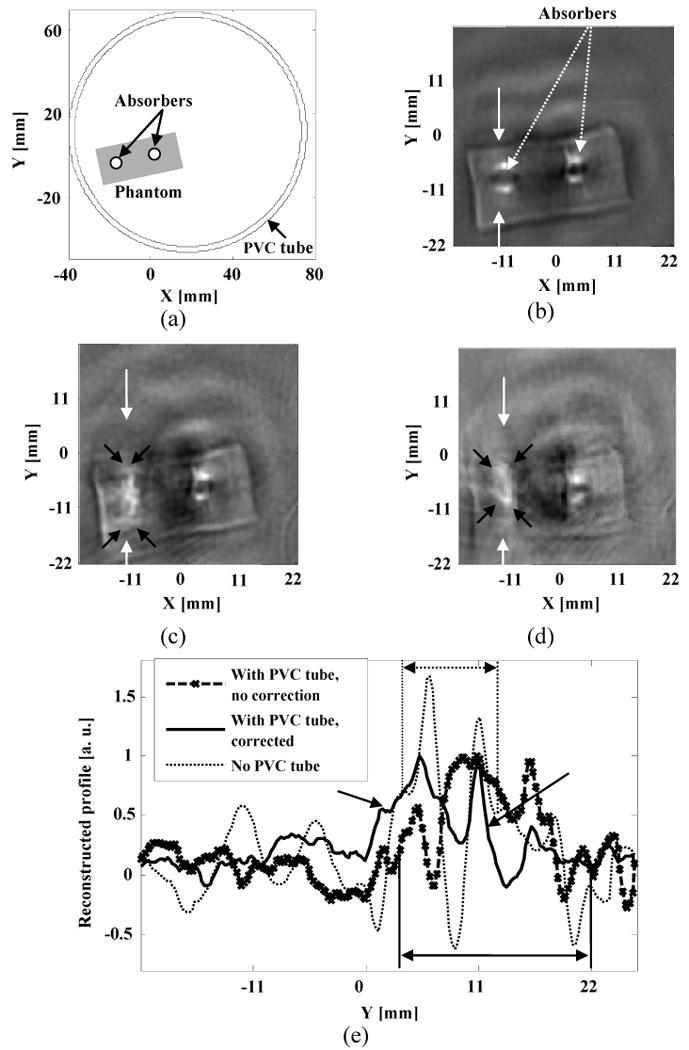
Experimental results with two strong absorbers: (a) Schematic of the phantom sample used in experiments; (b) Reconstructed image with no PVC tube present. The boundaries of the two absorbers are shown clearly in the reconstructed TAT image; (c) Reconstructed TAT image using the filtered back-projection method. PVC tube was used to simulate the skull effects; (d) Reconstructed TAT image using the proposed numerical method. The raw data was the same as the one used for (c); (e) Comparison of the reconstructed signals at the depth as marked on (b), (c) and (d).
Figure 8(a) is a schematic of the wire sample and the PVC tube used in this experiment. Figure 8(b) is the reconstructed TAT image without the PVC layer present. Figures 8(c) and 8(d) are the reconstructed images with the tissue sample close to the upper side of the PVC tube. In Fig 8(c), the wire was distorted seriously in the region close to the inner-tube surface due to neglecting the effects of the wave refraction and mode conversion. By using the proposed numerical method, we corrected those distortions with the measured information about the tube in Fig. 8(d). The line plots across the regions marked by arrows in Figs. 8(b) and 8(c) were compared in Fig. 8(e). The proposed method shows improved image quality as compared with the filtered back-projection method.
Figure 8.
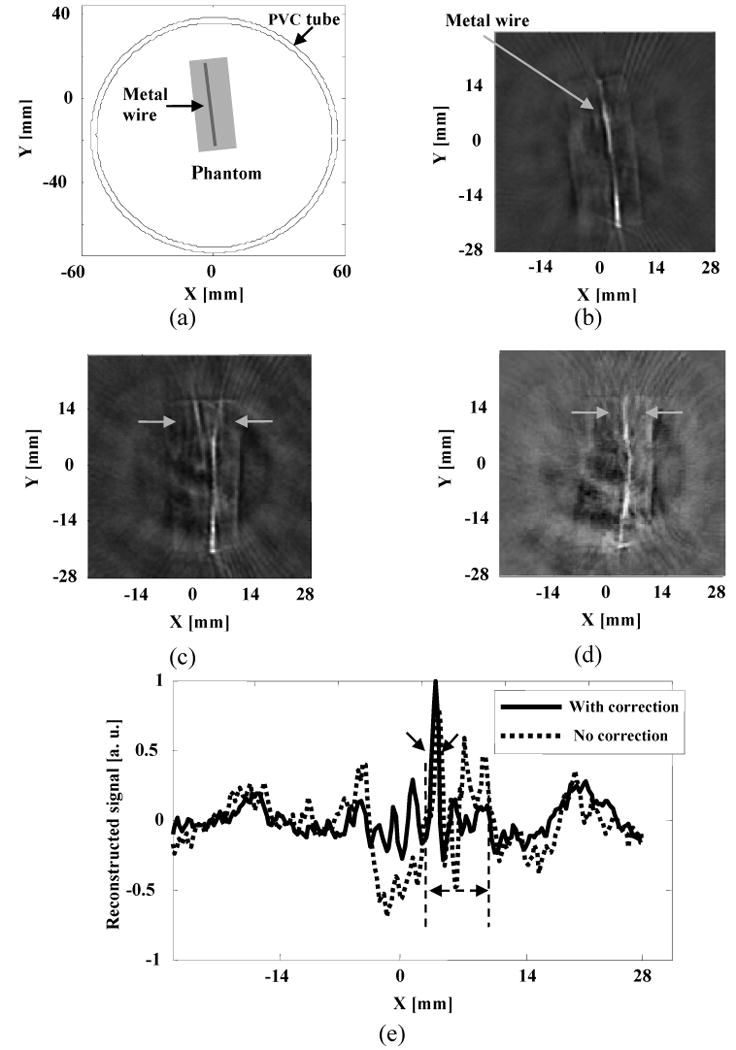
Experimental results with a wire object: (a) Schematic of the phantom sample used in experiments; (b) Reconstructed image with no PVC tube present. (c) Reconstructed TAT image using the filtered back-projection method. PVC tube was used to simulate the skull effects; (d) Reconstructed TAT image using the proposed numerical method. The raw data was the same as the one used for (c); (e) Comparison of the reconstructed signals at the depth as marked on (c) and (d).
5 Discussion
The purpose of this paper is to explore the effects of acoustic heterogeneities on transcranial brain imaging with TAT. By examining the effects of wave reflection and refraction on the TAT image, it is shown that when the skull shape and acoustic properties are provided, we can correct the phase distortions and minimize the artifacts.
The skull is assumed to be acoustically homogeneous in this preliminary study. We used ultrasonic pulse-echo imaging to get the position of a PVC tube, which was then used to correct the distortion of the TAT image. In real applications, the skull bone is an acoustically heterogeneous material that consists of three relatively homogeneous layers: the outer and the inner ivory tables and the central diploe layer. The ivory tables cause attenuation primarily through reflections at the interfaces. It has also been shown that acoustic speeds can vary greatly in those three layers. Due to the intrinsic weakness of ultrasonic imaging, the effectiveness of the numerical compensation method is, thus, limited by the accuracy of the information on the inner and outer skull surfaces, thickness of the skull, and internal structure of the skull. Fortunately, it has been shown that MRI and CT can provide accurate shape and thickness information on the skull, and especially, CT can also provide position-dependent density, speed of sound, and absorption information about the three different layers in the skull. Thus it is preferable to use CT-derived skull information to compensate for the distortion induced by the skull on TAT brain images in real applications.11,20 With good image registration, the skull information obtained with CT can be used with TAT for long-term monitoring of brain disorder.
The effects of shear waves on TAT image have been neglected in this proposed numerical method. When the target regions are close to the skull surface, however, more incident angles become large. By neglecting shear waves in our reconstruction, we lose information in those regions and consequently weaken the image intensity in those regions. Studies show that if we can quantitatively evaluate the shear waves in the skull bone, we can also incorporate shear waves for imaging.14,21 Further experimentation by including shear waves in the numerical model may enhance the image quality in the region close to the inner-skull surface.
6 Conclusion
We evaluated the effects of acoustic heterogeneities on transcranial brain imaging with TAT. A numerical model was proposed and applied to reconstruct images with experimental data. We evaluated the conditions under which we can ignore the skull effects in image reconstruction, and showed that by incorporating the skull shape and acoustic properties into image reconstruction, the image quality can be improved. This study is an important step toward improving the image quality of transcranial brain imaging with TAT.
Acknowledgments
The authors wish to thank the Washington National Primate Research Center for providing the monkey sample, and George Stoica and Alejandra Garcia-Uribe for their advice and help with the tissue sample. We acknowledge the useful comments from the reviewers as well. This project was sponsored by National Institutes of Health grants R01 NS46214 and R01 EB000712.
References
- 1.Wang LH, Zhao X, Sun H, Ku G. Microwave-induced acoustic imaging of biological tissues. Rev Sci Instr. 1999;70:3744–3748. [Google Scholar]
- 2.Kruger RA, Stantz KM, Kiser WL., Jr Thermoacoustic CT of the Breast. Proc SPIE. 2002;4682:521–525. [Google Scholar]
- 3.Dines KA, Fry FJ, Patrick JT, Gilmor RL. Computerized ultrasound tomography of the human head: experimental results. Ultrason Imag. 1981;3:342–351. doi: 10.1177/016173468100300404. [DOI] [PubMed] [Google Scholar]
- 4.Ylitalo J, Koivukangas J, Oksman J. Ultrasonic reflection mode computed tomography through a skullbone. IEEE Trans Biomed Engr. 1990;37:1059–1066. doi: 10.1109/10.61031. [DOI] [PubMed] [Google Scholar]
- 5.Xu Y, Wang LV. Rhesus monkey brain imaging through intact skull with thermoacoustic tomography. IEEE Trans Ultrason Ferroelect Freq Contr. 2006;53:542–548. doi: 10.1109/tuffc.2006.1610562. [DOI] [PubMed] [Google Scholar]
- 6.Holland BA, Haas DK, Norman D, Brant-Zawadzki M, Newton TH. MRI of normal brain maturation. AJNR Am J Neuroradiol. 1986;7:201–208. [PMC free article] [PubMed] [Google Scholar]
- 7.Letts M, Kaylor D, Gouw G. A biomechanical analysis of halo fixation in children. J Bone Joint Surgery. 1988;70-B:277–279. doi: 10.1302/0301-620X.70B2.3346303. [DOI] [PubMed] [Google Scholar]
- 8.Jin X, Wang LV. Thermoacoustic tomography with correction for acoustic speed variations. Phys in Med and Biol. 2006;51:6437–6448. doi: 10.1088/0031-9155/51/24/010. [DOI] [PubMed] [Google Scholar]
- 9.Fry F, Barger J. Acoustical properties of the human skull. J Acoust Soc Amer. 1978;63:1576–1590. doi: 10.1121/1.381852. [DOI] [PubMed] [Google Scholar]
- 10.Kinsler LE, Frey AR, Coppens AB, Sanders JV. Fundamentals of acoustics. John Wiley & Sons, Inc.; 2000. [Google Scholar]
- 11.Aubry JF, Tanter M, Pernot M, Thomas JL, Fink M. Experimental demonstration of noninvasive transskull adaptive focusing based on prior computed tomography scans. J Acoust Soc Am. 2004;113:84–93. doi: 10.1121/1.1529663. [DOI] [PubMed] [Google Scholar]
- 12.Xu M, Wang LV. Universal back-projection algorithm for photoacoustic computed tomography. Phys Rev E. 2005;71:1–7. doi: 10.1103/PhysRevE.71.016706. [DOI] [PubMed] [Google Scholar]
- 13.Xu Y, Ambartsoumian G, Kuchment P, Wang LV. Reconstructions in limited-view thermoacoustic tomography. Med Phys. 2004;31:724–733. doi: 10.1118/1.1644531. [DOI] [PubMed] [Google Scholar]
- 14.White PJ, Clement GT, Hynynen K. Longitudinal and shear mode ultrasound propagation in human skull bone. Ultrasound in Med & Biol. 2006;32:1085–1096. doi: 10.1016/j.ultrasmedbio.2006.03.015. [DOI] [PMC free article] [PubMed] [Google Scholar]
- 15.Fan X, Hynynen K. The effects of curved layers on the power deposition pattern of therapeutic ultrasound beams. Med Phys. 1994;21:25–34. doi: 10.1118/1.597250. [DOI] [PubMed] [Google Scholar]
- 16.Sun J, Hynynen K. Focusing of therapeutic ultrasound through a human skull: a numerical study. J Acoust Soc Am. 1998;104(3):1705–1715. doi: 10.1121/1.424383. [DOI] [PubMed] [Google Scholar]
- 17.Cheeke JDN. Fundamentals and applications of ultrasonic waves. CRC Press; Boca Raton: 2002. [Google Scholar]
- 18.Duck FA. Physical properties of tissue, a comprehensive reference book. Academic Press; 1990. [Google Scholar]
- 19.Li C, Ku G, Manojit P, Wang LV. RF Diffraction Effect in RF-induced Thermoacoustic Tomography: Calibration and Distortion. Proc SPIE. 2008 accepted. [Google Scholar]
- 20.Sun J, Hynynen K. The potential of transskull ultrasound therapy and surgery using the maximum available skull surface area. J Acoust Soc Am. 1999;105:2519–2527. doi: 10.1121/1.426863. [DOI] [PubMed] [Google Scholar]
- 21.Clement GT, White PJ, Hynynen K. Enhanced ultrasound transmission through the human skull using shear mode conversion. J Acoust Soc Am. 2004;115:1356–1363. doi: 10.1121/1.1645610. [DOI] [PubMed] [Google Scholar]


