

Abstract
Background
Temporal trends in prostate cancer incidence and death rates have been attributed to changing patterns of screening and improved treatment (mortality only), among other factors. This study evaluated contemporary national-level trends and their relationships to prostate-specific antigen (PSA) testing prevalence and explored trends in incidence according to disease characteristics using stage-specific delay-adjusted rates.
Methods
Joinpoint regression was used to examine changes in delay-adjusted prostate cancer incidence rates from population-based US cancer registries from 2000 to 2014 by age categories, race, and disease characteristics including stage, PSA, Gleason score, and clinical extension. In addition, the analysis included trends for prostate cancer mortality between 1975 and 2015 by race, and the estimation of PSA testing prevalence between 1987 and 2005. Annual Percent Change was calculated for periods defined by significant trend change points.
Results
For all age groups, overall prostate cancer incidence rates declined about 6.5% per year from 2007. However, incidence of distant stage increased from 2010 to 2014. Incidence of disease according to higher PSA or Gleason score at diagnosis did not increase. After years of significant decline (from 1993 to 2013), the overall prostate cancer mortality trend stabilized from 2013 to 2015.
Conclusion
After a decline in PSA test usage, there has been an increased burden of late-stage disease and the decline in prostate cancer mortality has leveled off.
Keywords: prostate cancer, trends, incidence, mortality, prostate-specific antigen, Gleason score
Introduction
The introduction of prostate-specific antigen (PSA) screening into the population has been linked with the dramatic increase in prostate cancer incidence between 1988 and 1992.1,2 Since the peak in 1992, prostate cancer incidence has been decreasing, with an acceleration in the rate of decrease in more recent years. Several previous studies have suggested that the decline in incidence is associated with decreased screening following the 2012 US Preventive Services Task Force (USPSTF) recommendations against routine PSA testing.3,4,5,6 In addition, the decline may also reflect a reduction in the pool of indolent cancers detectable by screening each year; such reduction is an expected effect of the gradual stabilization of screening and biopsy practices in the 1990s and early 2000s. Some of these previous studies also reported recent increases in distant-stage disease based on changes in proportion of cases.4,5 However, interpretation of incidence trends based on proportion of cases can be misleading; proportions of late-stage disease could increase without a corresponding increase in the overall incidence rate simply because of a decline in incidence of early-stage disease. A recent study reported increases in the rate of distant-stage prostate cancer in men age 50 to 74 years.7 However, this recent study and none of the aforementioned studies simultaneously examined prostate cancer incidence and death rates.
In the United States, information on incident prostate cancer cases is collected and curated by central cancer registries with support from the National Cancer Institute’s (NCI) Surveillance, Epidemiology, and End Results (SEER) Program and the Centers for Disease Control and Prevention’s (CDC) National Program of Cancer Registries (NPCR). Sometimes, case information is transmitted to central cancer registries with a delay because of the need to observe the staging workup and the initiation of treatment. Patients with local and regional disease are more likely to receive radical prostatectomy.8,9 Since the surgery is performed in a hospital setting while other treatment modalities are administered in outpatient centers, there might be a differential delay in reporting by stage based on the location of treatment. Statistical modeling of reporting delay adjusts the current case count to correct for the undercount of cases in the most recent diagnosis years.10 These adjusted counts and associated rates are valuable to more precisely determine changes in cancer trends.11
This study aims to examine trends in prostate cancer incidence and death rates in relation to changes in PSA screening rates using population-based incidence and mortality data and nationally representative screening data. Temporal trends in incidence rates and proportion of cases were examined by stage and other disease characteristics, including PSA level, Gleason score, and clinical extension. Notably, the analysis by stage was adjusted for delays in reporting, the first study to do so.
Methods
Data Sources
Several data sources have been used to estimate trends for annual PSA testing prevalence, prostate cancer incidence rates, and prostate cancer mortality. Annual PSA testing rates were derived from self-reported screening tests captured as part of the National Health Interview Survey (NHIS) conducted in 2000, 2003, 2005, 2008, 2010, 2013, and 2015. From 2005 forward, we used coding consistent with Jemal et al.6 to determine if a survey respondent received a PSA test in the prior year. Questionnaires prior to 2005 were not consistent with those from 2005 onward; for respondents who could not recall precisely the timing of their last test there were more alternative options for ascertaining whether the test was received within the past year, and response options varied for the question asking the main reason for having received a PSA test (e.g., routine physical exam/screening test vs. routine exam). For these reasons, the data are displayed as a disconnected series.
Because questions about PSA testing were not included in the NHIS until the 2000 survey, longer-term trends back to the late 1980s (when PSA screening rapidly disseminated in the US population) must be reconstructed through modeling. Long-term trends in the proportion of men having a PSA test in the previous year and the proportion of men having a first PSA test between 1987 and 2005 are an update of previous modeled estimates.12 The NHIS survey conducted in 2005 asked respondents to specify the year they received their last PSA test, which implicitly is the year of the first test for respondents with just one test. For the corresponding NHIS survey years, intervals between PSA testing have been estimated from claims available for a 5% random sample of Medicare beneficiaries who were residents of SEER areas and had not been diagnosed with cancer.13 Age at first test and intervals between tests were combined to simulate PSA testing patterns starting in 1987.
We used three different prostate cancer incidence series including different geographic areas depending on the purpose of our analysis. To study the impact of long-term PSA testing use on prostate cancer incidence trends, we used cases diagnosed between 1975 and 2014 by site recode definition14 and reported by nine SEER registries (Atlanta, Connecticut, Detroit, Hawaii, Iowa, New Mexico, San Francisco-Oakland, Seattle-Puget Sound, and Utah). Distant-stage incidence for this series was calculated using SEER Historic Stage A. For a shorter-term series that included more geographic areas within the United States, we used a set of registries that satisfied criteria required by the North American Association of Central Cancer Registries (NAACCR) for inclusion in the Cancer In North America annual reports.15 This set included 42 state central cancer registries covering 89% of the US population,16 consistent with the dataset used in an accompanying paper.17 Since consistent staging for these registries was only available back to 2001, we only utilized this series for cases from 2001 forward. Consistent staging was achieved by using SEER Summary Stage 200018,19 for 2001 to 2003 and Derived Summary Stage 200020 for 2004 to 2014. When the Derived Stage 2000 was missing, abstracted stage was utilized if the reporting source was deemed reliable. Finally, to compute prostate cancer incidence trends by PSA test value at diagnosis, Gleason score, and clinical extension of the tumor, we used data from the SEER 18 registries21 for years 2004 to 2014, representing 28% of the US male population. The dataset excluded patients whose only reporting source was a death certificate, an autopsy report, or a nursing home record. For analyses involving disease characteristics, only SEER data were used because they have been recently reviewed for PSA accuracy and any errors corrected back to 2004.22
The highest value of serum PSA within the three months preceding the diagnostic biopsy has been collected by cancer registries for cases diagnosed in 2004 and after. For each calendar year between 2004 and 2014, we categorized patients into three categories of tumor aggressiveness based on the PSA value at diagnosis (0.1-9.9 ng/ml, 10.0-19.9 ng/ml, and 20 ng/ml and over), following clinical management guidelines issued by the American Joint Committee on Cancer (AJCC)23 and the National Comprehensive Cancer Network (NCCN).8
In addition, disease aggressiveness at the time of diagnosis has been assessed based on Gleason score and clinical extension of the primary tumor. All cases have been classified according to the most recent clinical guideline recommendations into Gleason grade group 2-6, grade group 7, grade group 8, grade group 9-10, and grade group unknown.23,24,25 Per cancer registration rules, if Gleason score was available from multiple pathology exams, including core biopsy, transurethral resection, and prostatectomy specimens, the highest known Gleason score was used to assign the grade group.26 The incidence of cases with unknown Gleason score has decreased over time, but the decline was not statistically significant.
Using the Collaborative Stage Derived AJCC-6 T variable,27 we categorized patients diagnosed from 2004 to 2014 by extraprostatic extension into the following groups: no extraprostatic extension (corresponding to clinical T1-T2), extraprostatic extension (corresponding to clinical T3-T4), and unknown extraprostatic extension status. The extraprostatic extension definitions used were those recommended for the assignment of the TNM clinical T for prostate by AJCC28 and include physical examinations, biopsies (including biopsies of the seminal glands), and imaging examinations.
The mortality files were obtained from the National Center for Health Statistics. We calculated prostate cancer mortality for years 1975 to 2015 using all cases with an underlying cause of death coded to malignant neoplasm of the prostate (ICDA-8 and ICD-9 code 185 in 1975–1998 and ICD-10 code C61 in 1999-2015). Race information available on the death certificate was used to calculate race-specific prostate cancer death rates for black men and white men.
The 2000 US standard population was employed for the age adjustment of all incidence and mortality estimates. A more in-depth description of incidence and death rates estimation is available in an accompanying paper.17 All incidence rates have been adjusted for reporting delays according to methodology described under Statistical Methods. When employed, age and race variables have been collected and categorized following the NAACCR data standards.29
Statistical Methods
Historically, delay-adjustment modeling was done only for registries in the SEER areas, but in the last several years it has been expanded to include registries throughout the United States and Canada that participate in the NAACCR Call for Data.30 Delay-adjustment factors are typically developed by registry, cancer site, age, and race, but for this project they were also developed for prostate cancer by stage of disease for cases diagnosed from 2001 to 2014, using SEER Summary Stage 200018,19 for 2001 to 2003 and Derived Summary Stage20 for 2004 to 2014. For example, for US cases from 2014 for all races combined, the count needs to be adjusted upwards of about 7% for localized and regional disease cases and 15% for distant and unstaged cases. Both incidence rates and proportions of cancer cases were delay-adjusted. For rates, only the numerator (i.e., case counts) was delay-adjusted, while for the proportions of cases (e.g., proportion of cases with extraprostatic extension) both the numerator and denominator were delay-adjusted. Delay-adjusted rates and proportions involving disease characteristics were not stage-specific.
SEER*Stat software, version 8.3.4,31 has been used to calculate the age-adjusted incidence, using the delay-adjusted counts, for each of the risk categories. In addition, the counts have been used to calculate the proportion of patients in each risk group by diagnosis year. A trend analysis has been conducted to identify the joinpoints (i.e., trend change years) and estimate the annual percent change (APC) of the incidence rate. Separately, the same analysis was employed to study the change in the proportion of cases diagnosed with certain disease characteristics (e.g., low PSA, intermediate PSA, high PSA). We calculated incidence and trends for all cases by age category (50-74 years, 75 years or older) and race (black men, white men). Age categories have been selected to replicate those relevant in the context of the USPSTF recommendations for PSA-based screening.3,4
Temporal trends in age-standardized delay-adjusted cancer incidence and death rates were estimated using joinpoint regression,32 which uses statistical criteria to determine both the number and location of trend changes. The joinpoint model fits linear trends to the log-transformed incidence or death rates with the slope of the trend changing at the joinpoints. The maximum possible number of joinpoints is determined by the number of observation points. The slope of the model represents the APC in rates. A two-sided statistical significance (P < .05) t test is used to determine if the APC differs significantly from zero.
Results
Trends in PSA testing and prostate cancer incidence
Figure 1 displays the long-term trends in PSA testing and the incidence of prostate cancer (all stages combined and distant stage). The use of PSA testing increased very rapidly in the initial years after the test was first approved for the surveillance of prostate cancer patients by the US Food and Drug Administration in 1986, with the incidence of newly-tested men peaking in 1992. The dissemination of men having a PSA test went from practically zero in 1987 to 24% of men age 50 and over having had at least one test by 1992. The rapid increase in PSA testing between 1987 and 1992 coincides with the dramatic increase in prostate cancer incidence during 1988 through 1992 and a slightly delayed sharp decline in distant-stage prostate cancer incidence between 1991 and 1994. The rise and fall of first PSA test mimicked that of prostate cancer incidence. The incidence of PSA testing in previously unscreened men peaked between 1991 and 1992 when the prevalence of men receiving their first PSA test was close to 10%.
Figure 1.
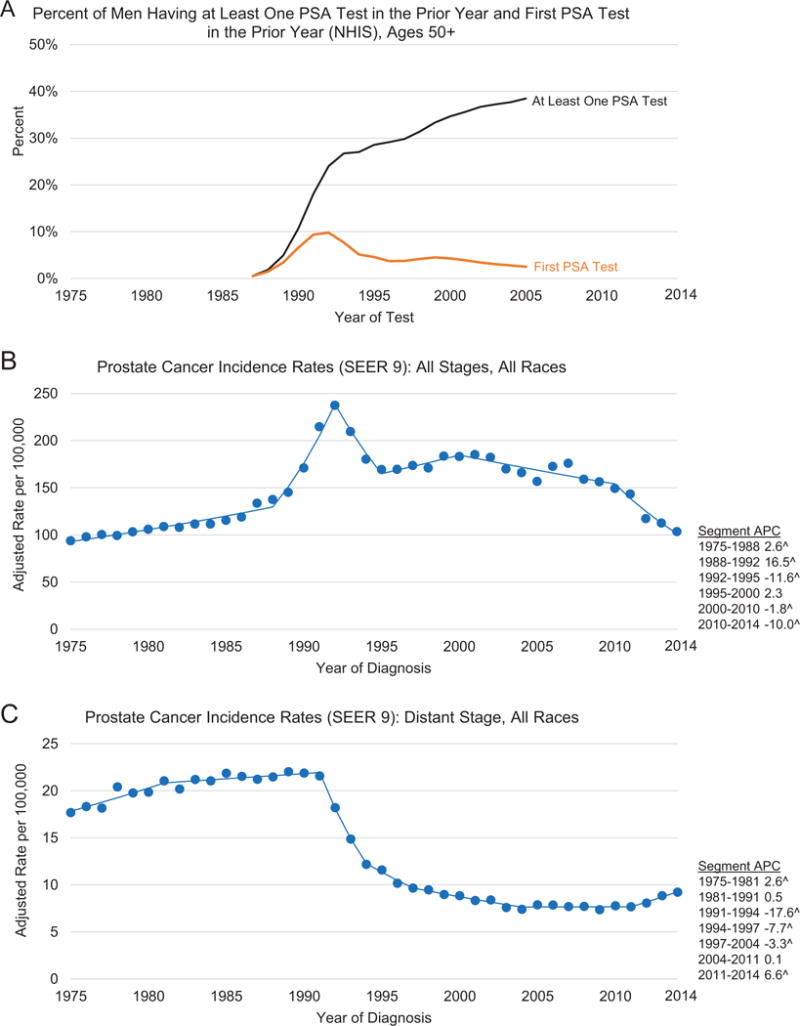
Trends in the proportion of men age ≥50 years who received PSA testing in the prior year, United States, 1987-2005I, and trends in age- and delay-adjusted prostate cancer incidence rates among men of all races combined by stage at diagnosis, SEER 9II, 1975-2014. A) Percent of men having at least one PSA test in the prior year and first PSA test in the prior year (NHIS), ages 50+. B) Prostate cancer incidence rates (SEER 9): all stages, all racesŦ. C) Prostate cancer incidence rates (SEER 9): distant stage, all racesŦ. Rates are per 100,000 persons and were age-adjusted to the 2000 US standard population and delay-adjusted for age and stage at diagnosis. ŦNote: the y-axis ratio for B to C is 10:1. ISource: Reconstructed from data from Medicare claims and the National Health Interview Survey, based on methodology in Reference 12. IISource: The SEER 9 registries are Atlanta, Connecticut, Detroit, Hawaii, Iowa, New Mexico, San Francisco-Oakland, Seattle-Puget Sound, and Utah. ˆThe trend was statistically significant from 0 (P < 0.05). APC = annual percentage change; PSA = prostate-specific antigen; SEER = Surveillance, Epidemiology, and End Results.
While Figure 1A shows the trends of PSA testing, Figures 2A–2C present the most recent trends in PSA screening by race and age category. In addition, Figures 2D–2I present prostate cancer incidence for all stages combined and distant-stage disease. Screening rates declined after 2008 for all age and race categories shown, except for black men age 75 years or older. As measured by the NHIS, PSA testing rates for all races and white men declined for men age 50 to 74 years in 2013 as compared to the prior survey in 2010. For all age groups shown, prostate cancer incidence rates consistently declined about 6% per year starting in 2007 for white men, and in 2009 for black men. For distant-stage disease, there was an inflection point in the trends across all ages and racial groups. In all cases, except for black men age 75 years or older, the rise in rates was significant after the joinpoint. The joinpoint varied from 2010 to 2011 for all ages combined and for men age 75 years or older, and from 2008 to 2009 for men age 50 to 74 years. However, the confidence intervals constructed around the starting point of the final segment of distant-stage disease overlapped (age category 50-74, 95% confidence interval for joinpoint: 2006-2011; age category 75+, 95% confidence interval for joinpoint: 2009-2012; data not shown in figures). The rise in the incidence rate distant-stage prostate cancer occurred at a time when relatively fewer incident cases were reported as unstaged (2004-2014 APC for Unstaged Incidence Rate, All races=−4.0; Whites=−5.3; Blacks=−3.6; data not shown in figures). Thus, the increase in distant-stage incidence rates can be partially explained by better staging workup and/or better stage documentation.
Figure 2.
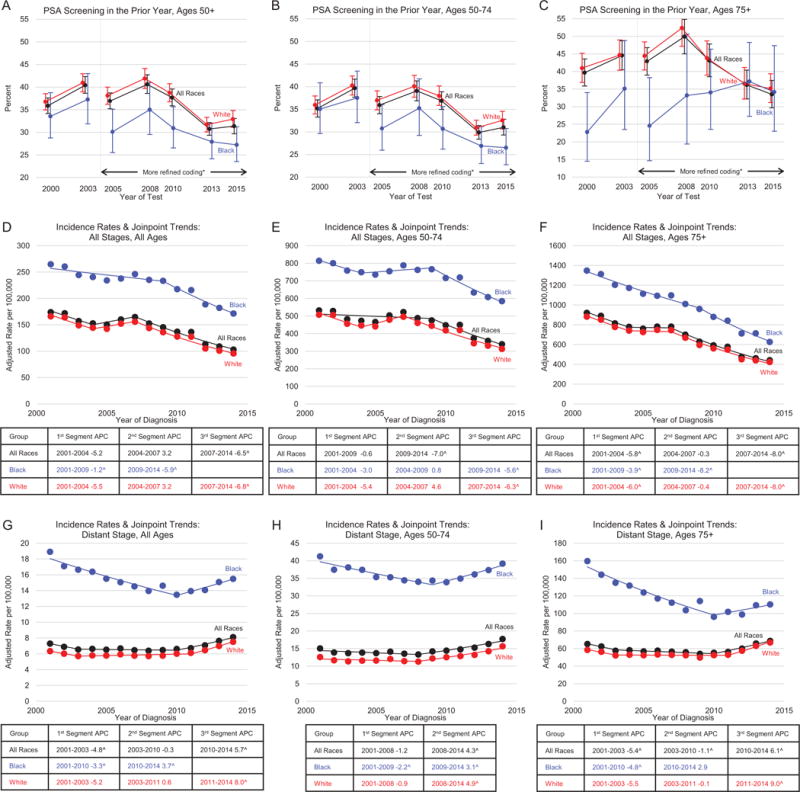
Trends in proportion of men age ≥50 years who received a PSA screening test in the prior year by age group, NHIS, 2000-2015I, and trends in age- and delay-adjusted prostate cancer incidence rates by race, age group, and stage at diagnosis from 42 registries representing 89% of the US population, NAACCR, 2001-2014II. A) PSA screening in the prior year, ages 50+. B) PSA screening in the prior year, ages 50-74. C) PSA screening in the prior year, ages 75+. D) Incidence rates & joinpoint trends: all stages, all agesŦ. E) Incidence rates & joinpoint trends: all stages, ages 50-74Ŧ. F) Incidence rates & joinpoint trends: all stages, ages 75+Ŧ. G) Incidence rates & joinpoint trends: distant stage, all agesŦ. H) Incidence rates & joinpoint trends: distant stage, ages 50-74Ŧ. I) Incidence rates & joinpoint trends: distant stage, ages 75+Ŧ. Error bars represent 95% confidence intervals. Rates are per 100,000 persons and were delay-adjusted for age and stage at diagnosis. ŦNote: D-I have different y-axes. ISource: National Health Interview Survey. IISource: North American Association for Central Cancer Registries. ˆThe trend was statistically significant. *Better ascertainment of the year the test was received. APC = annual percent change.
While Figures 1–5 show incidence rate estimates from three different datasets representing varying levels of population coverage and time-intervals, the average annual prostate cancer incidence trend for the common time period (years 2004-2014) and the dataset covering the largest population (89% of the US) was −5.1% (data not shown in figures).
Figure 5.
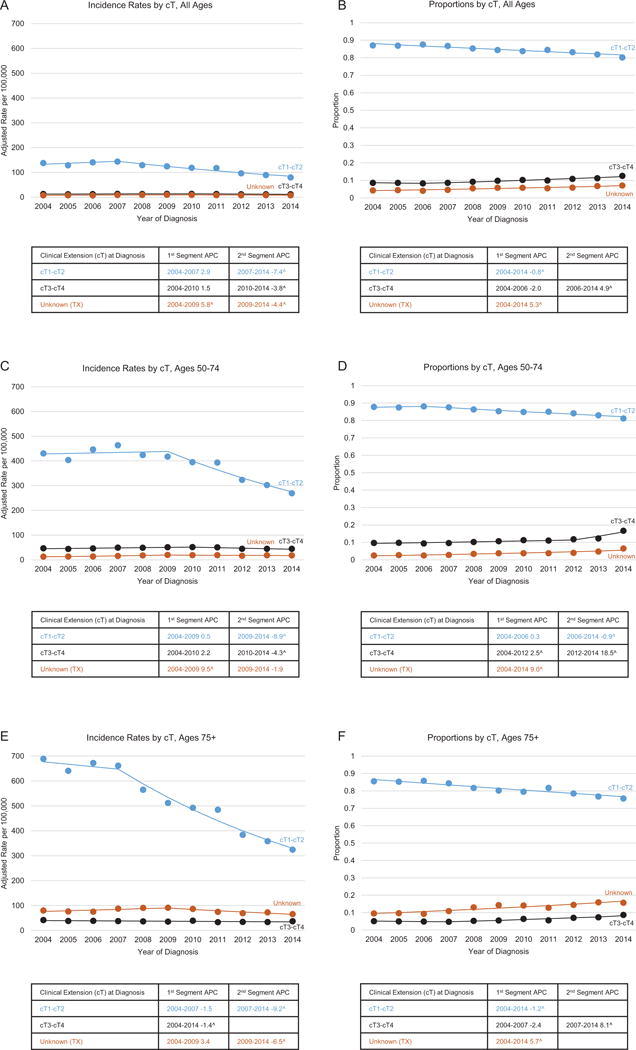
Trends in age- and delay-adjusted prostate cancer incidence rates and proportion of cases by clinical extension and age category, SEER 18, 2004-2014I. A) Incidence rates by cT, all ages. B) Proportions by cT, all ages. C) Incidence rates by cT, ages 50-74. D) Proportions by cT, ages 50-74. E) Incidence rates by cT, ages 75+. F) Proportions by cT, ages 75+. Rates are per 100,000 persons and were delay-adjusted for age and stage at diagnosis. ISource: the SEER 18 registries are Connecticut, Georgia, Greater California, Hawaii, Iowa, Kentucky, Louisiana, New Jersey, New Mexico, Utah, the Alaska Native Tumor Registry, Arizona Indians, the Cherokee Nation Cancer Registry, metropolitan Atlanta and rural Georgia, San Francisco-Oakland and San Jose-Monterey, Los Angeles, Detroit, and Seattle-Puget Sound. APC = annual percentage change; SEER = Surveillance, Epidemiology, and End Results.
Trends in prostate cancer incidence and proportions by disease characteristics
As shown in Figure 3, most patients were diagnosed at PSA levels below 10 ng/ml (low recurrence risk); this is true for all age categories. Proportionally, fewer men age 75 years or older were diagnosed at PSA levels below 10 ng/ml than men age 50 to 74 years. The highest incidence rate of cases diagnosed at PSA below 10 ng/ml among men age 75 years or older was observed in 2007 and a statistically significant downtrend occurred after 2007. However, the incidence rate of diseases diagnosed at low risk peaked earlier among patients diagnosed at age 75 years or older (2007) than among patients age 50 to 74 years (2009). Meanwhile, the incidence rate of prostate cancer diagnosed at PSA levels above 20 ng/ml (high recurrence risk) for men of all ages declined steadily through 2012 and has plateaued in more recent years, except for men age 50 to 74 years, whose incidence rate of diseases diagnosed at high risk has continued to decline through 2014.
Figure 3.
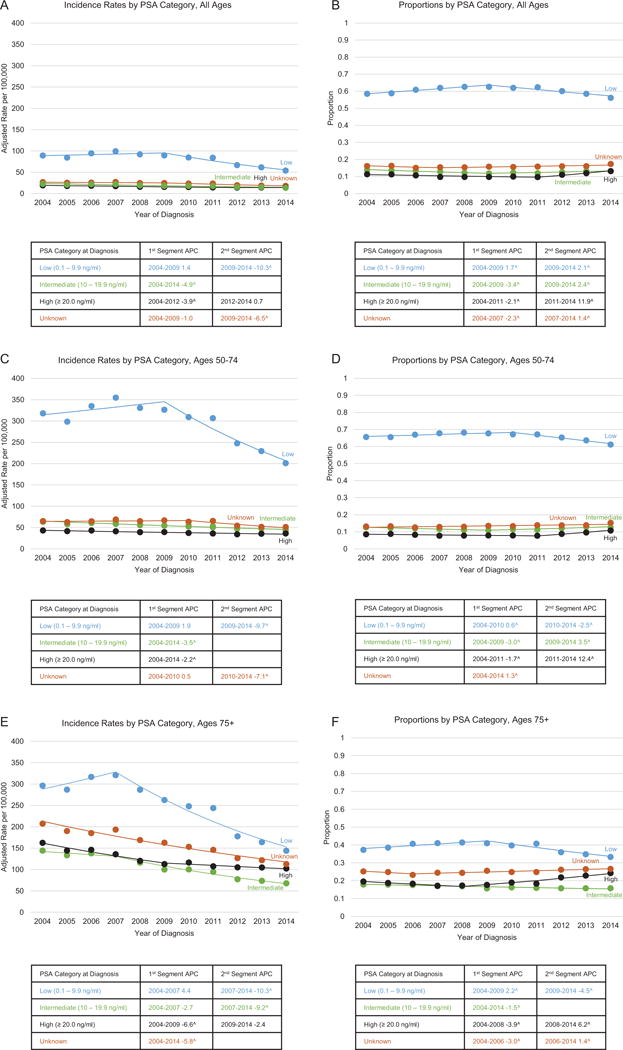
Trends in age- and delay-adjusted prostate cancer incidence rates and proportion of cases by PSA value and age category, SEER 18, 2004-2014I. A) Incidence rates by PSA category, all ages. B) Proportions by PSA category, all ages. C) Incidence rates by PSA category, ages 50-74. D) Proportions by PSA category, ages 50-74. E) Incidence rates by PSA category, ages 75+. F) Proportions by PSA category, ages 75+. Rates are per 100,000 persons and were delay-adjusted for age and stage at diagnosis. ISource: the SEER 18 registries are Connecticut, Georgia, Greater California, Hawaii, Iowa, Kentucky, Louisiana, New Jersey, New Mexico, Utah, the Alaska Native Tumor Registry, Arizona Indians, the Cherokee Nation Cancer Registry, metropolitan Atlanta and rural Georgia, San Francisco-Oakland and San Jose-Monterey, Los Angeles, Detroit, and Seattle-Puget Sound. APC = annual percentage change; PSA = prostate-specific antigen; SEER = Surveillance, Epidemiology, and End Results.
Figure 4 shows that the incidence rate of tumors with aggressive histologic grade (i.e., Gleason score 9-10) for all ages combined remained steady between 2004 and 2014 (APC=0.0). However, for men age 75 years or older, there was a small but persistent decline (APC=−1.1) in the incidence rate of patients that presented with Gleason score 9–10 at diagnosis between 2004 and 2014. For the same age category, the downtrend in cases diagnosed at Gleason score 2–6 was sharp, as shown by an almost three-fold decrease in incidence between 2004 and 2014 (293 per 100,000 vs. 89 per 100,000). Gleason score 7 became the most prevalent presentation of prostate tumors at diagnosis in 2010 (40%) and has been increasing slightly ever since (41% in 2014). After 2010, the proportion of new tumors diagnosed at Gleason 2–6 decreased, while the proportion of tumors that presented a more aggressive Gleason score increased. This trend (APC=12.4) was particularly apparent among men age 50 to 74 years, with nearly 9% of patients newly diagnosed in 2014 presenting the most aggressive Gleason score category.
Figure 4.
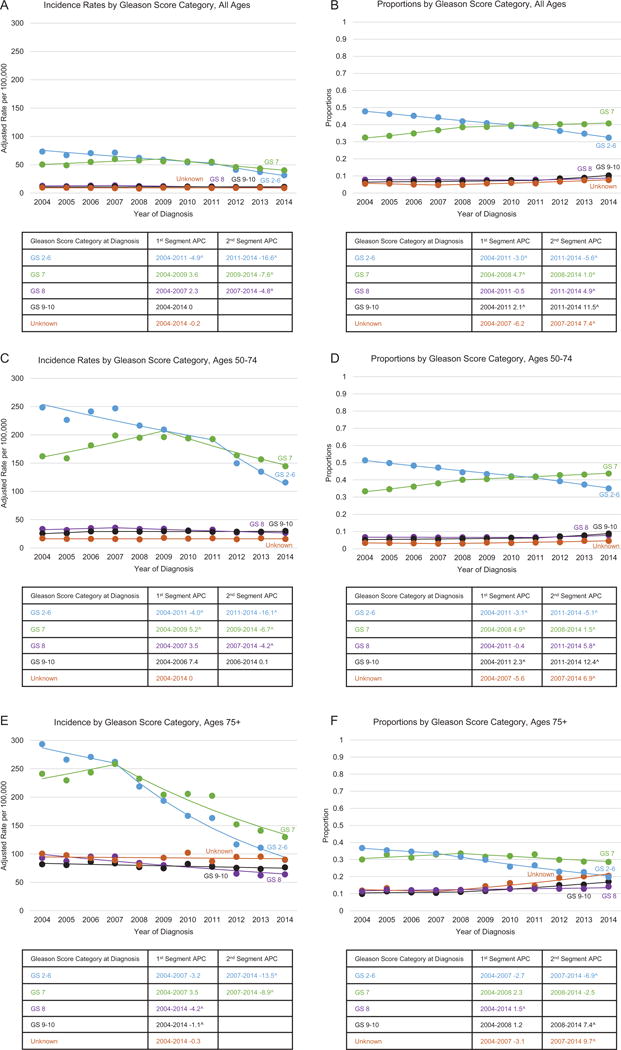
Trends in age- and delay-adjusted prostate cancer incidence rates and proportion of cases by Gleason score and age category, SEER 18, 2004-2014I. A) Incidence rates by Gleason score category, all ages. B) Proportions by Gleason score category, all ages. C) Incidence rates by Gleason score category, ages 50-74. D) Proportions by Gleason score category, ages 50-74. E) Incidence rates by Gleason score category, ages 75+. F) Proportions by Gleason score category, ages 75+. Rates are per 100,000 persons and were delay-adjusted for age and stage at diagnosis. ISource: the SEER 18 registries are Connecticut, Georgia, Greater California, Hawaii, Iowa, Kentucky, Louisiana, New Jersey, New Mexico, Utah, the Alaska Native Tumor Registry, Arizona Indians, the Cherokee Nation Cancer Registry, metropolitan Atlanta and rural Georgia, San Francisco-Oakland and San Jose-Monterey, Los Angeles, Detroit, and Seattle-Puget Sound. APC = annual percentage change; SEER = Surveillance, Epidemiology, and End Results.
As presented in Figure 5, the clear majority of tumors were assessed as confined to the prostate gland at the time of diagnosis (corresponding to clinical T1-T2). Overall, the incidence of unknown T increased between 2004 and 2009 and decreased significantly with the introduction of the AJCC 7th edition in 2010. The incidence of the prostate-confined tumors (clinical T1-T2) has been declining steadily after it peaked in 2007 (144 per 100,000), at approximately the same slope for all cases combined (APC=−7.4), men age 50 to 74 years (APC=−8.9) and men age 75 or older years (APC=−9.2). The incidence of tumors with clinical extraprostatic extension (corresponding to cT3-cT4) has also been decreasing in all age categories (APC=−3.8, −4.3, and −1.4, respectively), albeit at a slower pace than the cT1-cT2 decrease.
Trends in prostate cancer mortality rates
Prostate cancer mortality increased slowly before 1987 (APC=0.9), but the trend moved upward at a steeper rate after 1987 for all races (APC=3.0) and white men (APC=3.1) and after 1988 for black men (APC=3.2), as shown in Figure 6. The highest mortality during the observation period (1975-2015) for all races combined was observed in 1993 (39.3 per 100,000). Mortality for black men peaked in 1993 (81.9 per 100,000), two years after mortality peaked for white men (36.5 per 100,000). Following the peak, a greater decline in mortality was observed in black men (APC=−2.5) compared to white men (APC=−0.7). Between 2001 and 2015, the rate of decline among black men increased to an APC of −4.2. However, following a more sustained fall between 1994 and 1999 (APC=−4.3), the mortality decline slowed among white men (APC=−3.3) and then leveled off after 2013 (APC=−0.4, statistically non-significant).
Figure 6.
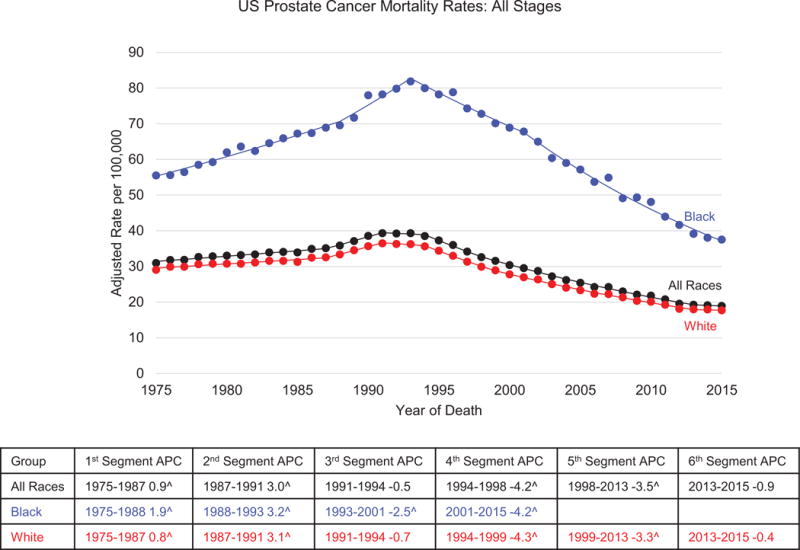
Trends in prostate cancer death rates by race, United States 1975-2015I. Rates are per 100,000 persons and were age-adjusted to the 2000 US standard population. ISource: National Center for Health Statistics. APC = annual percentage change.
Discussion
Original contribution
This paper uses national surveillance data to examine in detail the recent trends in prostate cancer incidence rates (based on data representing 89% of the US population) and prostate cancer death rates (based on mortality data covering the entire United States). The incidence estimates are presented by race and stage concurrent with PSA testing. To improve the accuracy of incidence estimation, the analysis employed stage-specific delay-adjustment coefficients, which were found to be twice as large for distant and unstaged disease compared with local and regional disease. These stage-specific delay-adjustment coefficients allowed for a better correction of reporting delay, a bias that potentially masks a trend change in the most recent years of a time series. Trends in the distribution of tumor characteristics, including PSA test value, Gleason score, and clinical extension of the tumor, at the time of diagnosis allowed the examination of differences associated with more aggressive disease. The analysis has been conducted using the only population-based dataset for which PSA values have been fully audited and corrected.22 Presenting prostate cancer statistics alongside PSA testing estimates gives insight into the interpretation of prostate cancer trends and how PSA test usage may have influenced national statistics.
An observation not fully explained is the dissonance of generally downward or stable incidence trends for prostate cancer diagnosed with the most aggressive disease characteristics (i.e., high PSA level, Gleason score 9-10, and extraprostatic extension) and the upward trend of distant disease incidence after 2010. Specifically, in most recent years (2010-2014) the incidence of cases with high PSA levels and Gleason scores 9–10 cases was relatively flat, and the incidence of extraprostatic extension cases decreased significantly, at the same time the incidence of distant disease increased significantly.
This analysis included all incident prostate cancer diagnosed in the covered areas and observation periods, irrespective to the diagnosing facility type (e.g., hospital vs. independent urology practice) and disease management plan (e.g., active surveillance vs. curative-intent treatment). Underreporting of outpatients under active surveillance is a general concern in cancer surveillance; however, this type of bias is less likely to affect patients diagnosed at late stage since these patients typically receive treatment in inpatient settings.
Difference between incidence and proportion
When looking at the characteristics of cancer at diagnosis, data are shown as incidence rates and proportions of cases in each category of PSA test value, Gleason score, and clinical extraprostatic extension. Incidence rates reflect the population risk of being diagnosed with a cancer having certain characteristics, while the proportions of cases reflect the probability that a man diagnosed with prostate cancer will present with specific characteristics. For example, assuming a steady rate of cases with high PSA levels, as the incidence rate decreases for cases with low PSA levels (the cases most likely to be detected by testing), the proportion of cases presenting with high PSA levels will increase. However, this increase in the proportion of cases with high PSA levels does not necessarily imply either an increase in the incidence rate of cases with high PSA levels or an increase in the number of men diagnosed with high PSA levels. This report shows that as the proportions of cases with high PSA levels, high Gleason scores, and clinical extraprostatic extension increased, the actual incidence rates of those cases decreased or remained the same. When testing is introduced into the population or when testing usage declines, changes in the proportion of cases diagnosed with aggressive disease can be incorrectly interpreted as a change in risk. Moreover, changes in early detection procedures and in staging workup sensitivity make the interpretation of proportion even more difficult. For example, waiting for serial PSA measurements to calculate PSA velocity before performing the first biopsy can increase the counts of patients diagnosed at high-risk PSA. Similarly, more sensitive imaging techniques may result in better detection of cases with extraprostatic extension. Thus, the distribution of disease characteristics at diagnosis and the trend based on proportions alone is difficult to interpret. Looking at incidence rates and proportion distributions side-by-side for prostate cancer demonstrates the importance of considering both measures when interpreting trends to understand cancer burden.
Change in screening recommendations and the expected impact and timing on incidence
In this report, trends in PSA testing seem to reflect the timing of changes in the USPSTF recommendations. In August 2008, the USPSTF recommended an “I” rating (insufficient evidence) for PSA-based prostate cancer screening for men younger than age 75 years, but a “D” rating (recommendation against screening) for men age 75 years or older.3 PSA testing use declined after 2008 for all races and for white men in particular. In May 2012, the USPSTF revised their recommendations to a “D” rating for PSA-based prostate cancer screening regardless of age.4 PSA screening rates for all races, and for white men in particular, declined for men age 50 to 74 years in 2013 as compared to 2010.
We show that when PSA testing was initially introduced in the late 1980s there was a very rapid decline in the incidence of distant-stage prostate cancer. From this, it might be anticipated that reduced testing usage may trigger a similarly rapid increase in distant-stage disease. Starting with the 2008 NHIS, we report a modest fall in PSA testing, consistent with other reports.33 Concomitantly, we observed an increase in distant-stage disease incidence of 4.4 per 100,000 (between 2008 and 2014). There is a continuum of potential for progression in the cancers poised to be diagnosed at any point in time. When medical providers increase the intensity of screening, certain would-be distant cases are likely to be detected at an earlier stage. The rapid decline in distant-stage prostate cancer incidence in the early 1990s, shortly after PSA-based prostate cancer screening started, corroborates this explanation, as do simulations using well-calibrated models of the natural history of prostate cancer.34
In May 2017, the USPSTF issued a draft recommendation statement changing a “D” rating to a “C” rating for men age 55 to 69 years, indicating that the decision about whether to be screened for prostate cancer should be an individual one.35 This could again result in changes in PSA testing and, consequently, the incidence of distant-stage prostate cancer.
In contrast to overall prostate cancer incidence rates, trend inflection points for cases diagnosed at low PSA levels by age category followed the chronology of the USPSTF recommendations (the decrease occurred first and was more significant among age 75 years or older). The incidence rate of prostate cancer with high PSA levels decreased slightly until 2012 and appears to have flattened from 2012 to 2014. High PSA levels at prostate cancer diagnosis is associated with a higher risk of recurrent disease.36 The incidence rate of high-grade disease was relatively stable, and the risk of extraprostatic extension decreased both before and after the USPSTF recommendations.
Change in assigning Gleason score
The 2005 International Society of Urological Pathology (ISUP) Consensus Conference recommended that high-grade tumor of any quantity should be included in the calculations of the Gleason score. 25 These recommendations have been reflected in the distribution of cases diagnosed in 2006 and later.37 As other authors reported, we found a migration of cases from Gleason score group 2–6 to group 7. This migration has been seen in younger patients and had been observed before the 2012 USPSTF recommendations. In addition to the changes in the ISUP guidelines, Gleason score abstracting instructions for cancer registrars changed in 2010. The score of the specimen obtained at prostatectomy was collected separately from the biopsy score and used for this analysis whenever the information was available. Thus, 2010 and later results may reflect better data collection practices. Nevertheless, the underlying population risk for aggressive tumors was unchanged during the 11 years of observation (2004-2014). Among men age 75 years or older, the risk of aggressive histologic grade decreased slightly. However, as with the PSA, the proportion of new cases diagnosed at higher Gleason scores increased significantly in later years. This is expected to have an impact on the distributions of treatment, since having a Gleason score 9–10 is a contraindication for active surveillance or short-term androgen deprivation therapy.
Plausible explanations for changes in mortality trends
A decline in prostate cancer mortality rate for men of all races combined started in 1994 but stabilized between 2013 and 2015. The decline in prostate cancer-specific mortality rate among white men slowed after 1999, well before the 2012 USPSTF "D" recommendation for PSA-based prostate cancer screening. Gulati et al.38 showed an expected flattening of mortality even in the absence of the recent decline in PSA testing. Interpreting trends in mortality is somewhat complex. While this flattening of the mortality trend is temporally associated with the fall in PSA testing and the rise of distant-stage disease, there are other possible contributing factors. For example, the timing and the duration of the flattening could have been affected by improvements in treatment.39,40 Since 1994, multiple factors might have contributed to a continuing decline in prostate cancer mortality, such as recent trends toward earlier detection and improved treatment of metastatic and castration-resistant disease.41,42 In conjunction with incidence data, death rate trends over the next few years can be used to track the role of PSA screening in declining prostate cancer mortality, although these trends may be partially confounded by steady improvements in prostate cancer treatment and by earlier detection of recurrent disease.
Limitations
Joinpoint regression is a powerful method to detect changes in trend when the magnitude of change is small. However, there is uncertainty of the exact location of a joinpoint (i.e., year of rate change), and this uncertainty is greater when the APC change between two successive segments is small but still statistically significant. This makes it particularly difficult to determine the exact temporal relationship between interventions (i.e., screening, therapeutics) and population-based effects.
A comprehensive evaluation of any preventive intervention involves weighing both benefits and harms. This analysis did not attempt to cover patterns of adverse effects at the population or individual level and did not focus on indicators that may point to changes in trends in the frequency of adverse effects. Better information on the trends of adverse effects is necessary to understand whether the changes in incidence and mortality trends reported by this paper translated in a change of the risk-benefit ratio at the population level. In addition to understanding how the risk-benefit ratio has changed, cancer control efforts for prostate cancer may be informed by a more in-depth analysis of how measures of occurrence based on disease characteristics are related to incidence of late-stage disease and disease-specific mortality.
Conclusion
This analysis of prostate cancer trends adjusted for delays in reporting by stage of disease showed an increase in the incidence of late-stage disease from 2010 to 2014. This change chronologically followed new recommendations in the USPSTF guidelines for PSA-based prostate cancer screening.3,4 In addition, the incidence of disease characteristics has changed, as newly diagnosed patients are less likely to present with low-risk localized disease, and consequently less likely to be eligible for active surveillance. However, there was no increase in the incidence of patients with other high-risk characteristics (i.e., high PSA, high Gleason score, and extraprostatic extension) to date. These findings, together with the flattening of previously declining mortality trends, illustrate a trend of increasing late-stage disease after decreasing PSA screening at the population level.
Acknowledgments
We gratefully acknowledge the contributions of the state and regional cancer registry staff for their work in collecting the data used in this study. In addition, we thank Danny Miller, Joe Zou, Steve Scoppa, and Rick Firth of Information Management Services, Inc., for assistance in creating the data and generating the results used in this report. Finally, we thank Drs. Barnett S. Kramer, Matthew R. Cooperberg, Ruth Etzioni, and Mr. Roman Gulati for their insightful review of the manuscript.
Funding Sources: This work was supported by the National Cancer Institute, the Centers for Disease Control and Prevention, the American Cancer Society, and the North American Association of Central Cancer Registries.
The findings and conclusions in this article are those of the authors and do not necessarily represent the official positions of the author’s agencies (the Centers for Disease Control and Prevention, the National Cancer Institute, the American Cancer Society, the North American Association of Central Cancer Registries, or the National Cancer Registrars Association).
Footnotes
Conflict/Interest disclosures: Stacey Fedewa, Jiemin Ma, and Ahemdin Jemal are employed by the American Cancer Society, which received a grant from Merck, Inc. for intramural research outside the submitted work; however, their salaries are solely funded through American Cancer Society funds.
Author contributions: Serban Negoita: Conceptualization, formal analysis, investigation, methodology, project administration, resources, supervision, validation, visualization, writing – original draft, writing – review and editing. Eric J. Feuer: Conceptualization, formal analysis, investigation, methodology, software, validation, visualization, writing – original draft, writing – review and editing. Angela Mariotto: Conceptualization, formal analysis, investigation, methodology, visualization, writing – original draft, writing – review and editing. Kathleen A. Cronin: Conceptualization, formal analysis, investigation, methodology, visualization, writing – original draft, writing – review and editing. Valentina Petkov: Conceptualization, methodology, visualization, writing – review and editing. Sarah K. Hussey: Conceptualization, investigation, project administration, validation, visualization, writing – original draft, writing – review and editing. Vicki Benard: Conceptualization, funding acquisition, supervision, writing – review and editing. S. Jane Henley: Formal analysis, methodology, visualization, writing – review and editing. Robert N. Anderson: Conceptualization, investigation, methodology, writing – review and editing. Stacey Fedewa: Investigation, writing – review and editing. Recinda L. Sherman: Data curation, investigation. Betsy A. Kohler: Conceptualization, investigation. Barbara J. Dearmon: Conceptualization, writing – review and editing. Andrew J. Lake: Data curation, formal analysis, investigation, resources, software, validation, visualization, writing – review and editing. Jiemin Ma: Investigation, writing – review and editing. Lisa Richardson: Conceptualization, supervision, writing – review and editing. Ahmedin Jemal: Conceptualization, formal analysis, investigation, methodology, supervision, validation, visualization, writing – review and editing. Lynne Penberthy: Conceptualization, formal analysis, funding acquisition, investigation, methodology, project administration, resources, supervision, validation, visualization, writing – original draft, writing – review and editing.
This article has been contributed to by US Government employees and their work is in the public domain in the USA.
References
- 1.Potosky AL, Miller BA, Albertsen PC, Kramer BS. The role of increasing detection in the rising incidence of prostate cancer. JAMA. 1995;273(7):548–52. [PubMed] [Google Scholar]
- 2.Brawley OW. Trends in prostate cancer in the United States. J Natl Cancer Inst Monogr. 2012;2012(45):152. doi: 10.1093/jncimonographs/lgs035. [DOI] [PMC free article] [PubMed] [Google Scholar]
- 3.US Preventive Services Task Force. Screening for prostate cancer: US Preventive Services Task Force recommendation statement. Ann Intern Med. 2008;149:185–191. doi: 10.7326/0003-4819-149-3-200808050-00008. [DOI] [PubMed] [Google Scholar]
- 4.US Preventive Services Task Force. Screening for prostate cancer: US Preventive Services Task Force recommendation statement. Ann Intern Med. 2012;157(2):120–134. doi: 10.7326/0003-4819-157-2-201207170-00459. [DOI] [PubMed] [Google Scholar]
- 5.Hu JC, Nguyen P, Mao J, et al. Increase in Prostate Cancer Distant Metastases at Diagnosis in the United States. JAMA Oncol. 2017;3(5):705–707. doi: 10.1001/jamaoncol.2016.5465. [DOI] [PMC free article] [PubMed] [Google Scholar]
- 6.Jemal A, Fedewa SA, Ma J, et al. Prostate cancer incidence and PSA testing patterns in relation to USPSTF screening recommendations. JAMA. 2015;314(19):2054–61. doi: 10.1001/jama.2015.14905. [DOI] [PubMed] [Google Scholar]
- 7.Houston KA, King J, Li J, Jemal A. Trends in Prostate Cancer Incidence Rates and Prevalence of Prostate-Specific Antigen Screening by Socioeconomic Status and Regions in the US, 2004–2013. J Urol. 2017 doi: 10.1016/j.juro.2017.09.103. pii: S0022-5347(17)77650-1. [DOI] [PMC free article] [PubMed] [Google Scholar]
- 8.National Comprehensive Cancer Network (NCCN) NCCN clinical practice guidelines in oncology [online] Available from URL: http://www.nccn.org/professionals/physician_gls/f_guidelines.asp [accessed Sept 26, 2017]
- 9.Pettersson A, Robinson D, Garmo H, Holmberg L, Stattin P. Age at diagnosis and prostate cancer treatment and prognosis: a population-based cohort study. Ann Oncol. 2017 doi: 10.1093/annonc/mdx742. [DOI] [PubMed] [Google Scholar]
- 10.Clegg LX, Feuer EJ, Midthune DN, Fay MP, Hankey BF. Impact of reporting delay and reporting error on cancer incidence rates and trends. J Natl Cancer Inst. 2002;94(20):1537–1545. doi: 10.1093/jnci/94.20.1537. [DOI] [PubMed] [Google Scholar]
- 11.Huang L, Midthune D, Krapcho M, Zou Z, Horner MJ, Feuer EJ. Adjusting for reporting delay in cancer incidence when combining different sets of cancer registries. Biom J. 2013;55(5):755–770. doi: 10.1002/bimj.201100191. [DOI] [PubMed] [Google Scholar]
- 12.Mariotto AB, Etzioni R, Krapcho M, Feuer EJ. Reconstructing PSA testing patterns between black and white men in the US from Medicare claims and the National Health Interview Survey. Cancer. 2007;109:1877–1886. doi: 10.1002/cncr.22607. [DOI] [PubMed] [Google Scholar]
- 13.National Cancer Institute. About SEER-Medicare Data Files. Healthcare Delivery Research Program [online] Available from URL: https://healthcaredelivery.cancer.gov/seermedicare/aboutdata/ [accessed Oct 12, 2017]
- 14.National Cancer Institute. Site Recode. Surveillance, Epidemiology, and End Results Program [online] Available from URL: https://seer.cancer.gov/siterecode/ [accessed Oct 12, 2017]
- 15.NAACCR Research Application Review Workgroup. Information for CINA Deluxe Data Investigators [online] Available from URL: https://20tqtx36s1la18rvn82wcmpn-wpengine.netdna-ssl.com/wp-content/uploads/2017/02/Information-for-CINA-Deluxe-Investigators-2014.pdf [accessed Oct 12, 2017]
- 16.NAACCR. Regsitry Data Fitness for Use by Data Year (1995–2014) CiNA Deluxe for Researchers [online] Available from URL: https://www.naaccr.org/cina-deluxe-for-researchers/ [accessed Oct 12, 2017]
- 17.Cronin KA, Lake AJ, Scott S, et al. The Annual Report to the Nation on the Status of Cancer Part I: National Cancer Statistics. In Press. [DOI] [PMC free article] [PubMed] [Google Scholar]
- 18.Surveillance, Epidemiology, and End Results Program Summary staging guide for the Cancer Surveillance, Epidemiology, and End Results (SEER) Program. Bethesda, MD: National Institutes of Health, National Cancer Institute; 1977. [Google Scholar]
- 19.Surveillance, Epidemiology, and End Results Program Summary staging guide for the Cancer Surveillance, Epidemiology, and End Results (SEER) Program. Bethesda, MD: National Institutes of Health, National Cancer Institute; 2000. [Google Scholar]
- 20.NAACCR. Derived SS2000. Chapter X: Data Dictionary [online] Available from URL: http://datadictionary.naaccr.org/default.aspx?c=10#3020 [accessed Oct 12, 2017]
- 21.Surveillance, Epidemiology, and End Results (SEER) Program. Research Data (1973–2014) National Cancer Institute, DCCPS, Surveillance Research Program; www.seer.cancer.gov. released April 2017, based on the November 2016 submission. [Google Scholar]
- 22.Adamo MP, Boten JA, Coyle LM, et al. Validation of prostate-specific antigen laboratory values recorded in Surveillance, Epidemiology, and End Results registries. Cancer. 2016;123(4):697–703. doi: 10.1002/cncr.30401. [DOI] [PMC free article] [PubMed] [Google Scholar]
- 23.American Joint Committee on Cancer Mahul BA, Editor in Chief, Editorial Board. AJCC Cancer Staging Manual. 8th. Springer Nature; 2016. [Google Scholar]
- 24.College of American Pathologists. Srigley JR, Zhou M, Allan R, et al. Protocol for the Examination of Specimens From Patients With Carcinoma of the Prostate Gland. 2017 Version: Prostate 4.0.0.0. [Google Scholar]
- 25.Epstein JI, Allsbrook WC, Jr, Amin MB, Egevad LL, ISUP Grading Committee The 2005 International Society of Urological Pathology (ISUP) Consensus Conference on Gleason Grading of Prostatic Carcinoma. Am J Surg Pathol. 2005;29(9):1228–42. doi: 10.1097/01.pas.0000173646.99337.b1. [DOI] [PubMed] [Google Scholar]
- 26.Adamo M, Dickie L, Ruhl J. SEER Program Coding and Staging Manual 2016. National Cancer Institute; 2016. pp. 100–101. Available from URL: https://seer.cancer.gov/manuals/2016/SPCSM_2016_maindoc.pdf#search=program+coding+manual [accessed Dec 21, 2017] [Google Scholar]
- 27.NAACCR. Derived AJCC-6 T. Chapter X: Data Dictionary [online] Available from URL: http://datadictionary.naaccr.org/default.aspx?c=10#2940 [accessed Oct 12, 2017]
- 28.American Joint Committee on CancerGreene FL, Page DL, Fleming ID, Fritz AG, Balch CM, Haller DG, Morrow M, editors. AJCC Cancer Staging Manual. 6th. Philadelphia, PA: J.B. Lippincott; 2002. [Google Scholar]
- 29.Thornton ML, editor. Standards for Cancer Registries Volume II: Data Standards and Data Dictionary, Record Layout Version 16. 20th. Springfield, Ill: North American Association of Central Cancer Registries; September 2015, revised October 2015, revised November 2015. [Google Scholar]
- 30.National Cancer Institute. Cancer Incidence Rates Adjusted for Reporting Delay. Surveillance Research Program [online] Available from URL: https://surveillance.cancer.gov/delay/ [accessed April 11, 2017]
- 31.Surveillance Research Program, National Cancer Institute. SEER*Stat Software. Bethesda, MD: National Cancer Institute; 2017. Version 8.3.4. [Google Scholar]
- 32.Surveillance Research Program, National Cancer Institute. Joinpoint Regression Program. Bethesda, MD: National Cancer Institute; 2017. Version 4.5.0.1. [Google Scholar]
- 33.Berkowitz Z, Li J, Richards TB, Marcus PM. Patterns of Prostate-Specific Antigen Test Use in the U.S., 2005–2015. Am J Prev Med. 2017 doi: 10.1016/j.amepre.2017.08.003. pii: S0749-3797(17)30438-5. Epub ahead of print. [DOI] [PMC free article] [PubMed] [Google Scholar]
- 34.Stout NK, Knudsen AB, Kong CY(Joey), McMahon PM, Gazelle GS. Calibration Methods Used in Cancer Simulation Models and Suggested Reporting Guidelines. PharmacoEconomics. 2009;27(7):533–545. doi: 10.2165/11314830-000000000-00000. [DOI] [PMC free article] [PubMed] [Google Scholar]
- 35.US Preventive Services Task Force (USPSTF) Screening for Prostate Cancer website. 2017 http://www.screeningforprostatecancer.org.
- 36.Han M, Partin AW, Zahurak M, Piantadosi S, Epstein JI, Walsh PC. Biochemical (Prostate Specific Antigen) Recurrence Probability Following Radical Prostatectomy for Clinically Localized Prostate Cancer. J Urol. 2003;169(2):517–523. doi: 10.1097/01.ju.0000045749.90353.c7. [DOI] [PubMed] [Google Scholar]
- 37.Epstein JI, Amin MB, Reuter VE, Humphrey PA. Contemporary Gleason Grading of Prostatic Carcinoma: An Update With Discussion on Practical Issues to Implement the 2014 International Society of Urological Pathology (ISUP) Consensus Conference on Gleason Grading of Prostatic Carcinoma. Am J Surg Pathol. 2017;41(4):e1–e7. doi: 10.1097/PAS.0000000000000820. [DOI] [PubMed] [Google Scholar]
- 38.Gulati R, Tsodikov A, Etzioni R, et al. Expected population impacts of discontinued prostate-specific antigen screening. Cancer. 2014;120(22):3519–26. doi: 10.1002/cncr.28932. [DOI] [PMC free article] [PubMed] [Google Scholar]
- 39.James ND, de Bono JS, Spears MR, et al. STAMPEDE Investigators Abiraterone for Prostate Cancer Not Previously Treated with Hormone Therapy. N Engl J Med. 2017;377(4):338–351. doi: 10.1056/NEJMoa1702900. [DOI] [PMC free article] [PubMed] [Google Scholar]
- 40.Poorthuis MHF, Vernooij RWM, van Moorselaar RJA, de Reijke TM. First-line non-cytotoxic therapy in chemotherapy-naive patients with metastatic castration-resistant prostate cancer: a systematic review of 10 randomised clinical trials. BJU Int. 2017;119(6):831–845. doi: 10.1111/bju.13764. [DOI] [PubMed] [Google Scholar]
- 41.Etzioni R, Tsodikov A, Mariotto A, et al. Quantifying the role of PSA screening in the US prostate cancer mortality decline. Cancer Causes & Control. 2008;19(2):175–181. doi: 10.1007/s10552-007-9083-8. [DOI] [PMC free article] [PubMed] [Google Scholar]
- 42.Shore N, Heidenreich A, Saad F. Predicting Response and Recognizing Resistance: Improving Outcomes in Patients With Castration-resistant Prostate Cancer. Urology. 2017;109:6–18. doi: 10.1016/j.urology.2017.04.062. [DOI] [PubMed] [Google Scholar]