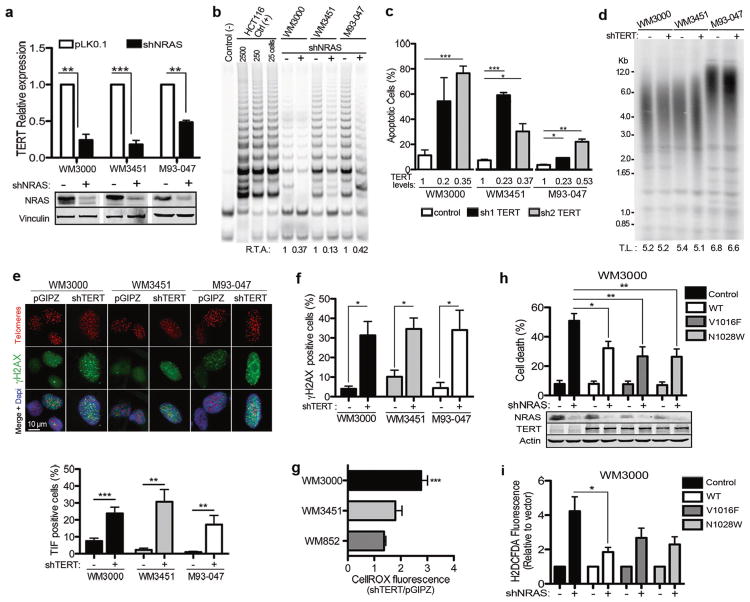
Fig. 1.
Depletion of TERT induces rapid death of NRAS-mutant melanoma cells. a, b NRASmut melanoma cells were transduced with lentiviruses enconding NRAS shRNA (+) or non-targeting empty vector control (−). a NRAS levels were assessed by immunoblotting (bottom panel) and TERT mRNA levels were assessed by qRT-PCR. b Relative telomerase activity (R.T.A.) was determined by TRAP assays following NRAS depletion in NRASmut melanoma cells. Negative control (−): primer; positive control (+): HCT116 cells. c–g TERT was depleted using two different hairpins (sh1, sh2). Apoptosis was determined by flow cytometry using the Annexin V analog PSVue in cells transduced with TERT shRNA 10 days post infection (dpi). TERT mRNA levels are shown below the corresponding bar as fold change relative to vector control (c). d Telomere length was assessed by Southern blotting of terminal restriction fragments (TRF) in NRASmut cells 10 days after transduction. (−): empty vector, pGIPZ; (+): TERT shRNA. Mean TRF length expressed as kilobase pairs is indicated at the bottom. e–g NRASmut melanoma cells were transduced with TERT shRNA. Telomere dysfunction-induced foci (TIF) was determined 7 dpi by indirect immunofluorescence combined with fluorescence in situ hybridization (FISH). Bottom panel, quantification of TIF assays from two independent experiments. Cells were scored as TIF positive when 4 or more γH2AX foci (green) co-localized with telomere foci (red) (e). DNA damage was assessed by γH2AX staining by flow cytometry (f). Reactive oxygen species (ROS) levels were measured by CellRox-Deep Red staining by FACS (g). h, i WM3000 cells were transduced with wild type (WT) or catalytically impaired VYLF1016 (V1016F), VYFL1028 (N1028W) TERT-mutant constructs, followed by shRNA-mediated NRAS silencing. Cell death was assessed by FACS measurement of Annexin V and propidium iodide (PI) staining (h). ROS levels were measured by H2DCFDA fluorescence (i). pLKO.1 and pBlast are empty vectors for NRAS shRNA and TERT constructs, respectively. Data represent average of three independent experiments ± SEM. *p < 0.05; **p < 0.01; ***p < 0.005 determined by unpaired Student’s t-test

