Abstract
Purpose
To analyze clinical data indicating a reduction in the induced energy-temperature efficiency relationship during transcranial focused ultrasound (FUS) essential tremor (ET) thalamotomy treatments at higher acoustic powers, establish its relationship with the spatial distribution of the focal temperature elevation, and explore its cause.
Methods
A retrospective observational study of patients (N = 19) treated between July 2015-August 2016 for Essential Tremor (ET) by FUS thalamotomy was performed. These data were analyzed to compare the relationships between the applied power, the applied energy, the resultant peak temperature achieved in the brain and the dispersion of the focal volume. Full ethics approval was received and all patients provided signed informed consent forms before the initiation of the study. Computer simulations, animal experiments, and clinical system tests were performed to determine the effects of skull heating, changes in brain properties and transducer acoustic output, respectively. All animal procedures were approved by the Animal Care and Use Committee and conformed to the guidelines set out by the Canadian Council on Animal Care. MATLAB was used to perform statistical analysis.
Results
The reduction in the energy-efficiency relationship during treatment correlates with the increase in size of the focal volume at higher sonication powers. A linear relationship exists showing that a decrease in treatment efficiency correlates positively with an increase in the focal size over the course of treatment (P < 0.01), supporting the hypothesis of transient skull and tissue heating causing acoustic aberrations leading to a decrease in efficiency. Changes in thermal conductivity, perfusion, absorption rates in the brain, as well as ultrasound transducer acoustic output levels were found to have minimal effects on the observed reduction in efficiency.
Conclusions
The reduction in energy-temperature efficiency during high power FUS treatments correlated with observed increases in the size of the focal volume and is likely caused by transient changes in the tissue and skull during heating.
Introduction
Magnetic Resonance (MR)-guided transcranial focused ultrasound (FUS) is a non-invasive therapeutic modality for brain disorders and diseases. By employing either the mechanical 1 or thermal 2 effects of ultrasound, it is possible to induce a range of biological effects in the brain tissue 3. Clinical and pre-clinical work has been conducted to investigate transcranial FUS for the treatment of a variety of diseases and disorders, including the ablation of brain tumors 4, the delivery of therapeutics beyond the blood-brain barrier 5, 6, and the treatments of neuropathic pain 7 and obsessive compulsive disorder 8.
A particularly successful ongoing clinical application is FUS thalamotomy for the treatment of Essential Tremor (ET). A multi-institutional study into the effectiveness of FUS in treating ET has recently been completed with promising results 9. In this study and prior feasibility studies, it was shown that the patient’s tremor score could be significantly reduced upon treatment 9–11.
During the course of the FUS treatment, multiple ultrasound sonications are performed to cause a small focal thermal coagulation of brain tissue at the anatomically-determined location of the VIM nucleus 10. The power of the repeated sonications is gradually increased over the course of treatment to achieve focal ablation of the targeted brain tissue. From the Pennes bioheat equation 12, it is expected that the temperature will rise linearly with increasing acoustic power, since these short-duration sonications would not be substantially influenced by changes in the blood perfusion 13. However, we present clinical data where the high power sonications during many ET treatments do not follow the expected linear relationship and the total increase in temperature per Joule of applied energy, which we call here energy-temperature efficiency, decreases over the course of the treatment.
It is hypothesized that this reduction in energy-temperature efficiency is the result of changing acoustic parameters along the path of the beam as a function of increasing temperature, on top of the expected aberrations due to variations in skull thickness and density, which de-phase the acoustic beam at the focal volume. In this study, we have quantified these effects and explored the causes of the temperature saturation. Understanding this reduction in efficiency may lead to more effective thalamotomy treatments in the future. In addition, the ability to prevent the expanse of the focal volume would improve the degree of control the operator has over the treatment. These results could have an impact on a wide range of current and future clinical FUS brain therapies.
The aim of the study is to analyze clinical data indicating a reduction in the induced energy-temperature efficiency relationship during transcranial FUS ET thalamotomy treatments at higher acoustic powers, establish its relationship with the spatial distribution of the focal temperature elevation, and explore its cause.
Materials and Methods
Clinical data were obtained with approval from the Research Ethics Board at Sunnybrook Health Sciences Centre (Toronto, ON, Canada) and all patients provided free and informed consent prior to their participation in the study. In addition, all animal procedures were approved by the Sunnybrook Research Institute Animal Care and Use Committee and conformed to the guidelines set out by the Canadian Council on Animal Care.
MATLAB (R2016b with Statistical Toolbox, The Mathworks, Inc., Natick, MA, USA) was used to perform all statistical analyses. The multivariate Pearson correlation coefficients were computed in MATLAB to determine correlation coefficients and their respective P values. A P value of 0.05 was used for significance.
Clinical Data
Nineteen patient treatments were analyzed retrospectively. These patients were treated between July 2015 and August 2016 at Sunnybrook Health Sciences Centre in Toronto, Ontario, Canada and consisted of the entire cohort treated for a clinical trial of focused ultrasound for the treatment of ET FUS thalamotomy. The treatment procedures and inclusion/exclusion criteria followed previous ET FUS thalamotomy studies 9–11.
All patients were treated with a hemispherical, 30-cm-diameter ultrasound phased array operating at a frequency of 670kHz. The array consisted of 1024 transducer elements with independent phase and amplitude control (ExAblate 4000, 670 kHz; InSightec, Haifa, Israel). All hair was removed and a stereotactic frame was affixed to the head for immobilization during the treatment. The patient was then placed on an MRI system patient table and the transducer array placed around the head. A flexible membrane was secured around the head and fixed to the opening of the array such that a water tight volume was formed between the array and the patient’s head. Cooled, degassed water was then circulated in this space to provide skin and skull cooling and to provide a coupling medium for the ultrasound propagation between the array elements and the skin. T2-weighted MRI was used to localize the brain landmarks for targeting and to allow prior CT scans of the skull bone to align with the patient setup. The CT scans were used to correct the beam distortions induced by the skull bone such that a sharp focus was achieved 14–16.
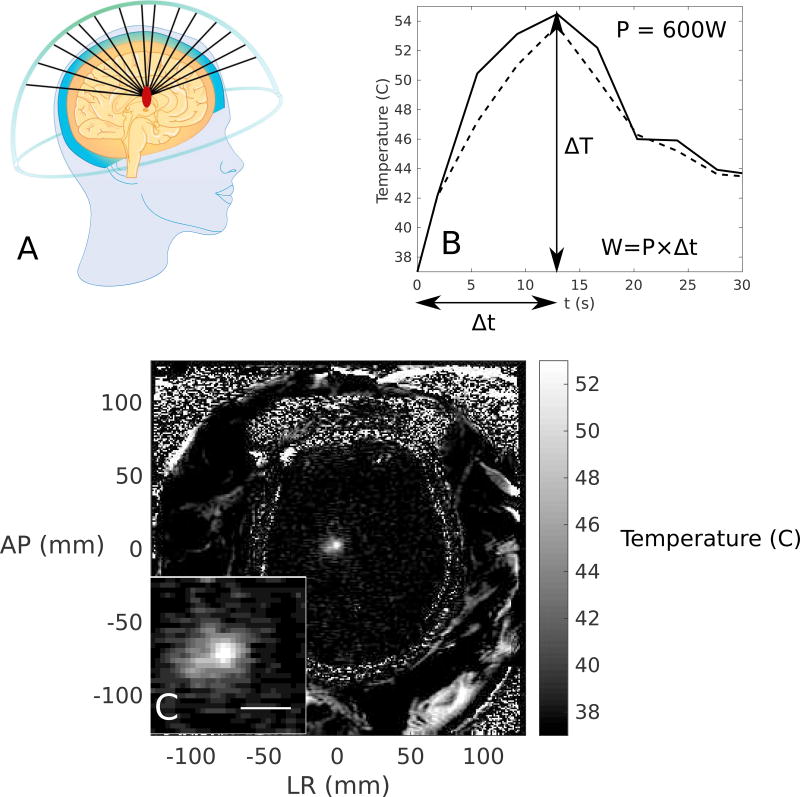
Treatment sonications were performed under the direction of a neurosurgeon (M.L.S.). Low power (100–250 W) sonications were performed first for targeting accuracy. The power was then gradually increased until the peak temperature reached ablative temperatures (approximately 54–60°C), if it was possible. The 2-dimensional (2D) axial temperature map and temporal temperature profile for a single sonication are shown in Figure 1, as well as a schematic of the hemispherical phased array used to perform the FUS thalamotomy, emphasizing the traversal of the different beam paths through skull and brain tissue. The temperature maps were taken at 3.7 s intervals and contained noise of approximately ± 0.5°C.
Figure 1.
(A) A schematic of the hemispherical transcranial focused ultrasound (FUS) device sonicating in the brain from multiple elements, (B) the temperature rise in the focal region as a function of time, illustrating the peak (solid line) and average (dotted line) temperature rises. The change in temperature, ΔT, the duration, Δt, and the calculation of energy, W, are also illustrated to elucidate the calculation of the efficiency metric in Equation 1. (C) The 2D axial temperature map through the focus, with the focal region magnified in the inset. Scale bar = 10 mm.
Image Processing
The temperature rise for each sonication was measured in one of the axial, coronal, or sagittal planes. To control for the natural diffusion effects of longer duration heating, the image slice at the 9 s timepoint was used during the analysis. To reduce the impact of noise, the mean temperature over 3 × 3 voxels at the focus was taken as the temperature rise. Temporal filtering of each voxel was performed using a moving average filter with a window size of 11.1s (3 time points) over the course of treatment. Low power sonications where the focus was not resolvable from the noise and aborted sonications were excluded from the analysis. The total number of sonications and the number of included sonications is outlined in Table 1. A list of all performed sonications for each patient can be found in Supplementary Materials.
Table 1.
A summary of the clinical cases. The number of sonications performed, the peak temperature achieved, the peak applied acoustic power, peak acoustic energy, the maximum sonication duration, and the calculated energy-efficiency correlation are listed along with their respective p-value.
| Patient | Number of Sonications |
Sonications Included in Analysis |
Peak Temperature |
Peak Power (W) |
Peak Energy (J) |
Maximum Duration (s) |
Energy- Efficiency Pearson Correlation Coefficient |
|---|---|---|---|---|---|---|---|
| 1* | 13 | 11/13 | 54.2 | 350 | 4563 | 13 | −0.86 (P = 0.06) |
| 2 | 15 | 15/15 | 51.7 | 800 | 19152 | 24 | −0.76 (P = 0.01) |
| 3 | 13 | 12/13 | 51.3 | 600 | 14388 | 24 | −0.94 (P < 0.01) |
| 4 | 16 | 14/16 | 48.2 | 800 | 19176 | 24 | −0.96 (P < 0.01) |
| 5 | 10 | 10/10 | 52.3 | 350 | 8400 | 24 | −1.00 (P < 0.01) |
| 6 | 9 | 9/9 | 48.4 | 900 | 24327 | 27 | −0.95 (P < 0.01) |
| 7 | 11 | 11/11 | 52.3 | 565 | 11000 | 20 | −0.97 (P < 0.01) |
| 8 | 12 | 12/12 | 53.2 | 600 | 14352 | 24 | −0.97 (P < 0.01) |
| 9 | 13 | 13/13 | 52.0 | 700 | 16764 | 24 | −0.85 (P < 0.01) |
| 10 | 14 | 13/14 | 50.1 | 640 | 22470 | 35 | −0.92 (P < 0.01) |
| 11 | 13 | 11/13 | 52.1 | 600 | 12000 | 20 | −0.98 (P < 0.01) |
| 12 | 13 | 12/13 | 49.9 | 800 | 24986 | 31 | −0.95 (P < 0.01) |
| 13 | 10 | 8/10 | 51.8 | 500 | 13486 | 27 | −0.97 (P < 0.01) |
| 14 | 11 | 9/10 | 51.0 | 550 | 11040 | 20 | −0.96 (P < 0.01) |
| 15 | 16 | 15/16 | 48.4 | 900 | 35256 | 39 | −0.85 (P < 0.01) |
| 16 | 17 | 17/17 | 49.6 | 700 | 27907 | 43 | −0.91 (P < 0.01) |
| 17 | 17 | 15/17 | 47.7 | 750 | 32422 | 43 | −0.73 (P < 0.01) |
| 18 | 10 | 9/10 | 48.5 | 550 | 19337 | 35 | −0.94 (P < 0.01) |
| 19 | 16 | 10/16 | 47.4 | 600 | 24940 | 43 | −0.90 (P < 0.01) |
Patients with non-significant (P > 0.05) power-efficiency correlation coefficient are marked with an asterisk (*).
The focal size was defined as the 50% area around the peak temperature voxel for each sonication. To determine the 50% area, the temperature map was normalized to the peak temperature, and the local 2 cm × 2 cm area around the focus was thresholded and segmented.
Correlation of Efficiency with Other Treatment Parameters
The efficiency, E, of each sonication was defined as
| Equation 1 |
where ΔT is the temperature rise and W is the applied energy, so that E is measured in °C / J. Assuming a linear response between power and temperature, then, one would expect E to remain constant for each patient for a fixed sonication duration 17, 18. The percentage changes in treatment efficiency and focal size between the minimum and maximum acoustic energies were taken to quantify decreases in efficiency and increases in focal size for each patient.
Correlations were then assessed between changes in treatment efficiency and the peak temperatures obtained during the treatment, the peak applied acoustic powers, the peak deposited acoustic energy, the peak sonication durations, the total number of sonications, and the changes in focal size. When assessing the correlation between the change in treatment efficiency and the focal spot size, only those sonications performed in the axial (perpendicular to the main axis of the array) plane were included, because in all analyzed patients, most imaging scans were performed in the axial plane and the axial plane provides the best estimate of the tissue temperature.
Experimental Studies to Explain the Observed Phenomena
To determine the cause of the clinically-observed reduction in energy-temperature efficiency and focal expansion, a series of experiments was also performed.
There are several competing hypotheses to explain the observed reduction in energy-temperature efficiency in the clinical cases. First, it is possible that as the skull heats, either temporary or permanent thermal damage to the skull and scalp causes the acoustical impedance to change, resulting in lower acoustic transmission to the bone in regions of high heating. To test this hypothesis, computer simulations were performed using temperature-dependent acoustic parameters and the results compared to the clinical data.
It is also possible that after repeated sonication, there are changes in the tissue in the focal region that cause absorption to decrease, perfusion to change, or the delivery of energy to already-heated regions to decrease due to changes in acoustic impedance between ablated and non-ablated tissue. To this effect, rabbit experiments were performed using a single transducer, replicating the timescales of the clinical treatments.
Finally, it is possible that the transducer array output decreases over time and the energy being delivered is reduced over longer, higher power sonications. To test this hypothesis, transducer experiments were performed using the clinical phased array and a hydrophone at the focus. The pressure measured on the hydrophone was analyzed as a function of applied acoustic power from the array.
With these experiments performed, the effects of skull heating, tissue heating, and transducer engineering were analyzed for their independent effects to explain the clinical observations.
Computer Simulations on The Effects of Skull Heating
If uniformly applied over the skull, temperature changes in the cranial bone would not explain the observed plateau, since the acoustic phase delays from all elements would experience the same temporal shift. The skull thickness and density, however, vary spatially and cause non-uniform skull heating 19 that could result in the observed defocusing. We sought to explore the effect of this non-uniform heating on the transcranial focusing problem.
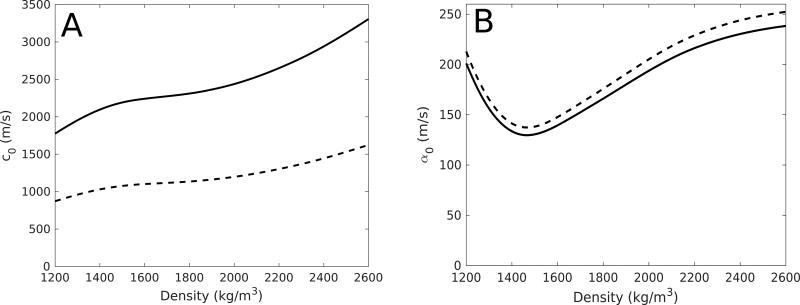
Using previously-developed computer simulations 20, 21, the temperature rise in the skull was simulated for Patient 8 for clinical sonication parameters (600 W power, 24 s duration) to illustrate the effect of temperature-dependent speed-of-sound and attenuation changes on the manifestation of the focus. The temperature fields at 1-s intervals between 0 and 24 s were recorded, assuming constant parameters over each 1-s period. The change in the speed of sound and attenuation as functions of temperature in the skull bone were taken to be ratios relative to the standard acoustic measurements taken at room temperature (20°C) 22, using the mean values over the samples obtained from Nicholson and Bouxsein 23. The speed of sound and attenuation were therefore taken to be separable functions of both density and temperature: c = c(ρ, T) = c0(ρ)β(T) and α = α(ρ, T) = α0(ρ)γ(T), as constant factors scaled from a previous study in the calcaneus bone 23. In the case of speed of sound, β(T) = (1596 – 2.2 T) / 1552, whereas in the case of attenuation, γ(T) = (47.15 + 0.75 T) / 62.15, where T was the temperature in Celsius. Figure 2 illustrates the values of c0(ρ) and α0(ρ) for longitudinal and shear waves, taken from a previous study 22.
Figure 2.
The longitudinal (solid line) and shear (dashed line) speeds of sound (A) and attenuation (B) used in the temperature-dependent numerical simulations.
Assigning each voxel representing bone in the 3-dimensional simulation grid to a temperature-dependent speed of sound and attenuation, the acoustic simulations were then re-run in a stepwise fashion, assuming constant temperature for 1 s at a time. The absorbed power density was then recorded for each timepoint and the temperature rise over the 1-s interval was simulated using the Pennes bioheat equation 12.
In Vivo Rabbit Experiments to Determine the Effect of Brain Absorption, Perfusion Rates and Thermal Conductivity
To determine if there were changes in the brain tissue during multiple sonications, experiments were performed on a New Zealand white rabbit, obtained from Charles River Laboratories (Sherbrooke, QC, Canada) and weighing between 2.5–3 kg at the time of the experiment. These experiments were used to compare the energy-temperature efficiencies after 6 and 15 s of heating, to determine whether brain absorption, perfusion, and thermal conductivity changed substantially upon the repeated application of ultrasound with increasing acoustic powers. A craniotomy was performed 9 days prior to experiments for ultrasound coupling with the brain without skull impediment, so that the effect of brain heating alone could be analyzed. The animal was anesthetized with a cocktail of ketamine (50 mg/kg) and xylazine (5 mg/kg) and maintained on isoflurane (2–2.5%) for the duration of the surgery. The skin over the removed bone was sutured and the wound healed prior to the experimental procedure.
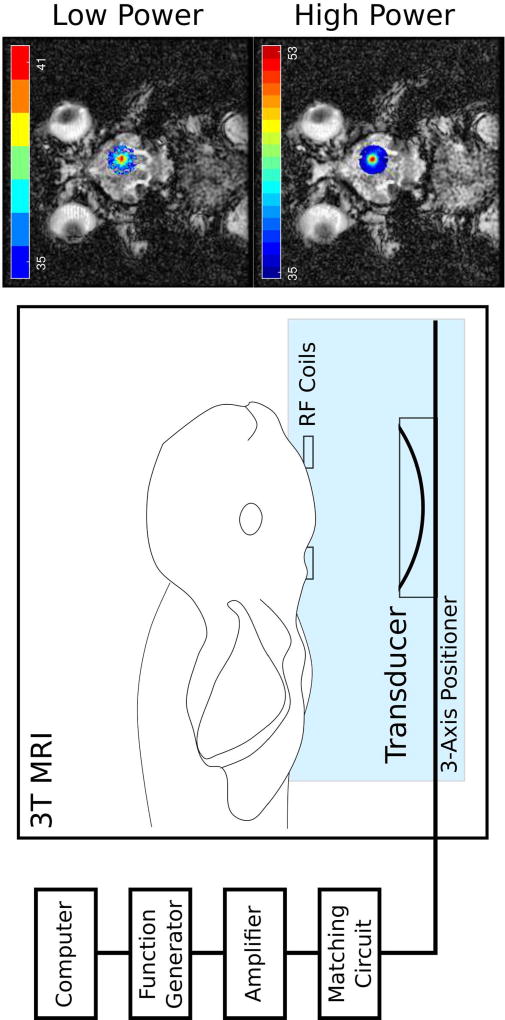
A concave transducer (f = 1.513 MHz, f-number = 0.8, focal length = 10 cm) was used in the experiments. The transducer was moved using a 3-axis positioning system and positioned such that the focus was near to the brain surface, so that skull base heating was of minimal concern. The experimental setup is illustrated in Figure 3, as well as an illustration of the temperature rises recorded using MR thermometry for low and high powers. Lower frequency (f = 0.558 MHz) sonications were also tested. However, due to the longer focus at 0.558 MHz, scalp burning and skull base heating became insurmountable issues in the rabbit model, and these analyses were not included here.
Figure 3.
The experimental setup during the in vivo rabbit experiments. The rabbit is placed supine and the transducer (f = 1.5 MHz) is positioned using a 3-axis positioner to sonicate a central target close to the surface of the brain, to avoid skull base heating. Radiofrequency (RF) coils are placed close to the target for localized thermometry with a 3T MRI system during the treatment. Outside of the magnet room, a custom-built computer interface is used to perform the sonication and provide thermometry feedback. Also illustrated are examples of low and high power sonication thermometry results overlaid on anatomical MR images.
Transducer Array Power Experiments
It was hypothesized that there could be an effect of the transducer elements or the driving electronics and their response at higher acoustic powers. To test this hypothesis, experiments were performed with the clinical system sonicating into degassed water. A 125-µm fiber-optic hydrophone with an active sensor diameter of 10 µm (Precision Acoustics, Dorchester, U.K.) was placed at the geometric focus of the transducer array to measure the acoustic pressure. In the interest of maintaining hydrophone integrity and accuracy, 30% apodization of the transducer array was used, such that only 68 elements were sonicating. The apodization was calculated as a solid angle of the hemispherical array, similar to a previous study 24. Transducer powers were set to be equal among all array elements. The acoustic power on each element ranged from 0.37–1.03 W, such that the total acoustic power on the array ranged from 25–70 W. If the full array were used at this level, then the total array power would range from 379–1055 W, covering most of the range of the clinical treatments.
Results
Correlation of Efficiency with Other Treatment Parameters
Table 2 shows the correlation between the reduction in efficiency in the nineteen patients with various treatment parameters. The results show significant correlation between the reduction in efficiency observed and the peak temperature achieved (P = 0.02), the peak power (P < 0.01), the peak energy (P < 0.01), and the peak duration (P < 0.01). The multiple linear regression has an R-squared value of 0.82 (P < 0.01). This shows that as the peak power, peak energy, and peak duration increased, the efficiency of the treatment would decrease. This is to be expected, since a treatment with lower efficiency at higher powers would typically yield less success, as indicated by the positive correlation between the peak temperature and the efficiency.
Table 2.
Correlations of various treatment parameters with the percentage change in the energy-temperature efficiencies, taken for all nineteen (19) clinical cases, listed with their associated P values. Also included is the multiple linear regression over all five variables.
| Correlation with Percentage Change in Efficiency | ||
|---|---|---|
| Peak temperature | 0.54 (P = 0.02) | |
| Peak energy | −0.79 (P < 0.01) | |
| Peak power | −0.59 (P < 0.01) | |
| Peak time | −0.81 (P < 0.01) | |
| Multiple Linear Regression over all Variables | R-squared | 0.82 (P < 0.01) |
| Percentage Change in Focal Size* | −0.62 (P < 0.01) | |
The percentage change in the focal size is marked with an asterisk, since in this regression the power-temperature efficiency was calculated, instead of the energy-temperature efficiency, since all temperature maps were taken at the 9-s timepoint. In addition, the change in focal size only considered axial sonications.
Table 1 summarizes the nineteen clinical cases analyzed in this clinical trial, emphasizing the energy-efficiency correlation coefficients. In eighteen (18) of the patients, there is significant (P < 0.05) negative correlation between the applied acoustic power and the efficiency. That is, in these patients the efficiency decreased as a function of power. For one (1) patient there was no significant correlation between power and efficiency (Patients 1) and no significant decrease in efficiency. Interestingly, this patient also had the lowest deposited energy.
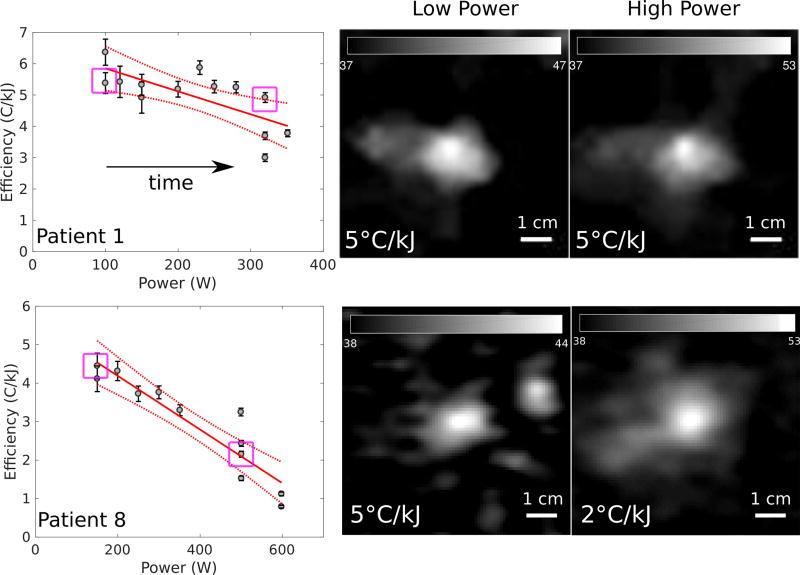
Figure 4 shows examples of the energy-temperature efficiency achieved during each of the sonications during a treatment as a function of applied acoustic power. The examples are presented for a patient with a relatively constant efficiency over time (Patient 1) and a patient with a decreasing efficiency over time (Patient 8) to illustrate the patient variability within the data. The directions of the arrows indicate the order of the sonications in time. This figure demonstrates that in some patients, the efficiency is decreasing with the power and number of sonications.
Figure 4.
The clinical sequences of sonications as functions of power, with sonication order indicated by the arrow directions. Patients 1 and 8 are presented. There is no significant reduction in efficiency over time for Patient 1 (P = 0.06), while there is a significant reduction in efficiency for Patient 8 (P < 0.01). A comparison of clinical cases of low reduction in energy-temperature efficiency (top row, Patient 1) and high reduction in efficiency (bottom row, Patient 8). Axial MR thermometry images are presented for both cases, with low and high power sonications examined. The purple squares in the power-efficiency plots indicate the highlighted cases in the thermometry images. In Patient 1, there is minimal change in the efficiency between low and high powers. In Patient 8, there is a 60% (0.06 – 0.02 / 0.06) decrease in the efficiency between 150 and 600 W.
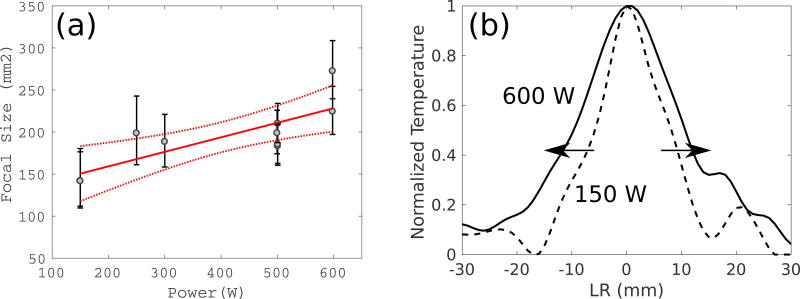
Considering the variation between patients in more detail, the energy-temperature efficiency was constant between low and high powers for Patient 1, whereas there was a 60% decrease in efficiency between low and high powers for Patient 8. Clinical MR thermometry images taken at a timepoint of 9 s are illustrated for these patients in Figure 4, as well as a summary of the relationships between power and efficiency for all sonications. Figure 5 illustrates the relationship between the size of the focus and different power levels for Patient 8, where the focal size increases as the power increases.
Figure 5.
(a) The relationship between the power and the focal size for Patient 8 and (b) another illustration of the expansion of the focal size across the focus between 150 (light gray) and 600 (black) Watts of applied power.
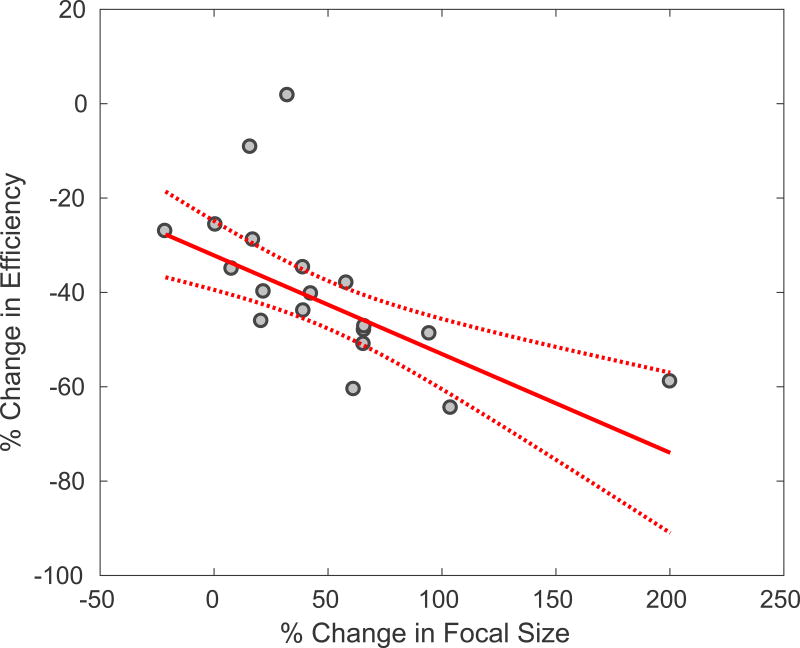
In addition, Figure 6 summarizes the relationship between the rate of change in the energy-temperature efficiency and the focal size as a function of applied acoustic power, for all nineteen clinical cases. There is a significant negative correlation (P < 0.01). Therefore, the less efficient the treatment, the more dispersed the focus at higher powers.
Figure 6.
The linear correlation between the percentage decrease in efficiency and the percentage increase in the size of the focus for all 19 clinical cases. R-squared = 0.52, p-value < 0.01. In this case, the efficiency was calculated using acoustic power, since the focal spot size was taken at 9 s in all cases.
Experimental Studies to Explain the Observed Phenomena
Computer Simulations on The Effects of Skull Heating
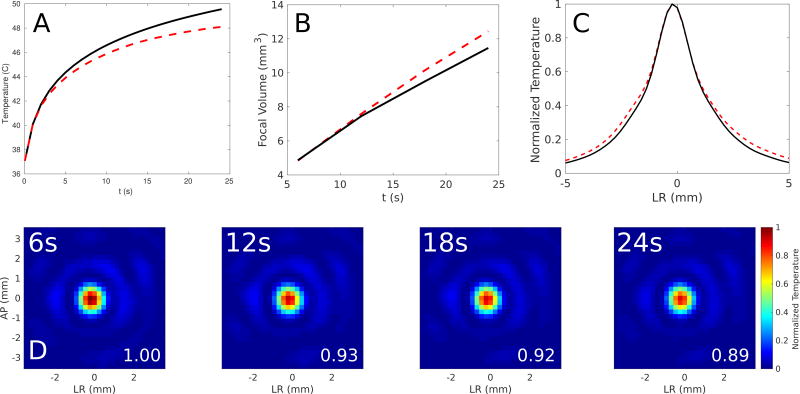
Figure 7 illustrates the reduction in focal temperature rise as a function of time with changing acoustic parameters as a function of temperature, the increase in the focal volume, and the absorbed power density over time. The temperature rise is 12% lower and the focal dispersion is 8% higher over time. Although the general trend is observed in the numerical simulations, the effect was larger in the analyzed clinical cases. From the clinical case, the temperature rise is 68% lower and the focal dispersion is 47% higher over time.
Figure 7.
Computer simulations on the effect of skull heating on the temperature rise at the focus and the focal volume for Patient 8 for (A) a 24-second sonication (black line) and the simulated temperature rise assuming changing speed of sound (thick red dashes). There is a 12% decrease in the simulated peak temperature at 24 s when accounting for temperature-dependent speed-of-sound changes. (B) The increase in the focal volume assuming skull heating (red dashed line) compared to the focal volume with constant acoustic parameters (solid black line). There is an 8% increase in the focal volume when including temperature-dependent acoustic parameters. (C) Normalized temperature (relative to 37°C body temperature) plotted across the simulated focus assuming skull heating (red dashed line) compared to the focal volume with constant acoustic parameters (solid black line). (D) The evolution of the power absorption (W / cm3) measured at the focus for timepoints of 6, 12, 18, and 24 s, showing a decrease in absorption during skull heating.
In Vivo Rabbit Experiments to Determine the Effect of Brain Absorption, Perfusion Rates and Thermal Conductivity
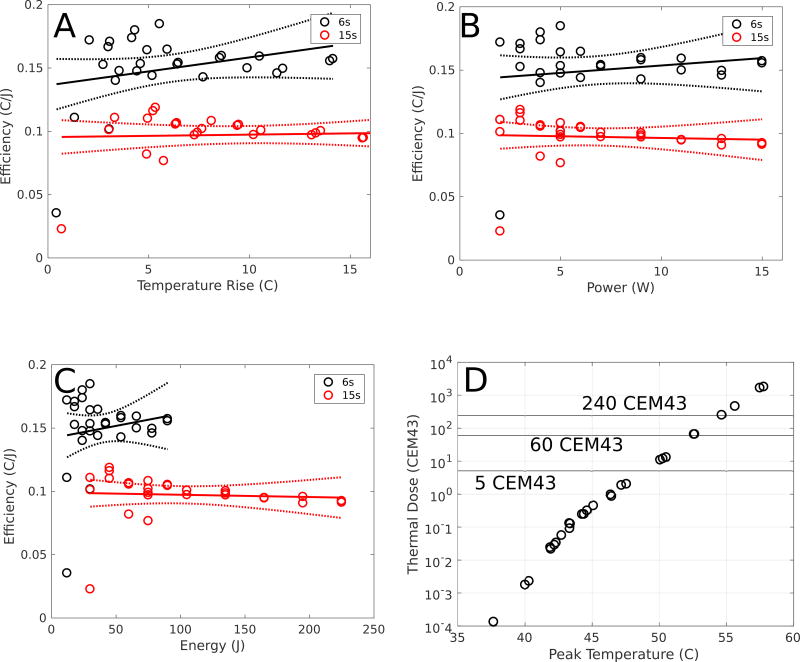
Although the Spearman correlation coefficient between acoustic power and efficiency was −0.40 (P = 0.04), there is only a 2.8% reduction in efficiency at 15 s between 2 and 15 W of applied acoustic power.
Figure 8 illustrates the efficiency recorded at 6 and 15 s timepoints for transducer powers ranging between 2–15 W. In this way, the effects of perfusion, thermal conduction, and absorption on treatment efficiency were analyzed. Although the Spearman correlation coefficient was −0.40 (P = 0.04), there is only a 2.8% reduction in efficiency at 15 s between 2 and 15 W of applied acoustic power. Since the duration was held fixed in each case, both the power- and energy-efficiencies are included in subfigures B and C. In both cases, the temperature rise is linear with power (or energy for a fixed duration). However, as a result of diffusion over longer duration heating, the energy-efficiency decreases between 6 and 15-s sonications.
Figure 8.
An analysis of the effects of blood perfusion, thermal conduction and absorption on the reduction in the energy-temperature efficiency during treatment using a rabbit model (N = 1 rabbits, N = 21 sonications). The 6-s (black) and 15-s (red) efficiency curves as functions of (A) temperature rise, (B) power, and (C) energy are shown, with the 95% confidence intervals shown in dashed lines. The Spearman cross correlation between power and efficiency on the difference between the 6- and 15-s sonications is −0.40 (p-value = 0.04), indicating that changes in perfusion, thermal conduction, and absorption play a role in reducing efficiency at higher powers, although it is not described by a linear fit (P = 0.29). There is only, however, a 2.8% reduction in efficiency at 15 s between 2 and 15 W of applied acoustic power, indicating that changes in perfusion, conduction and absorption play minimal roles in the reduced efficiency. Computing the Spearman cross correlation between temperature rise and efficiency on the difference between the 6- and 15-s sonications, it is found that there is no correlation (P = 0.11). In addition, (D) illustrates the peak temperatures and thermal dose achieved in each of the sonications at the 15-s timepoints (CEM43 = Cumulative Equivalent Minutes at 43C). The 5-, 60-, and 240-CEM43 values are also shown to demonstrate the thresholds for thermal damage, thermal necrosis in brain tissue, and thermal necrosis in all tissues, respectively. Note the logarithmic scale on the y-axis.
Transducer Array Power Experiments
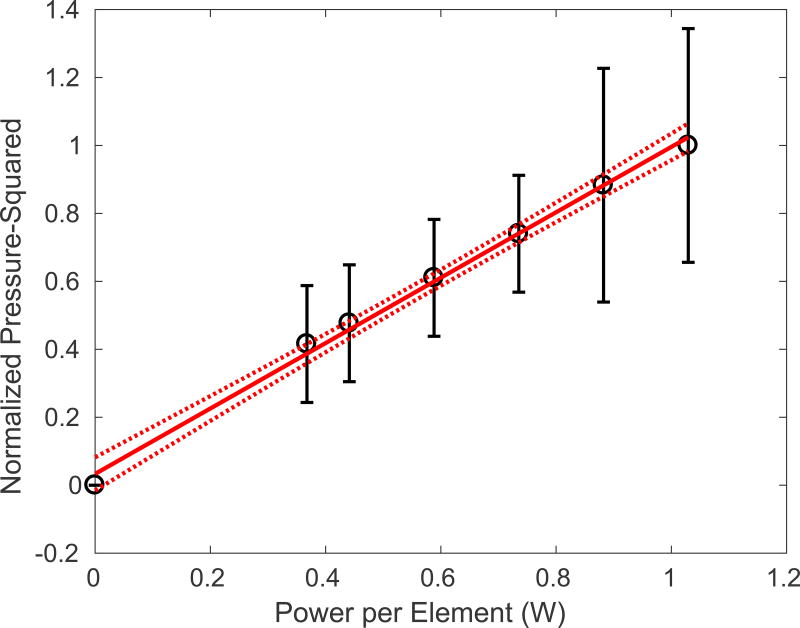
Figure 9 demonstrates the relationship between acoustic power emitted from each element in the array, and the pressure-squared. The linear fit corresponds well (R-squared = 0.996) and shows that the transducer acoustic response is linear with power.
Figure 9.
The transducer power experiments illustrating the linear pressure-squared rise with the applied power per element in the array (R2 = 0.996). The 95% confidence intervals of the linear fit are indicated by the dashed lines.
Discussion
With the ongoing development of transcranial FUS for the treatment of a range of diseases and disorders 4, 7, 9, 25, it is imperative to understand the relationship between the applied acoustic energy and the resultant temperature elevation during treatment. From the Pennes bioheat equation 12, one would expect a linear relationship between the applied acoustic power of the transducer array and the temperature rise at the focus in a FUS thermal treatment. Clinical data were presented here to illustrate the unexpected reduction in the energy-temperature efficiency at higher powers during MR-guided FUS thalamotomies for the treatment of ET. This reduction in efficiency was then correlated with the observed dispersion of the focus during treatment. This article presents clinical evidence of power-dependent focal dispersion, which builds upon previous studies into the focal quality during transcranial FUS 21, 26.
The natural suspicion when observing reduced energy-temperature efficiency is that there is an increase in the rate of perfusion at higher powers, due to a larger disparity between the focal temperature and the blood temperature, as predicted by the perfusion term in the Pennes bioheat equation 12. A previous study showed that ignoring blood perfusion in a transcranial model results in a 4% increase in the focal temperature elevation 20. The rabbit experiments presented here illustrate that perfusion effects causing a decrease in efficiency are minimal. However, the rabbit experiments were performed at 1.513 MHz using a single focused transducer, while the clinical treatments were performed at 670 kHz using a 1024-element hemispherical array. As a result of these geometric and frequency differences, the extrapolation of these results may be limited and would require further study.
Changes in tissue thermal conductivity could also explain the results presented here. By analyzing the temperature dependence of various tissues, Valvano et al. developed a linear fit describing this relationship 27. It was found that the conductivity increased by 0.3% per degree Celsius, so that in the present context, between 37 and 50°C, conductivity likely increased by 4%. This linear fit, however, did not cover near-coagulation-inducing temperature ranges of tissue and therefore may not fully describe the effects presented here.
It is infeasible, however, that as the power is increased, there is a decrease in the absorption in the tissue of the heated target volume leading to reduced energy-temperature efficiency. It is expected that the absorption should increase at higher acoustic powers due to the increase in absorption 28 and the reduced effect of perfusion once the thermal dose 29 at the target reaches coagulation. In addition, the positive correlation between peak temperature and change in efficiency presented in Table 1 would suggest that between patients, the higher the focal heating, the lower the observed reduction in energy-temperature efficiency. It would appear then that changes in focal absorption at higher powers would not be the cause of the phenomena observed here. These results suggest that changes in perfusion, thermal conductivity, and absorption are not substantial causes of the observed efficiency reduction at higher powers. Whether the treatment-related edema from heating has an effect, however, remains an open question.
A further explanation was that the skull and brain tissue along the beam paths could heat under sufficient power levels to cause acoustic parameters to change, and therefore cause the observed blurring (de-phasing) of the focus and reduction in the treatment efficiency. A number of previous studies have confirmed changes in the velocity and attenuation of ultrasound in water 30, bone marrow 31, and bone 23, among others, as a function of temperature. Although skull heating during FUS treatments is a well-documented ongoing concern 19, 32, 33, it would appear unlikely that brain tissue away from the focus would heat sufficiently to cause any changes in the acoustic parameters, as evidenced by tight transcranial acoustic focusing confirmed in previous studies 34.
The negative correlation between power and efficiency presented in Table 1 indicates that skull heating correlates negatively with efficiency since power exhibits a linear, positive relationship with skull heating. This would lead us to believe that the heating of the skull at higher acoustic powers is potentially causing additional acoustic aberrations, leading to focal spot expansion, thereby reducing the energy-temperature efficiency. In addition, the phase corrections through the skull are computed assuming constant acoustic parameters over time 14. If the rise in skull heating resulting from increased power causes changes in the ultrasound speed in the skull non-uniformly, then the focus would disperse, since the ability to target precisely would decrease. The energy-temperature efficiency would likewise decrease from this de-phasing. The dispersion of the foci presented here and reduction in energy-temperature efficiency is consistent with this hypothesis. Because previous studies have consistently found the speed of sound in bone to decrease at higher temperatures 23, 35 with the exception of water-filled bone 36, the phase distortion induced by the skull bone would change during the exposure depending on the local heating of the skull. If skull heating is the cause of the focal volume de-phasing and decrease in energy-temperature efficiency observed, then future work could analyze the relationship between temperature and acoustic properties, following previous studies 22. These results could then be used to develop time- and power-dependent phased array corrections that consider the changing acoustic parameters as a function of temperature for better focusing. Future transcranial therapies could rely on more sophisticated treatment planning software, so that the potential impact of skull heating on treatment efficiency could be pre-determined.
Finally, the acoustic efficiency of transducers using the clinical array sonicating into water was found to be constant between lower and higher acoustic powers, indicating non-significant transducer effects. The effect of registration between CT and MR images, however, was not analyzed.
The use of axial MR images to quantify the changes in the focal size as a function of applied power has notable limitations. Full analysis would require 3D volumetric MR imaging to quantify the total deposition of energy in the focal region. As described previously21, should an oblique focus manifest in the coronal or sagittal planes, the axial quantification of the focal volume would underestimate the true size of the focus. During analysis of some coronal images in the 19 patients included in this study, it was found that the focus was oblique to the main array axis. However, the focal obliquity manifested at both low and high power sonications. Since Figure 6 included only the percentage decrease in the focal size, it is possible that the measured change in the focal size would still be accurate should a 3D volumetric analysis be performed. Future work with a larger volume of coronal and sagittal images could confirm this hypothesis.
The effect of MR noise was suppressed in this study using a series of filters. The noise, however, played a noticeable role, particularly at lower power sonications, where the temperature rise was sometimes on the order of the observed noise in the image. Although the corrective methods were largely successful, some sonications needed to be excluded from analysis. Since the effect of noise was more of an issue at lower power sonications, the size of the foci in some of the lower power sonications could have been overestimated in this analysis. This, however, would not alter the conclusions of this study. Invasive in vivo and ex vivo experiments, however, would be required to determine more absolutely the true nature of the relationships between skull heating, temperature rise, and focal dispersion. Tissue heating resulting from FUS, causing geometric distortions in the MR temperature maps, could also contribute to the observed phenomena 37, and was not considered in this analysis.
Conclusions
The reduction in energy-temperature efficiency during high-power focused ultrasound thalamotomy for Essential Tremor correlated with increases in the size of the focal volume and is likely caused by transient and semi-permanent changes in the tissue and skull during heating. Further studies should be conducted to develop temperature-dependent compensation methods for improved treatment efficiency.
Supplementary Material
Acknowledgments
Funding was provided by NIH Grant R01-EB003268 and the Canada Research Chairs Program. The authors would like to thank Shawna Rideout-Gros and Viva Chan for assistance with the animal experiments and David Goertz and Simon Graham, both members of the Department of Medical Biophysics at the University of Toronto and Sunnybrook Research Institute, for helpful comments to improve this work.
Footnotes
Disclosure of Conflicts of Interest
There are no conflicts of interest to report.
The full list of sonications performed for the 19 patients analyzed in this study are included in Supplementary Materials: The imaging plane, acoustic power, duration, measured energy, peak temperature, and average temperatures are listed for each sonication. In addition, any sonication not included in the analysis (for any of the issues discussed in the Materials and Methods, such as aborted sonication or imaging problems) was marked with an asterisk.
References
- 1.Gateau J, Aubry JF, Chauvet D, Boch AL, Fink M, Tanter M. In vivo bubble nucleation probability in sheep brain tissue. Phys. Med. Biol. 2011;56(22):7001–7015. doi: 10.1088/0031-9155/56/22/001. [DOI] [PubMed] [Google Scholar]
- 2.Hynynen K, McDannold N, Clement G, et al. Pre-clinical testing of a phased array ultrasound system for MRI-guided noninvasive surgery of the brain--a primate study. Eur. J. Radiol. 2006;59(2):149–56. doi: 10.1016/j.ejrad.2006.04.007. [DOI] [PubMed] [Google Scholar]
- 3.Hynynen K, Jones RM. Image-guided ultrasound phased arrays are a disruptive technology for non-invasive therapy. Phys. Med. Biol. 2016;61(17):R206–R248. doi: 10.1088/0031-9155/61/17/R206. [DOI] [PMC free article] [PubMed] [Google Scholar]
- 4.McDannold N, Clement GT, Black P, Jolesz F, Hynynen K. Transcranial magnetic resonance imaging- guided focused ultrasound surgery of brain tumors: initial findings in 3 patients. Neurosurgery. 2010;66(2):323–32. doi: 10.1227/01.NEU.0000360379.95800.2F. [DOI] [PMC free article] [PubMed] [Google Scholar]
- 5.Jordão JF, Ayala-Grosso CA, Markham K, et al. Antibodies targeted to the brain with image-guided focused ultrasound reduces amyloid-β plaque load in the TgCRND8 mouse model of Alzheimer’s disease. PLoS One. 2010;5(5):4–11. doi: 10.1371/journal.pone.0010549. [DOI] [PMC free article] [PubMed] [Google Scholar]
- 6.Burgess A, Dubey S, Yeung S, et al. Alzheimer disease in a mouse model: MR imaging-guided focused ultrasound targeted to the1. In: Burgess A, Dubey S, Yeung S, et al., editors. Alzheimer disease in a mouse model: MR imaging-guided focused ultrasound targeted to the hippocampus opens the blood-brain barri. Radiology. 3. Vol. 273. 2014. pp. 736–45. [DOI] [PMC free article] [PubMed] [Google Scholar]
- 7.Jeanmonod D, Werner B, Morel A, et al. Transcranial magnetic resonance imaging-guided focused ultrasound: noninvasive central lateral thalamotomy for chronic neuropathic pain. Neurosurg. Focus. 2012;32(1):E1. doi: 10.3171/2011.10.FOCUS11248. [DOI] [PubMed] [Google Scholar]
- 8.Jung HH, Kim SJ, Roh D, et al. Bilateral thermal capsulotomy with MR-guided focused ultrasound for patients with treatment-refractory obsessive-compulsive disorder: a proof-of-concept study. Mol. Psychiatry. 2015;20(10):1205–1211. doi: 10.1038/mp.2014.154. [DOI] [PubMed] [Google Scholar]
- 9.Elias WJ, Lipsman N, Ondo WG, et al. A Randomized Trial of Focused Ultrasound Thalamotomy for Essential Tremor. N. Engl. J. Med. 2016;375(8):730–739. doi: 10.1056/NEJMoa1600159. [DOI] [PubMed] [Google Scholar]
- 10.Lipsman N, Schwartz ML, Huang Y, et al. MR-guided focused ultrasound thalamotomy for essential tremor: a proof-of-concept study. Lancet Neurol. 2013;12(5):462–8. doi: 10.1016/S1474-4422(13)70048-6. [DOI] [PubMed] [Google Scholar]
- 11.Elias WJ, Huss D, Voss T, et al. A pilot study of focused ultrasound thalamotomy for essential tremor. N. Engl. J. Med. 2013;369(7):640–8. doi: 10.1056/NEJMoa1300962. [DOI] [PubMed] [Google Scholar]
- 12.Pennes HH. Analysis of tissue and arterial blood temperatures in the resting forearm. J. Appl. Physiol. 1948;1(2):93–122. doi: 10.1152/jappl.1948.1.2.93. [DOI] [PubMed] [Google Scholar]
- 13.Billard BE, Hynynen K, Roemer RBR. Effects of physical parameters on high temperature ultrasound hyperthermia. Ultrasound Med. Biol. 1990;16(4):409–420. doi: 10.1016/0301-5629(90)90070-s. [DOI] [PubMed] [Google Scholar]
- 14.Clement GT, Hynynen K. A non-invasive method for focusing ultrasound through the human skull. Phys. Med. Biol. 2002;47(8):1219–36. doi: 10.1088/0031-9155/47/8/301. [DOI] [PubMed] [Google Scholar]
- 15.Aubry JF, Tanter M, Pernot M, Thomas JL, Fink M. Experimental demonstration of noninvasive transskull adaptive focusing based on prior computed tomography scans. J. Acoust. Soc. Am. 2003;113(1):84–93. doi: 10.1121/1.1529663. [DOI] [PubMed] [Google Scholar]
- 16.Marsac L, Chauvet D, La Greca R, et al. Ex vivo optimisation of a heterogeneous speed of sound model of the human skull for non-invasive transcranial focused ultrasound at 1 MHz. Int. J. Hyperth. 2017;33(6):635–645. doi: 10.1080/02656736.2017.1295322. [DOI] [PubMed] [Google Scholar]
- 17.Eames MD, Hananel A, Snell JW, Kassell NF, Aubry J-F. Trans-cranial focused ultrasound without hair shaving: feasibility study in an ex vivo cadaver model. J. Ther. ultrasound. 2013;1(1):24. doi: 10.1186/2050-5736-1-24. [DOI] [PMC free article] [PubMed] [Google Scholar]
- 18.Eames MDC, Farnum M, Khaled M, et al. Head phantoms for transcranial focused ultrasound. Med. Phys. 2015;42(4):1518–1527. doi: 10.1118/1.4907959. [DOI] [PubMed] [Google Scholar]
- 19.Connor CW, Hynynen K. Patterns of thermal deposition in the skull during transcranial focused ultrasound surgery. IEEE Trans. Biomed. Eng. 2004;51(10):1693–706. doi: 10.1109/TBME.2004.831516. [DOI] [PubMed] [Google Scholar]
- 20.Pulkkinen A, Werner B, Martin E, Hynynen K. Numerical simulations of clinical focused ultrasound functional neurosurgery. Phys. Med. Biol. 2014;59(7):1679–1700. doi: 10.1088/0031-9155/59/7/1679. [DOI] [PMC free article] [PubMed] [Google Scholar]
- 21.Hughes A, Huang Y, Pulkkinen A, Schwartz ML, Lozano AM, Hynynen K. A numerical study on the oblique focus in MR-guided transcranial focused ultrasound. Phys. Med. Biol. 2016;61(22):8025–8043. doi: 10.1088/0031-9155/61/22/8025. [DOI] [PMC free article] [PubMed] [Google Scholar]
- 22.Pichardo S, Sin VW, Hynynen K. Multi-frequency characterization of the speed of sound and attenuation coefficient for longitudinal transmission of freshly excised human skulls. Phys. Med. Biol. 2011;56(1):219–50. doi: 10.1088/0031-9155/56/1/014. [DOI] [PMC free article] [PubMed] [Google Scholar]
- 23.Nicholson PHF, Bouxsein ML. Effect of temperature on ultrasonic properties of the calcaneus in situ. Osteoporos. Int. 2002;13(11):888–892. doi: 10.1007/s001980200122. [DOI] [PubMed] [Google Scholar]
- 24.Song J, Pulkkinen A, Huang Y, Hynynen K. Investigation of Standing-Wave Formation in a Human Skull for a Clinical Prototype of a Large-Aperture, Transcranial MR-Guided Focused Ultrasound (MRgFUS) Phased Array: An Experimental and Simulation Study. IEEE Trans. Biomed. Eng. 2012;59(2):435–444. doi: 10.1109/TBME.2011.2174057. [DOI] [PMC free article] [PubMed] [Google Scholar]
- 25.Jung HH, Chang WS, Rachmilevitch I, Tlusty T, Zadicario E, Chang JW. Different magnetic resonance imaging patterns after transcranial magnetic resonance-guided focused ultrasound of the ventral intermediate nucleus of the thalamus and anterior limb of the internal capsule in patients with essential tremor or obsessive-comp. J. Neurosurg. 2015;122(1):162–168. doi: 10.3171/2014.8.JNS132603. [DOI] [PubMed] [Google Scholar]
- 26.Chauvet D, Marsac L, Pernot M, et al. Targeting accuracy of transcranial magnetic resonance–guided high-intensity focused ultrasound brain therapy: a fresh cadaver model. J. Neurosurg. 2013 May;118:1046–1052. doi: 10.3171/2013.1.JNS12559. [DOI] [PubMed] [Google Scholar]
- 27.Valvano JW, Cochran JR, Diller KR. Thermal conductivity and diffusivity of biomaterials measured with self-heated thermistors. Int. J. Thermophys. 1985;6(3):301–311. [Google Scholar]
- 28.Pulkkinen A, Hynynen K. Computational aspects in high intensity ultrasonic surgery planning. Comput. Med. Imaging Graph. 2010;34(1):69–78. doi: 10.1016/j.compmedimag.2009.08.001. [DOI] [PubMed] [Google Scholar]
- 29.Sapareto SAS, Dewey WCWWC. Thermal dose determination in cancer therapy. J. Radiat. Oncol. Biol. Phys. 1984;10(6):787–800. doi: 10.1016/0360-3016(84)90379-1. [DOI] [PubMed] [Google Scholar]
- 30.Wilson WD. Speed of Sound in Distilled Water as a Function of Temperature and Pressure. J. Acoust. Soc. Am. 1959;31(8):1067–1072. [Google Scholar]
- 31.El-Sariti AA, Evans JA, Truscott JG. The temperature dependence of the speed of sound in bovine bone marrow at 750 kHz. Ultrasound Med. Biol. 2006;32(6):985–989. doi: 10.1016/j.ultrasmedbio.2006.02.1412. [DOI] [PubMed] [Google Scholar]
- 32.McDannold NJ, King RL, Hynynen K. MRI monitoring of heating produced by ultrasound absorption in the skull: in vivo study in pigs. Magn. Reson. Med. 2004;1065:1061–1065. doi: 10.1002/mrm.20043. (December 2003) [DOI] [PubMed] [Google Scholar]
- 33.Schwartz ML, Yeung R, Huang Y, et al. Skull bone marrow injury caused by MR-guided focused ultrasound (MRgFUS) for cerebral functional procedures. Submitted. 2017:11. doi: 10.3171/2017.11.JNS17968. [DOI] [PubMed] [Google Scholar]
- 34.McDannold N, Park EJ, Mei CS, Zadicario E, Jolesz F. Evaluation of three-dimensional temperature distributions produced by a low-frequency transcranial focused ultrasound system within ex vivo human skulls. IEEE Trans. Ultrason. Ferroelectr. Freq. Control. 2010;57(9):1967–1976. doi: 10.1109/TUFFC.2010.1644. [DOI] [PMC free article] [PubMed] [Google Scholar]
- 35.Mccarthy RN. Ultrasound Speed in Equine Cortical Bone : Effects of Orientation, Density, Porosity and Temperature. J. Biomech. 1990 May;:1139–1143. doi: 10.1016/0021-9290(90)90006-o. [DOI] [PubMed] [Google Scholar]
- 36.Wear KA. Temperature dependence of ultrasonic attenuation in human calcaneus. Ultrasound Med. Biol. 2000;26(3):469–472. doi: 10.1016/s0301-5629(99)00135-0. [DOI] [PMC free article] [PubMed] [Google Scholar]
- 37.Gaur P, Partanen A, Werner B, et al. Correcting heat-induced chemical shift distortions in proton resonance frequency-shift thermometry. Magn. Reson. Med. 2015 May;0:1–11. doi: 10.1002/mrm.25899. [DOI] [PMC free article] [PubMed] [Google Scholar]
Associated Data
This section collects any data citations, data availability statements, or supplementary materials included in this article.


