Abstract
Purpose:
We sought to determine the significant genomic alterations in patients with metastatic breast cancer (MBC), and survival outcomes in common genotypes.
Patients and Methods:
High-depth next generation sequencing was performed for 202 genes in tumor and normal DNA from 257 patients with MBC, including 165 patients with ER/PR+ HER2- (hormone receptor positive, HR+ positive), 32 patients with HER2+ and 60 patients with triple negative (ER/PR/HER2-) cancer. Kaplan Meier survival analysis was performed in our discovery set, in breast cancer patients analyzed in The Cancer Genome Atlas, and in a separate cohort of 98 patients with MBC who underwent clinical genomic testing.
Results:
Significantly mutated genes (SMGs) varied by histology and tumor subtype, but TP53 was a SMG in all three subtypes. The most SMGs in HR+ patients included PIK3CA (32%), TP53 (29%), GATA3 (15%), CDH1 (8%), MAP3K1 (8%), PTEN (5%), TGFBR2 (4%), AKT1 (4%), and MAP2K4 (4%). TP53 mutations were associated with shorter recurrence-free survival (P=0.004), progression-free survival (P=0.00057) and overall survival (P=0.003). Further, TP53 status was prognostic among HR+ patients with PIK3CA mutations. TP53 mutations were also associated with poorer overall survival in the 442 HR+ breast cancer patients in the TCGA (P=0.042) and in an independent set of 96 HR+ MBC who underwent clinical sequencing (P=0.0004).
Conclusions:
SMGs differ by tumor subtype but TP53 is significantly mutated in all three breast cancer subtypes. TP53 mutations are associated with poor prognosis in HR+ breast cancer. TP53 mutations should be considered in the design and interpretation of precision oncology trials.
INTRODUCTION
There is growing interest in genomic profiling for cancer therapy. Data is emerging that targeting some of these alterations, such as AKT and HER2 mutations, indeed may have antitumor efficacy.1,2 Most proof-of-principle genomically-selected trials are conducted in the metastatic setting, while many molecular characterization efforts such as The Cancer Genome Atlas (TCGA) were performed in operable breast cancer.3 In order to effectively design and interpret genotype-selected trials, it is critical to determine the genomic profile of patients with metastatic breast cancer (MBC), the frequency of genomic alterations as well as co-alterations, and to determine the impact of common alterations on prognosis.
We determined the genomic profile of patients with MBC in a prospective study. We report the significantly altered genes in different breast cancer subtypes. Further, we report the effect of common genotypes on prognosis in HR+ breast cancer. We validated the prognostic role of TP53 mutations in two additional HR+ cohorts.
PATIENTS AND METHODS
Patient Selection and Enrolment
257 patients with MBC and adequate amount of archival tumor tissue underwent next generation sequencing (NGS) on an Institutional Review Board-approved prospective protocol for genomic profiling (NCT01772771). An additional cohort of 98 HR+ patients with MBC who underwent clinical genomic testing were identified as a validation cohort; patients had undergone testing on Foundation One (Foundation Medicine), Ion AmpliSeq Comprehensive Cancer Panel (ThermoFisher) or Oncomine Panel (ThermoFisher). These clinical records were reviewed with an IRB approved study with waiver of consent.
GENOMIC ANALYSIS
Samples were evaluated by hematoxylin and eosin staining, and macro-dissected. DNA was extracted using QIAamp DNA FFPE Micro Kit (Qiagen) and quantified by Qubit (Invitrogen). NGS of 202 genes (T200 platform; Supplementary Table 1) was performed on tumor and normal DNA as previously described.4 Assays were performed blinded to the clinical outcomes. Reporting was done consistent with REMARK guidelines.5 Molecular inversion probe arrays were performed as previously described.6,7
ESR1 mutation status was tested using Bio-Rad QX200 ddPCR, with primers to assess 4 ESR1 mutations: Y537C (1980A>G), Y537N (1979T>A), Y537S (1980A>C) and D538G (1983A>G) (Supplementary Table 2). Positive and negative controls were included in each run. Samples were run in triplicate, with WT and mutant ESR1 controls. Quantitative analysis was performed using QuantaSoft software (Bio-Rad).
BIOINFORMATICS ANALYSIS
Comprehensive methods for bioinformatic analysis has been previously published.4 For copy number calls, high amplification and high deletion was defined as an estimated copy number of 5 and 0.6 on NGS analysis and 5 and 1 on MIP analysis. Alterations potentially targetable with approved or investigational therapeutics directly or indirectly (e.g. inhibiting downstream signaling) were considered “actionable”. The “actionable genes” are designated by asterisks in Supplementary Table 1. The therapeutic implications of these actionable genes are listed in Supplementary Table 2.
Statistical Analysis
Categorical variables were summarized in frequency tables. Mutation rates were compared to that observed in TCGA. DISCOVER, a statistical test for detecting co-occurrence and mutual exclusivity in cancer genomics data was used.8 Unlike traditional approaches such as Fisher’s exact test, DISCOVER is based on a null model that takes into account the overall tumor-specific alteration rates when deciding whether alterations co-occur more or less often than expected by chance. Multiple testing was adjusted using false discovery rate (FDR).
Recurrence-free survival (RFS) was calculated from the date of initial breast cancer diagnosis to the date of first local or distant relapse, death or last follow-up. Progression free survival was calculated from the date of treatment start in the metastatic setting to date of treatment end due to progression. Overall survival was calculated from date of MBC diagnosis.
RESULTS
Somatic Alterations
Two hundred and sixty eight samples from 257 patients were sequenced (Table 1). Distribution by tumor subtype was as follows: 165 patients (64.2%) with ER/PR+ HER2- breast cancer (hormone receptor positive, HR+ positive); 60 with triple negative breast cancer (TNBC), and 32 patients with HER2 + breast cancer (24 ER+/PR+ HER2+ and 8 ER/PR- HER2+). Forty-eight patients (18.7%) had Stage IV disease at presentation.
Table 1.
Patient and Tumor Characteristics
| Characteristics | ||
|---|---|---|
| Median age (range) | 54 (28–80) | Overall number (%) |
| Race | White | 192 (74.7%) |
| Black | 26 (10.1%) | |
| Asian | 7 (2.7%) | |
| Other | 32 (12.5%) | |
| Tumor Stage at Diagnosis | Stage 0–2 | 141 (54.9%) |
| Stage 3 | 67 (26.1%) | |
| Stage 4 | 48 (18.7%) | |
| Tumor Subtype | HR+/HER2− | 165 (64.2%) |
| HR+/HER2+ | 24 (9.3%) | |
| HR−/HER2+ | 8 (3.1%) | |
| TNBC | 60 (23.3) | |
|
Recurrence-Free Survival for Overall Group (for patients who were not Stage IV at diagnosis) | ||
| Median RFS (month) |
pts # with RFS ≤12 months |
|
| HR+ (n=165) | 38.37 | 24 (14.5%) |
| HER2+ (n=32) | 21.33 | 8 (25%) |
| TNBC (n=60) | 12.75 | 23 (38.3%) |
|
Sample Sequenced (total 268 samples from 257 patients) | ||
| Overall number (%) | ||
| Primary 191 (71.3%) | Therapy-naive | 120 (44.7%) |
| Post-neoadjuvant chemotherapy | 67 (25%) | |
| Post-neoadjuvant Endocrine therapy |
4(1.4%) | |
| Local-Regional recurrence | 8 (3.0%) | |
| Distant Metastases | 69 (25.7%) | |
| Soft tissue | 24 (9.0%) | |
| Bone | 8 (3.0%) | |
| Liver | 13 (4.9%) | |
| Lung | 7 (2.6%) | |
| Other | 17 (6.3%) | |
|
Patients with both primary and recurrence/metastasis (n=11) |
Primary and recurrence | 1 (0.4%) |
| Primary and metastasis | 10 (3.9%) | |
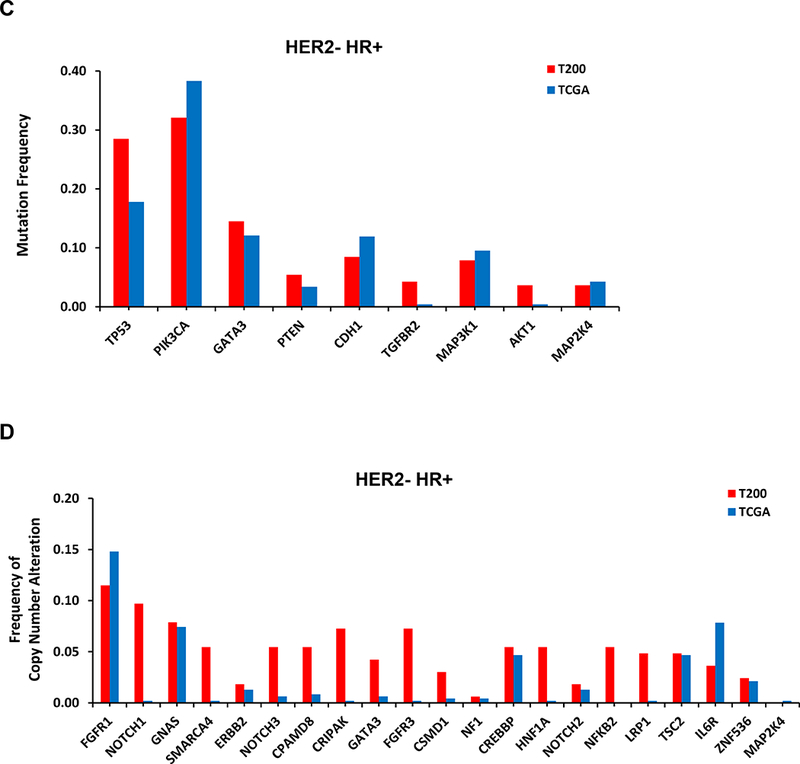
Heat map of the top 50 mutated genes and 50 copy number-altered genes are shown in Supplementary Figures 1 and 2. Significantly mutated genes (SMGs) varied with histology and tumor subtype (Table 2). TP53 was a SMG in all subtypes, but was more frequently mutated in HR- negative tumors. SMGs in HR+ patients included PIK3CA (32%), TP53 (29%), GATA3 (15%), CDH1 (8%), MAP3K1 (8%), PTEN (5%), TGFBR2 (4%), AKT1 (4%), and MAP2K4 (4%).
Table 2.
Significantly Mutated Genes by Tumor Subtype*
| Overall (257) |
Invasive Ductal Carcinoma (221) |
Invasive Lobular Carcinoma (19) |
HER2−/HR+ (165) |
TNBC (60) |
HER2+/HR+ (24) |
HER2+/HR− (8) |
||||||||
|---|---|---|---|---|---|---|---|---|---|---|---|---|---|---|
| P Value | % | P Value | % | P Value | % | P Value | % | P Value | % | P Value | % | P Value | % | |
| TP53 | 168.22 | 0.412 | 159.7 | 0.439 | 0.45 | 0.105 | 64.97 | 0.285 | 75.47 | 0.7 | 19.34 | 0.458 | 11.7 | 0.75 |
| PIK3CA | 54.79 | 0.245 | 44.46 | 0.231 | 6.87 | 0.474 | 51.22 | 0.321 | 0.25 | 0.0667 | 4.49 | 0.208 | 0.88 | 0.125 |
| GATA3 | 20.88 | 0.0973 | 21.85 | 0.109 | 0.1 | 0.0526 | 23.74 | 0.145 | 0 | 0 | 0.5 | 0.0417 | 0 | 0 |
| PTEN | 6.51 | 0.0467 | 4.44 | 0.0407 | 0.1 | 0.0526 | 5.22 | 0.0545 | 0.02 | 0.0167 | 0.5 | 0.0417 | 0.88 | 0.125 |
| CDH1 | 4.54 | 0.0545 | 0 | 0.0136 | 8.68 | 0.526 | 6.62 | 0.0848 | 0 | 0 | 0 | 0 | 0 | 0 |
| TGFBR2 | 2.53 | 0.035 | 1.8 | 0.0317 | 0.32 | 0.105 | 2.35 | 0.0424 | 0.02 | 0.0167 | 0.49 | 0.0417 | 0 | 0 |
| MAP3K1 | 2.17 | 0.0545 | 2.45 | 0.0588 | 0 | 0 | 3.36 | 0.0788 | 0 | 0 | 0 | 0 | 0.87 | 0.125 |
| AKT1 | 1.78 | 0.0272 | 1.64 | 0.0271 | 0.1 | 0.0526 | 2.08 | 0.0364 | 0 | 0 | 0.5 | 0.0417 | 0 | 0 |
| MAP2K4 | 1.53 | 0.0233 | 1.88 | 0.0271 | 0 | 0 | 2.39 | 0.0364 | 0 | 0 | 0 | 0 | 0 | 0 |
| RUNX1 | 1.19 | 0.0233 | 1.64 | 0.0271 | 0 | 0 | 1.32 | 0.0303 | 0 | 0 | 0.5 | 0.0417 | 0 | 0 |
The number represent –log10 (P Value) from a Poisson test of non-synonymous mutation rate in targeted regions against a random distribution. Genes in red significant at P<0.01 (2 or higher).
The most significantly copy number altered (CNA) genes on targeted exome sequencing are demonstrated in Table 3. In TNBC there was gain of NOTCH2, SMARCA4, GATA3 and loss of NF1. In, HR+ HER2- breast cancer there was significant gain of FGFR1, GNAS, SMARCA4, CPAMD8, CREBBP, FGFR3, HNF1A, LRP1, NFKB2, and loss of CSMD1. We also assessed CNAs with molecular inversion probes (MIP) in 32 samples from 29 patients, selecting patients with at least one CNA on NGS. Of the 36 amplifications detected by NGS, 22 were confirmed by MIP arrays (Supplementary Table 4), including four of four patients tested with FGFR1 amplification, five of five patients with GNAS amplification, three of four patients with SMARCA4 amplification, and four of four patients with NOTCH2 amplifications. Of 11 deletions detected by NGS, nine were confirmed by MIP arrays including three of three with NF1 and three of three patients with PTEN deletions.
Table 3.
Significantly Copy Number Altered Genes by Tumor Subtype*
|
Overall (257) |
Invasive Ductal Carcinoma (221) |
Invasive Lobular Carcinoma (19) |
HER2-/HR+ (165) |
TNBC (60) |
HER2+/HR+ (24) |
HER2+/HR- (8) |
||||||||
|---|---|---|---|---|---|---|---|---|---|---|---|---|---|---|
| P Value | % | P Value | % | P Value | % | P Value | % | P Value | % | P Value | % | P Value | % | |
| FGFR1 | 13.30/−0.59 | 0.101 | 11.99/−0.62 | 0.104 | 0.53 | 0.0526 | 11.68/−0.80 | 0.115 | 1.35 | 0.0667 | 1.67 | 0.125 | 0 | 0 |
| NOTCH1 | −1.79/9.29 | 0.0856 | 7.13/−1.73 | 0.0814 | 2.13 | 0.211 | −1.23/6.33 | 0.097 | −0.99/1.85 | 0.0667 | 0.56 | 0 | 0.94 | 0.25 |
| GNAS | 6.35 | 0.0739 | 6.52 | 0.0814 | 0.00 | 0 | 4.82 | 0.0788 | 0.43 | 0.05 | 1.67 | 0.125 | 0.41 | 0 |
| SMARCA4 | 5.14 | 0.0623 | 4.60 | 0.0633 | 0.92 | 0.105 | 2.49 | 0.0545 | 2.55 | 0.0833 | 0.00 | 0 | 0.94 | 0.25 |
| ERBB2 | 5.14 | 0.0584 | 5.88 | 0.0679 | 0.00 | 0 | 0.14 | 0.0182 | 0.00 | 0 | 8.89 | 0.333 | 2.29 | 0.5 |
| NOTCH3 | 4.10 | 0.0545 | 2.80 | 0.0498 | 0.92 | 0.105 | 2.49 | 0.0545 | 0.90 | 0.0333 | 0.00 | 0 | 1.05 | 0.375 |
| CPAMD8 | 4.10 | 0.0545 | 2.29 | 0.0452 | 1.57 | 0.158 | 2.49 | 0.0545 | 0.90 | 0.0333 | 0.00 | 0 | 1.05 | 0.375 |
| CRIPAK | −1.00/4.10 | 0.0623 | −1.08/3.38 | 0.0633 | 0.92 | 0.105 | −0.80/4.25 | 0.0727 | 0.25/−0.99 | 0.0333 | 0.00 | 0 | 0.94 | 0.25 |
| GATA3 | 4.10 | 0.0584 | 4.60 | 0.0679 | 0.00 | 0 | 1.35 | 0.0424 | 3.36 | 0.117 | 0.56 | 0.0417 | 0 | 0 |
| FGFR3 | −1.00/4.10 | 0.0623 | −1.08/3.38 | 0.0633 | 0.92 | 0.105 | −0.80/4.25 | 0.0727 | −0.99/0.25 | 0.0333 | 0.00 | 0 | 0.94 | 0.25 |
| CSMD1 | −3.75/0.00 | 0.0233 | −3.94/0.01 | 0.0271 | 0.00 | 0 | 0.04/−3.22 | 0.0303 | 0.00 | 0 | 0.00 | 0 | −1.97 | 0.125 |
| NF1 | −3.75 | 0.0156 | −3.94 | 0.0181 | 0.00 | 0 | −1.23 | 0.00606 | −2.60 | 0.05 | 0.00 | 0 | 0 | 0 |
| CREBBP | 3.51 | 0.0467 | 1.84 | 0.0362 | 2.13 | 0.211 | 3.57 | 0.0545 | 0.25 | 0.0167 | 0.00 | 0 | 0.94 | 0.25 |
| HNF1A | 2.95 | 0.0467 | 1.84 | 0.0407 | 1.57 | 0.158 | 3.02 | 0.0545 | 0.25 | 0.0167 | 0.00 | 0 | 0.94 | 0.25 |
| NOTCH2 | 2.50 | 0.0428 | 1.84 | 0.0452 | 0.53 | 0.0526 | 0.14 | 0.0182 | 5.19 | 0.133 | 0.00 | 0 | 0 | 0 |
| NFKB2 | 2.50 | 0.0428 | 1.51 | 0.0362 | 1.57 | 0.158 | 3.02 | 0.0545 | 0.00 | 0 | 0.00 | 0 | 0.94 | 0.25 |
| LRP1 | 2.50 | 0.0428 | 2.29 | 0.0452 | 0.53 | 0.0526 | 2.49 | 0.0485 | 0.00 | 0 | 0.56 | 0.0417 | 0.94 | 0.25 |
| TSC2 | 2.50 | 0.0389 | 1.51 | 0.0317 | 1.57 | 0.158 | 3.02 | 0.0485 | 0.00 | 0 | 0.00 | 0 | 0.94 | 0.25 |
| IL6R | 2.02 | 0.0428 | 1.51 | 0.0407 | 0.53 | 0.0526 | 0.98 | 0.0364 | 1.85 | 0.0833 | 0.00 | 0 | 0 | 0 |
| ZNF536 | 2.02 | 0.0428 | 1.51 | 0.0407 | 0.53 | 0.0526 | 0.33 | 0.0242 | 1.35 | 0.0667 | 0.00 | 0 | 1.05 | 0.375 |
| MAP2K4 | −0.59 | 0.00389 | −0.62 | 0.00452 | 0.00 | 0 | 0.00 | 0 | 0.00 | 0 | −2.27 | 0.0417 | 0 | 0 |
The number represent –log10 (P Value) from a Poisson test of copy number alteration rate in targeted regions against a random distribution. Genes 2 or more are significant at P<0.01. #negative value represents copy number losses. #positive value represents copy number gains
Alterations in Actionable Genes
Overall 244 patients (94.9%) had an alteration in at least one potentially actionable gene 9. Notably, mutations differ in their functional consequences, thus not all mutations may be actionable.9,10 Further a genomic profile may not be considered actionable due to co-alterations or other patient variables. Actionable alterations included well recognized alterations such as PIK3CA mutations (24%) and FGFR amplifications (10%) as well as less frequent but clinically compelling alterations such as AKT1 mutations (3%) and HER2 mutations (3%). In addition, there were potentially actionable rarer alterations such as an inactivating mutation in PTCH1, an activating mutation in IDH1 or high level amplification of EGFR. Notably 117 patients (72%) with alterations in an actionable gene had a co-alteration in another potentially actionable gene.
We have previously reported that most BRCA1/2 alterations in breast cancer are germline.11,12 However, we observed potentially deleterious somatic alterations in DNA damage repair genes, BRCA1/2, PALB2, ATM and RAD51. Further, we observed alterations in several genes associated with the SWI/SNF complex or other epigenetic processes including BAP1, ARID1A, DNMT3A and EP300.
Genomic Alterations in Primary and Recurrent/Metastatic Tumors
Genomic alterations in 191 primary vs 77 recurrent/metastatic tumors were compared (Supplementary Table 5); there were no significant differences by Fisher’s exact analysis. There were also no differences based on site of metastases. We had matched primary vs recurrent/metastatic samples from only 11 patients (10 with metastasis and 1 loco-regional recurrence). All 10 patients who had somatic mutations had additional alterations in their recurrent/metastatic sample not detected in the primary tumor (Supplementary Figure 3). Of the HR+ primary tumors, 78 were chemotherapy-naïve, 39 were post-neoadjuvant chemotherapy and 43 were metastatic samples. There were no differences between these cohorts.
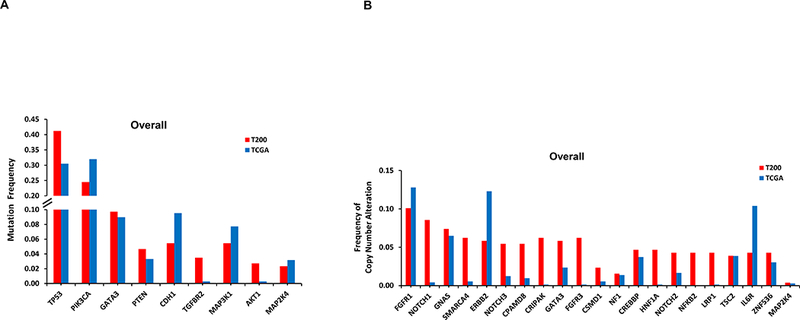
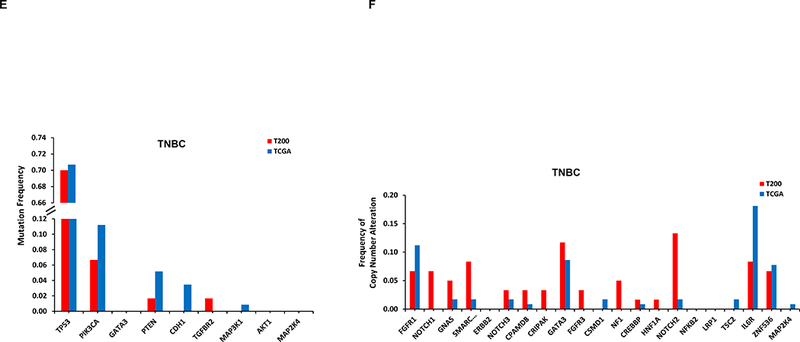
We compared the alterations seen in our study with that in the breast TCGA cohort (Supplementary Table 6 and 7). The most common alterations in our series are shown in Figure 1. Our MBC cohort was enriched for some alterations such as TP53 mutations, compared to the TCGA series.
Figure 1. Frequency of the most common alterations in our cohort (T200) versus TCGA.
By NGS, 251 of 257 patients had ESR1 sequencing, however, unfortunately only 151 patients had adequate coverage of ESR1. Of these, 114 were HR+ and only 26 were distant metastasis samples. Only one tumor (4%) had an ESR1 mutation. This was from a patient with HR+ breast cancer, who had received letrozole in the metastatic setting. Two other HR+ patients whose primary tumors did not show an ESR1 mutation in our study, subsequently had NGS testing on a new distant metastatic lesion not included in our analysis, and this uncovered ESR1 mutations.
As a 4% ESR1 mutation rate in MBC is lower than what we and others have reported 13,14, we also used digital drop PCR (ddPCR) for 4 hot spot mutations (ESR1-Y537S, Y537C, Y537N and D538G) in 49 patients with DNA from metastatic tumor samples.13,14 Thirty-eight patients had endocrine therapy prior to the biopsy of the metastasis; 31 in the adjuvant setting and 7 for recurrent disease. Three (6.1%) patients were found to have an ESR1 mutation. Two of these patients also had T200 sequencing; and one was found to have the same ESR1 mutation (ESR1-D538G), while the other, although the same DNA was used, did not have the mutation detected, suggesting that ddPCR may be more sensitive for detection. One patient had four lines of endocrine therapy in the metastatic setting while the other had adjuvant tamoxifen.
Genomic Profile and Prognosis in HR+ Breast cancer
Heatmap and bar plot of the top 50 most commonly altered genes in HR+ breast cancer are shown in Figure 2. We tested for the co-occurrence between the top 50 altered genes in HR+ breast cancer using the DISCOVER algorithm. The p-values and q-values for all the gene pairs are listed in Supplementary Table 8. With a FDR 0.1, we found co-alterations in FGFR3 and CRIPAK, which are co-localized on chromosome 4; co-alterations in CPAMD8, SMARCA4, and NOTCH3, which are co-localized on chromosome 19, and co-alterations in CREBBP and TSC2, which are co-localized on chromosome 16. We tested for mutual exclusivity between the top 50 altered genes in HR+ breast cancer (Supplementary Table 9). With an FDR 0.1, GATA3 alterations were mutually exclusive with TP53 alterations.
Figure 2: Heatmap and barplot of the alterations in the top 50 most commonly altered genes from HR+ patients.

The samples are presented in the order with most common alterations on the left.
In precision oncology trials, treatment is often given to patients with selected alterations, thus we assessed effect of common genomic alterations on PFS in HR+ patients. Of common alterations, the most prominent prognostic effect was attributable to TP53. TP53 mutations were significantly more common in patients with RFS 24 months or shorter by Fisher’s Exact test (p=0.0025). TP53 mutations were associated with a shorter RFS by Kaplan-Meier analysis (p=0.003; Figure 3A). The types and locations of TP53 mutations seen in HR+ patients are depicted in Supplementary Figure 4. Patients with missense TP53 mutations had longer RFS than other types of TP53 mutations, but this difference did not reach statistical significance (p=0.055; Figure 3B).
Figure 3: Kaplan-Meier Survival Analysis for HR+ patients by TP53 Genotype.
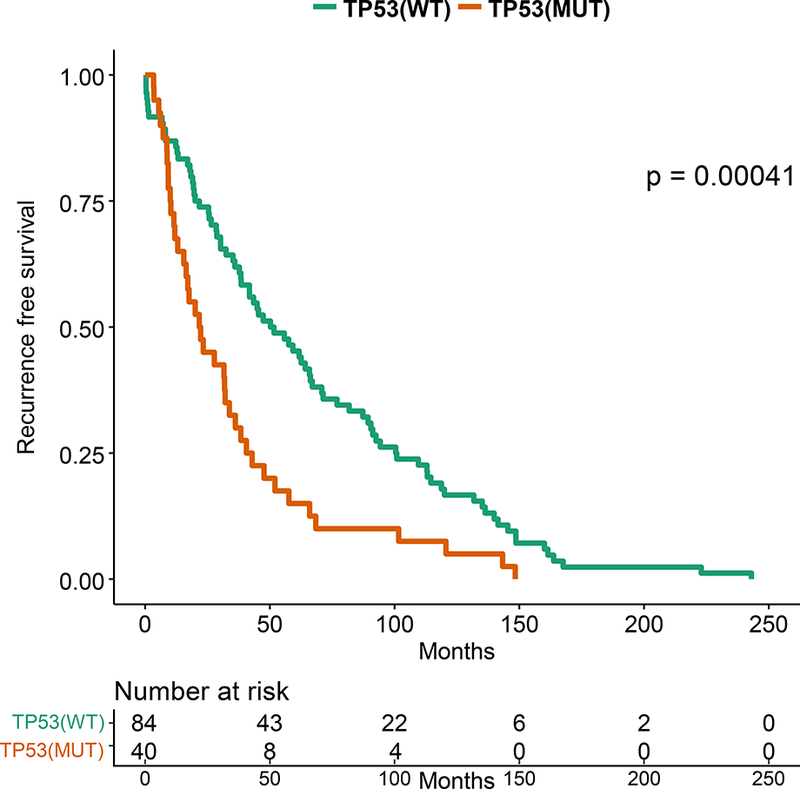
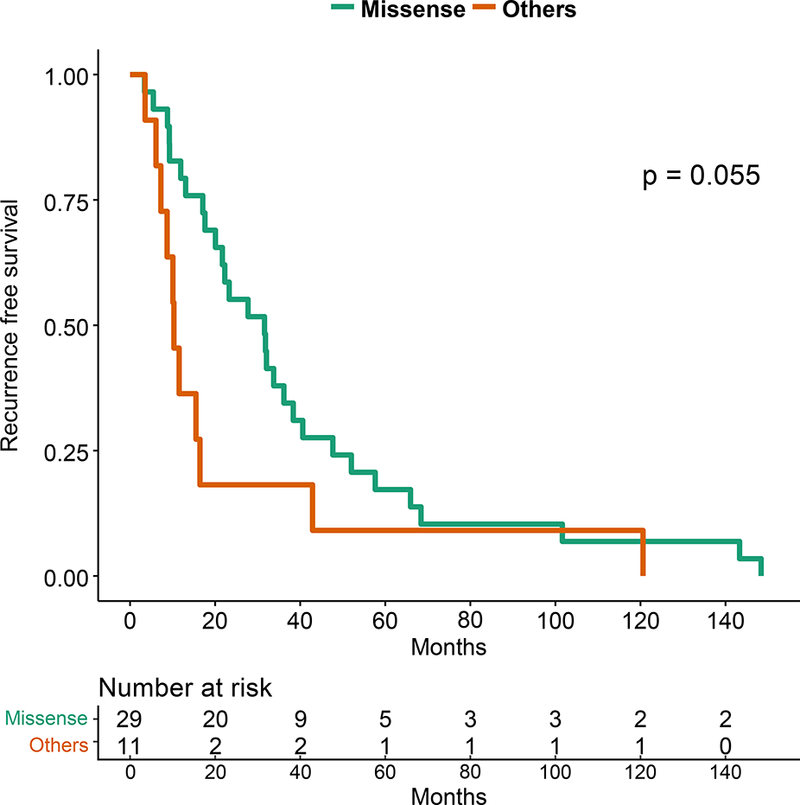
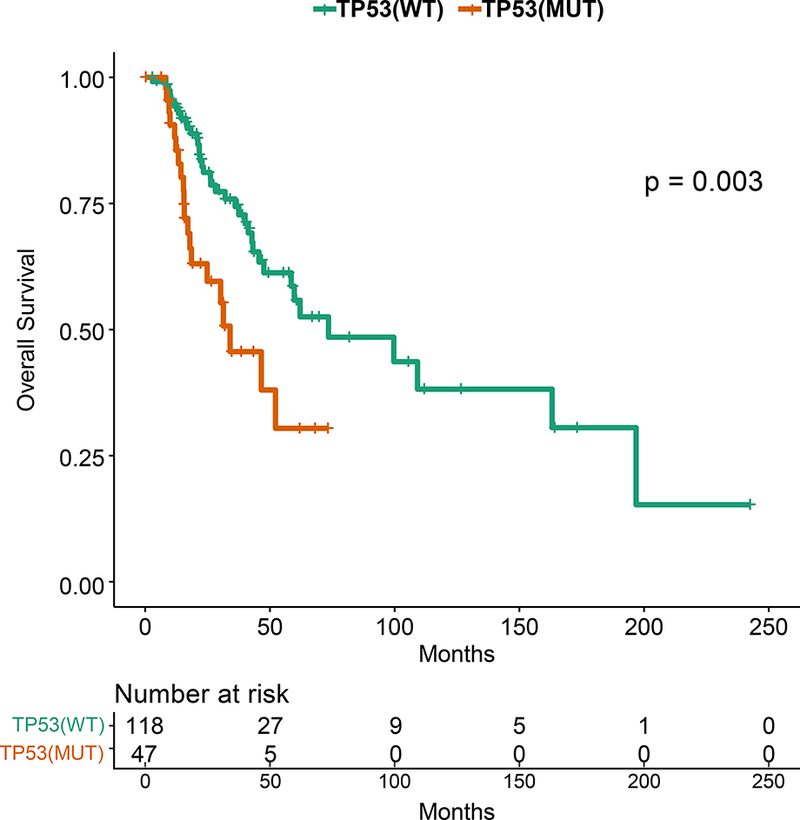
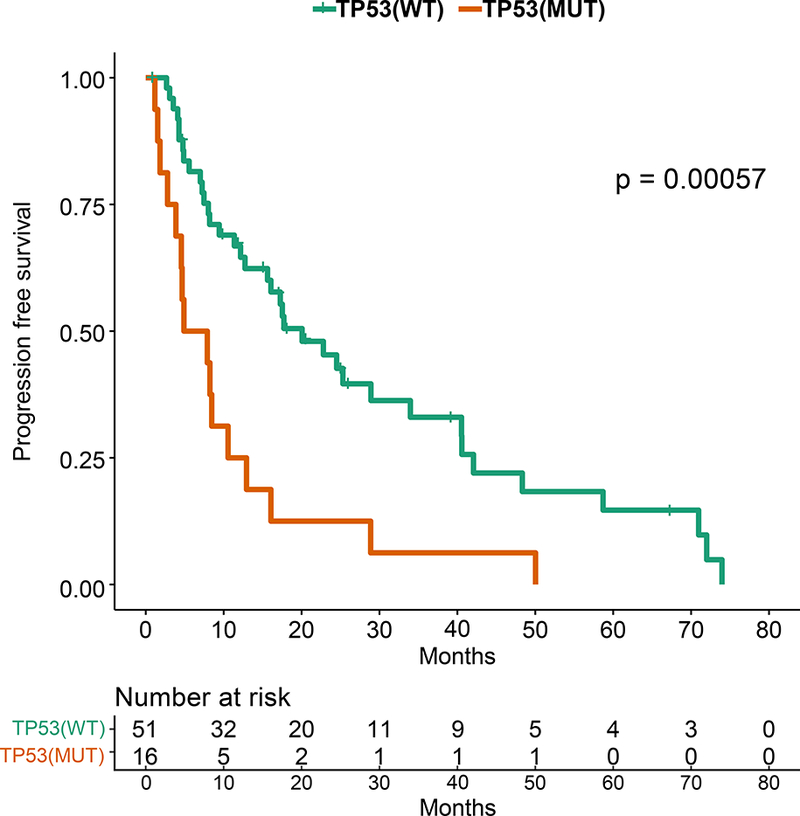
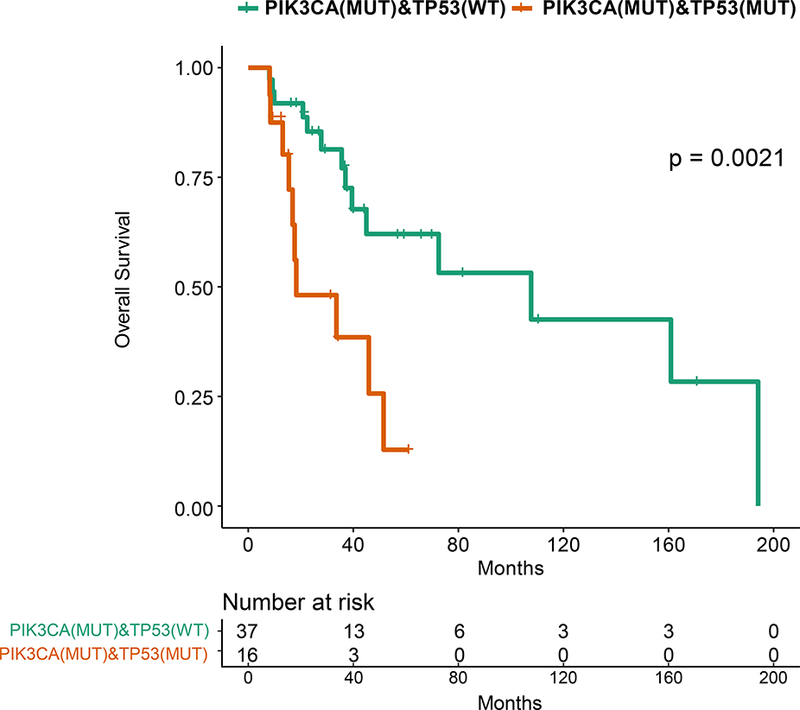
A. Recurrence-free survival for the HR+ patients. B. Recurrence-free survival for HR+ MBC patients with TP53 mutations by TP53 mutation type (missense vs other). C. Overall survival for the HR+ patients by TP53 mutation status. D. Progression-free survival on first line endocrine therapy for the HR+ patients. E. Overall survival for patients with HR+ PIK3CA mutant MBC by TP53 mutation status. F. Progression-free survival for patients with HR+ PIK3CA mutant MBC by TP53 mutation status.
TP53 mutations were associated with a shorter overall survival in HR+ patients (p=0.003; Figure 3C). TP53 mutations were not associated with survival in TNBC or HER2+ patients, however these cohorts were smaller in size. TP53 mutations were associated with a significantly shorter PFS in HR+ patients who received any first-line metastatic therapy (median 4.57 vs 16.07 months, p=0.0001, data not shown), as well as in patients who received endocrine therapy only (median 6.4 vs 20.1 months, p=0.00057; Figure 3D). TP53 mutation type (missense vs other) was not associated with OS or PFS on first line endocrine therapy.
When patients with PIK3CA mutations/amplification, with AKT1 mutation/amplification, with PTEN mutation/deletion, FGFR1/3 amplifications, GATA3 mutations or MAP3K1/MAP2K4 mutation or deletion were compared to patients lacking these alterations, there was no significant difference in PFS in the first line metastatic setting on any therapy (Supplementary Figure 5), as well as those treated with endocrine therapy (Supplementary Figure 6). TP53 mutations were also associated with decreased PFS and OS among HR+ patients with PIK3CA mutations as well (p=0.0008 and p=0.002, respectively; Figure 3E and 3F).
We sought to validate the prognostic role of TP53. First, we evaluated the 442 patients with HR+ breast cancer in the TCGA. TP53 mutations were associated with a decreased recurrence-free survival (p=0.042; Figure 4A), with a hazard ratio of 2.02 (TP53 mutant vs not, 95% CI=0.9967–4.095). We next evaluated overall survival in an independent 96 patients with HR+ MBC who underwent clinical genomic testing and had endocrine therapy as first line therapy. Patients with TP53 mutations had a significantly shorter survival (median survival 56 months vs 145 months, p=0.0004; Figure 4B).
Figure 4: Kaplan-Meier Survival Analysis for HR+ patients by TP53 Genotype in Validation Cohorts.
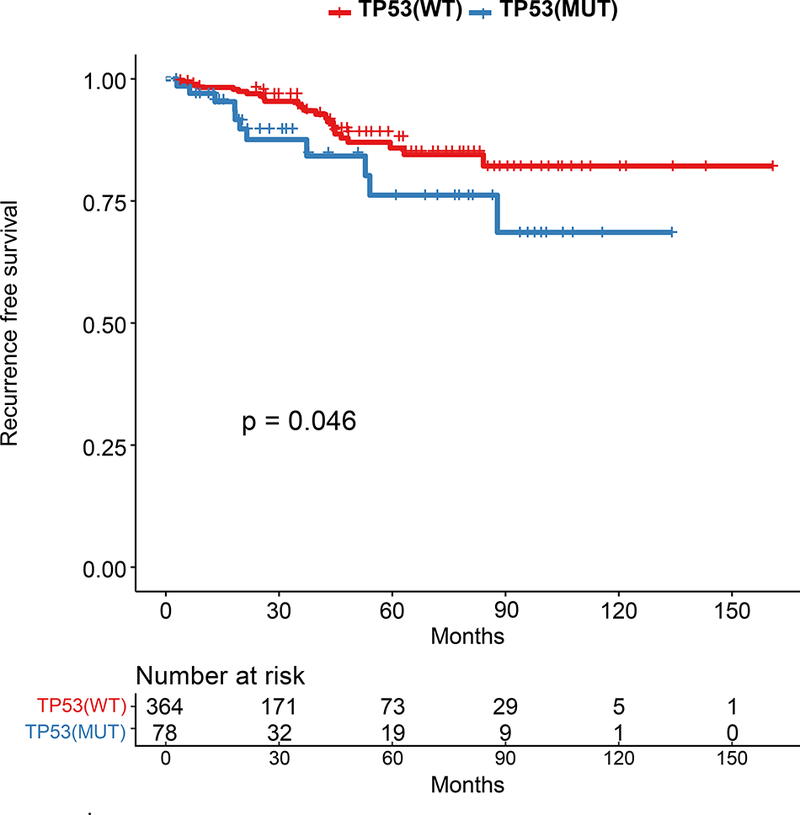
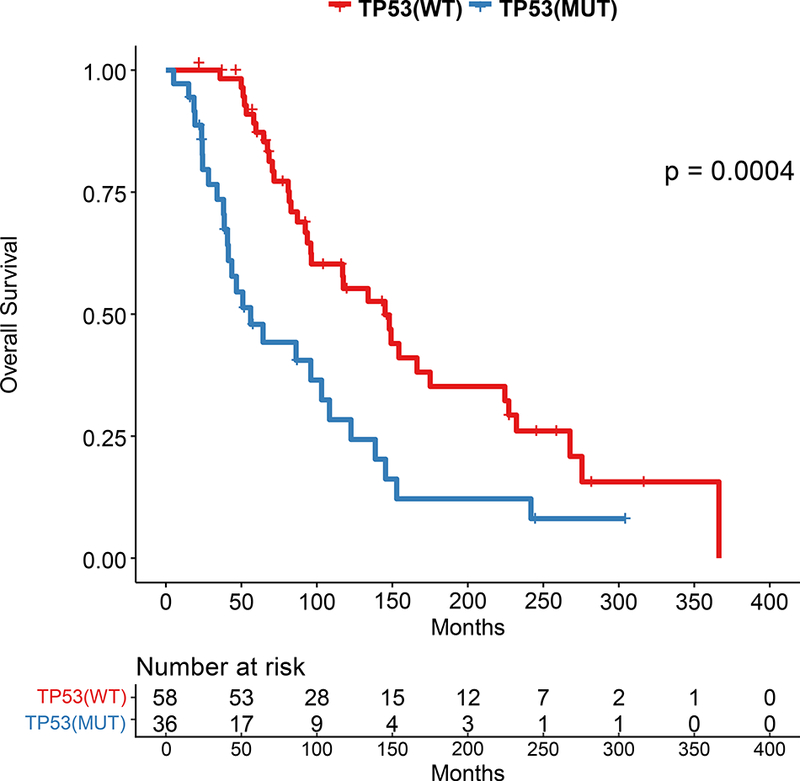
A.Recurrence-Free Survival in TCGA by TP53 mutation status. B. Overall survival in independent cohort of 98 HR+ patients with MBC by TP53 mutation status.
DISCUSSION
TP53 was a SMG in all breast cancer subtypes, but mutations were more frequent in HR-negative tumors. TP53 mutations were seen in 41% of patients in our patients with MBC compared to 30% in the TCGA, which represents earlier stage patients (Figure 1), with higher rates of TP53 mutations in HR+ breast cancer as well (29% vs 18%). TP53 mutations are already known to be a harbinger of poor prognosis in breast cancer.15–18 There have also been reports that type and position of mutations may effect cancer outcomes19; this requires further study. Given the effect of TP53 on prognosis, in genotype-selected trials stratifying for TP53 may be considered. In our study, patients with TP53 mutations had a shorter OS. Further, HR+ patients with TP53 mutations treated on endocrine therapy in the first line metastatic setting had a significantly shorter PFS. Notably, when Ellis et al. compared aromatase-inhibitor-sensitive versus aromatase-inhibitor-resistant tumors in the neoadjuvant setting, (NCT00265759),20 the TP53 signaling was enriched in resistant tumors (38% of the aromatase-inhibitor-resistant and 17% in sensitive group). The authors concluded that HR+ tumors with TP53 mutations are mostly aromatase inhibitor resistant, and would be more appropriately treated with other modalities. However, we do not yet know if other regimens would be more effective for these tumors, or whether TP53 mutations would equally confer resistance to other agents. However, there are now also emerging therapeutics targeting mutant p53.21,22 There is an urgent need for novel therapies for TP53 mutant tumors.
In our study, patients had a variety of genomic alterations. Alterations in the PI3K pathway including PIK3CA, PTEN, and AKT1 mutations are already well recognized. The frequency of alterations in this pathway may differ based on patient population (tumor subtype and histology and other variables) as well as assay and bioinformatics pipeline. In most breast cancer series this is the most frequently altered potentially actionable pathway, thus these alterations are actively being pursued in trials with PI3K/AKT/ mTOR inhibitors.2,23,24 CDH1 mutations, as expected, were almost exclusively found in invasive lobular carcinoma. CDH1 loss is pathognomonic for lobular carcinomas; the fact that we found CDH1 mutations in only 56% of patients suggests that CDH1 loss may also be mediated through non-genomic mechanisms. Mutations in MAP3K1 and MAP2K4 have been already reported in HR+ breast cancer.20 Ellis et al. reported a frequency of 15.5% for MAP3K1 and MAP2K4 in estrogen receptor-positive breast cancer 20. Inactivating mutations in MAP3K1 and MAP2K4 are predicted to abrogate signaling pathways that activate JUN kinases. Therapeutic implications of these alterations have not been well elucidated.
GATA3 mutations are commonly noted in HR+ breast cancer. Ellis et al found that GATA3 mutations were enriched in HR+ tumors exhibiting greater neoadjuvant aromatase inhibitor sensitivity in at least one studied cohort.20 This finding, although preliminary, suggests GATA3 mutation may be a positive predictive marker for aromatase inhibitor response, In our HR+ patients, those with GATA3 mutations trended to have an improved OS but this difference was not statistically significant (p=0.07). The prognostic and predictive value of GATA3 needs to be further evaluated.
Although our NGS platform was primarily designed to analyze commonly mutated genes in cancer, it has the ability to provide copy number information.4 Indeed, we identified common CNAs such as gain in FGFR1 and HER2. We have recently reported that when NGS demonstrates high level amplification, we are able to validate CNAs on an orthogonal platform such as FISH.25 NGS-based detection of CNAs is limited to high level losses or gains; thus, we may have underestimated the frequency of copy number changes. However, several of these CNAs such as NOTCH alterations and NF1 loss have therapeutic implications, and need further study.
Admittedly, we had too few matched primary and recurrence samples to systematically study genomic evolution in this series. Many patients had primary tumors available but not metastatic samples available for profiling. In a recent study, we reported that in 33 matched primary and recurrent tumors, 97 of 112 (87%) somatic mutations were concordant.26 More recently, Lefebvre et al reported the genomic profiling results of patients who underwent a biopsy of MBC in the context of the SAFIR01, SAFIR02, SHIVA, or Molecular Screening for Cancer Treatment Optimization (MOSCATO) prospective trials.27 There was significant overlap between SMG observed in their study and ours. However, in their study, eight genes (ESR1, FSIP2, FRAS1, OSBPL3, EDC4, PALB2, IGFN1, and AGRN) were more frequently mutated in MBC as compared to early breast cancer profiles in TCGA, suggesting that systematic assessment of metastatic tissue in MBC may lead to identification of additional genomic alterations.
Our study had some additional limitations. Our patients were under active treatment for MBC, representing differing subtypes and having received a variety of treatments. There could have been a selection bias in patients chosen for testing. We may not have captured molecular profiles of patients who rapidly progressed on therapy and succumbed to their disease, or alternately those who responded very well were not perceived as needing molecular characterization. Further, we performed a NGS of a predefined panel of genes. This had the advantage of depth to detect subclonal as well as clonal events, but limited our ability to discover novel genomic alterations. Further, our panel did not include MDM2/MDM4, two genes that could be amplified to negatively regulate TP53 axis in patients with WT TP53.
In conclusion, genomic profiling has identified multiple potentially actionable alterations. PIK3CA/TP53 and GATA3 mutation are the most common alterations in HR+ MBC and TP53 was prognostic in three different HR+ cohorts. Prognostic impact of genotypes should be considered in the design of precision oncology trials. As NGS becomes more commonly used clinically, TP53 may be considered as a stratification factor in future randomized trials given the significant impact on outcome. Further study is needed to determine the role of genomic classification on sensitivity toendocrine therapy given in conjunction with CDK4/6 inhibitors and emerging agents (eg PI3K pathway inhibitors), in adjuvant endocrine therapy and new endocrine combinations, as well as to determine optimal novel therapies that can therapeutically leverage TP53 mutations.
Supplementary Material
Heatmap of the mutations for the top 50 frequently mutated genes.
Heatmap of the copy number alterations for the top 50 frequently copy number altered genes.
Heatmap of alterations in tumors from 11 patients with matched primary and metastasis/recurrence.
Mutation type and location of TP53 mutations detected in patients with HR+ breast cancer.
Progression free survival in the first line metastatic setting among patients with HR+ breast cancer. A. Patients with PIK3CA mutations/amplifications, with AKT1 mutations/amplifications, with PTEN mutation/deletion vs those without these alterations, B, Patients with FGFR1/3 amplifications vs those without these alterations, C. Patients with GATA3 mutations vs those without these alterations, D. Patients with MAP3K1/MAP2K4 mutation or deletions compared to patients lacking these alterations.
Progression free survival on endocrine therapy in the first line metastatic setting among patients with HR+ breast cancer. A. Patients with PIK3CA mutations/amplifications, with AKT1 mutations/amplifications, with PTEN mutation/deletion vs those without these alterations, B, Patients with FGFR1/3 amplifications vs those without these alterations, C. Patients with GATA3 mutations vs those without these alterations, D. Patients with MAP3K1/MAP2K4 mutation or deletions compared to patients lacking these alterations.
202 genes sequenced by Targeted Exome Sequencing. The “actionable genes” are designated by asterisks.
Therapeutic implications of actionable genes found on T200.
ddPCR assay sequences for tissue assessment of ESR1 mutation status.
Number of amplification/deletion in NGS and MIP array.
Frequency of genomic alterations in primary tumors vs metastases/recurrences.
Frequency of mutations by tumor subtype in our cohort and in TCGA.
Frequency of copy number alterations by tumor subtype in our cohort and in TCGA.
Co-alterations in the 50 most commonly mutated genes.
Mutual exclusivity in the 50 most commonly mutated genes.
ACKNOWLEDGEMENT
We thank Kristin Hargraves and the Khalifa Institute for Personalized Cancer Therapy clinical research team for assistance with data curation, and Kurt Evans for technical assistance.
Research Support: This work was supported by the Sheikh Khalifa Al Nahyan Ben Zayed Institute for Personalized Cancer Therapy, Astra Zeneca Foundation Grant; NCI U01 CA180964, NCATS grant UL1 TR000371 (Center for Clinical and Translational Sciences), the Nellie B. Connally Breast Cancer Research Endowment, Cancer Prevention Research Institute of Texas (CPRIT) Precision Oncology Decision Support Core RP150535, the Bosarge Foundation, and the MD Anderson Cancer Center Support grant (P30 CA016672).
REFERENCES
- 1.Hyman D, Piha-Paul S, Rodón J, et al. : Abstract PD5–05: Neratinib for ERBB2 mutant, HER2 non-amplified, metastatic breast cancer: Preliminary analysis from a multicenter, open-label, multi-histology phase II basket trial. Cancer Research 76:PD5-05–PD5-05, 2016 [Google Scholar]
- 2.Hyman DM, Smyth LM, Donoghue MTA, et al. : AKT Inhibition in Solid Tumors With AKT1 Mutations. J Clin Oncol 35:2251–2259, 2017 [DOI] [PMC free article] [PubMed] [Google Scholar]
- 3.Cancer Genome Atlas N: Comprehensive molecular portraits of human breast tumours. Nature 490:61–70, 2012 [DOI] [PMC free article] [PubMed] [Google Scholar]
- 4.Chen K, Meric-Bernstam F, Zhao H, et al. : Clinical actionability enhanced through deep targeted sequencing of solid tumors. Clin Chem 61:544–53, 2015 [DOI] [PMC free article] [PubMed] [Google Scholar]
- 5.McShane LM, Altman DG, Sauerbrei W, et al. : REporting recommendations for tumour MARKer prognostic studies (REMARK). Br J Cancer 93:387–91, 2005 [DOI] [PMC free article] [PubMed] [Google Scholar]
- 6.Singh RR, Mehrotra M, Chen H, et al. : Comprehensive Screening of Gene Copy Number Aberrations in Formalin-Fixed, Paraffin-Embedded Solid Tumors Using Molecular Inversion Probe-Based Single-Nucleotide Polymorphism Array. J Mol Diagn 18:676–87, 2016 [DOI] [PubMed] [Google Scholar]
- 7.Chen H, Singh RR, Lu X, et al. : Genome-wide copy number aberrations and HER2 and FGFR1 alterations in primary breast cancer by molecular inversion probe microarray. Oncotarget 8:10845–10857, 2017 [DOI] [PMC free article] [PubMed] [Google Scholar]
- 8.Canisius S, Martens JW, Wessels LF: A novel independence test for somatic alterations in cancer shows that biology drives mutual exclusivity but chance explains most co-occurrence. Genome Biol 17:261, 2016 [DOI] [PMC free article] [PubMed] [Google Scholar]
- 9.Meric-Bernstam F, Johnson A, Holla V, et al. : A decision support framework for genomically informed investigational cancer therapy. J Natl Cancer Inst 107, 2015. [DOI] [PMC free article] [PubMed] [Google Scholar]
- 10.Johnson A, Khotskaya YB, Brusco L, et al. : Clinical Use of Precision Oncology Decision Support. JCO Precision Oncology:1–12, 2017 [DOI] [PMC free article] [PubMed] [Google Scholar]
- 11.Gonzalez-Angulo AM, Timms KM, Liu S, et al. : Incidence and outcome of BRCA mutations in unselected patients with triple receptor-negative breast cancer. Clin Cancer Res 17:1082–9, 2011 [DOI] [PMC free article] [PubMed] [Google Scholar]
- 12.Meric-Bernstam F, Brusco L, Daniels M, et al. : Incidental germline variants in 1000 advanced cancers on a prospective somatic genomic profiling protocol. Ann Oncol 27:795–800, 2016 [DOI] [PMC free article] [PubMed] [Google Scholar]
- 13.Jeselsohn R, Yelensky R, Buchwalter G, et al. : Emergence of constitutively active estrogen receptor-alpha mutations in pretreated advanced estrogen receptor-positive breast cancer. Clin Cancer Res 20:1757–67, 2014 [DOI] [PMC free article] [PubMed] [Google Scholar]
- 14.Schiavon G, Hrebien S, Garcia-Murillas I, et al. : Analysis of ESR1 mutation in circulating tumor DNA demonstrates evolution during therapy for metastatic breast cancer. Sci Transl Med 7:313–182, 2015 [DOI] [PMC free article] [PubMed] [Google Scholar]
- 15.Basho RK, de Melo Gagliato D, Ueno NT, et al. : Clinical outcomes based on multigene profiling in metastatic breast cancer patients. Oncotarget 7:76362–76373, 2016 [DOI] [PMC free article] [PubMed] [Google Scholar]
- 16.Dobes P, Podhorec J, Coufal O, et al. : Influence of mutation type on prognostic and predictive values of TP53 status in primary breast cancer patients. Oncol Rep 32:1695–702, 2014 [DOI] [PubMed] [Google Scholar]
- 17.Eikesdal HP, Knappskog S, Aas T, et al. : TP53 status predicts long-term survival in locally advanced breast cancer after primary chemotherapy. Acta Oncol 53:1347–55, 2014 [DOI] [PMC free article] [PubMed] [Google Scholar]
- 18.Silwal-Pandit L, Vollan HK, Chin SF, et al. : TP53 mutation spectrum in breast cancer is subtype specific and has distinct prognostic relevance. Clin Cancer Res 20:3569–80, 2014 [DOI] [PubMed] [Google Scholar]
- 19.Petitjean A, Achatz MI, Borresen-Dale AL, et al. : TP53 mutations in human cancers: functional selection and impact on cancer prognosis and outcomes. Oncogene 26:2157–65, 2007 [DOI] [PubMed] [Google Scholar]
- 20.Ellis MJ, Ding L, Shen D, et al. : Whole-genome analysis informs breast cancer response to aromatase inhibition. Nature 486:353–60, 2012 [DOI] [PMC free article] [PubMed] [Google Scholar]
- 21.Bauer MR, Joerger AC, Fersht AR: 2-Sulfonylpyrimidines: Mild alkylating agents with anticancer activity toward p53-compromised cells. Proc Natl Acad Sci U S A 113:E5271–80, 2016 [DOI] [PMC free article] [PubMed] [Google Scholar]
- 22.Synnott NC, Murray A, McGowan PM, et al. : Mutant p53: a novel target for the treatment of patients with triple-negative breast cancer? Int J Cancer 140:234–246, 2017 [DOI] [PubMed] [Google Scholar]
- 23.Kim SB, Dent R, Im SA, et al. : Ipatasertib plus paclitaxel versus placebo plus paclitaxel as first-line therapy for metastatic triple-negative breast cancer (LOTUS): a multicentre, randomised, double-blind, placebo-controlled, phase 2 trial. Lancet Oncol 18:1360–1372, 2017 [DOI] [PMC free article] [PubMed] [Google Scholar]
- 24.Baselga J, Im SA, Iwata H, et al. : Buparlisib plus fulvestrant versus placebo plus fulvestrant in postmenopausal, hormone receptor-positive, HER2-negative, advanced breast cancer (BELLE-2): a randomised, double-blind, placebo-controlled, phase 3 trial. Lancet Oncol 18:904–916, 2017 [DOI] [PMC free article] [PubMed] [Google Scholar]
- 25.Arango NP, Brusco L, Shaw KRM, et al. : A feasibility study of returning clinically actionable somatic genomic alterations identified in a research laboratory. Oncotarget, 2017 [DOI] [PMC free article] [PubMed] [Google Scholar]
- 26.Meric-Bernstam F, Frampton GM, Ferrer-Lozano J, et al. : Concordance of genomic alterations between primary and recurrent breast cancer. Mol Cancer Ther 13:1382–9, 2014 [DOI] [PMC free article] [PubMed] [Google Scholar]
- 27.Lefebvre C, Bachelot T, Filleron T, et al. : Mutational Profile of Metastatic Breast Cancers: A Retrospective Analysis. PLoS Med 13:e1002201, 2016 [DOI] [PMC free article] [PubMed] [Google Scholar]
Associated Data
This section collects any data citations, data availability statements, or supplementary materials included in this article.
Supplementary Materials
Heatmap of the mutations for the top 50 frequently mutated genes.
Heatmap of the copy number alterations for the top 50 frequently copy number altered genes.
Heatmap of alterations in tumors from 11 patients with matched primary and metastasis/recurrence.
Mutation type and location of TP53 mutations detected in patients with HR+ breast cancer.
Progression free survival in the first line metastatic setting among patients with HR+ breast cancer. A. Patients with PIK3CA mutations/amplifications, with AKT1 mutations/amplifications, with PTEN mutation/deletion vs those without these alterations, B, Patients with FGFR1/3 amplifications vs those without these alterations, C. Patients with GATA3 mutations vs those without these alterations, D. Patients with MAP3K1/MAP2K4 mutation or deletions compared to patients lacking these alterations.
Progression free survival on endocrine therapy in the first line metastatic setting among patients with HR+ breast cancer. A. Patients with PIK3CA mutations/amplifications, with AKT1 mutations/amplifications, with PTEN mutation/deletion vs those without these alterations, B, Patients with FGFR1/3 amplifications vs those without these alterations, C. Patients with GATA3 mutations vs those without these alterations, D. Patients with MAP3K1/MAP2K4 mutation or deletions compared to patients lacking these alterations.
202 genes sequenced by Targeted Exome Sequencing. The “actionable genes” are designated by asterisks.
Therapeutic implications of actionable genes found on T200.
ddPCR assay sequences for tissue assessment of ESR1 mutation status.
Number of amplification/deletion in NGS and MIP array.
Frequency of genomic alterations in primary tumors vs metastases/recurrences.
Frequency of mutations by tumor subtype in our cohort and in TCGA.
Frequency of copy number alterations by tumor subtype in our cohort and in TCGA.
Co-alterations in the 50 most commonly mutated genes.
Mutual exclusivity in the 50 most commonly mutated genes.


