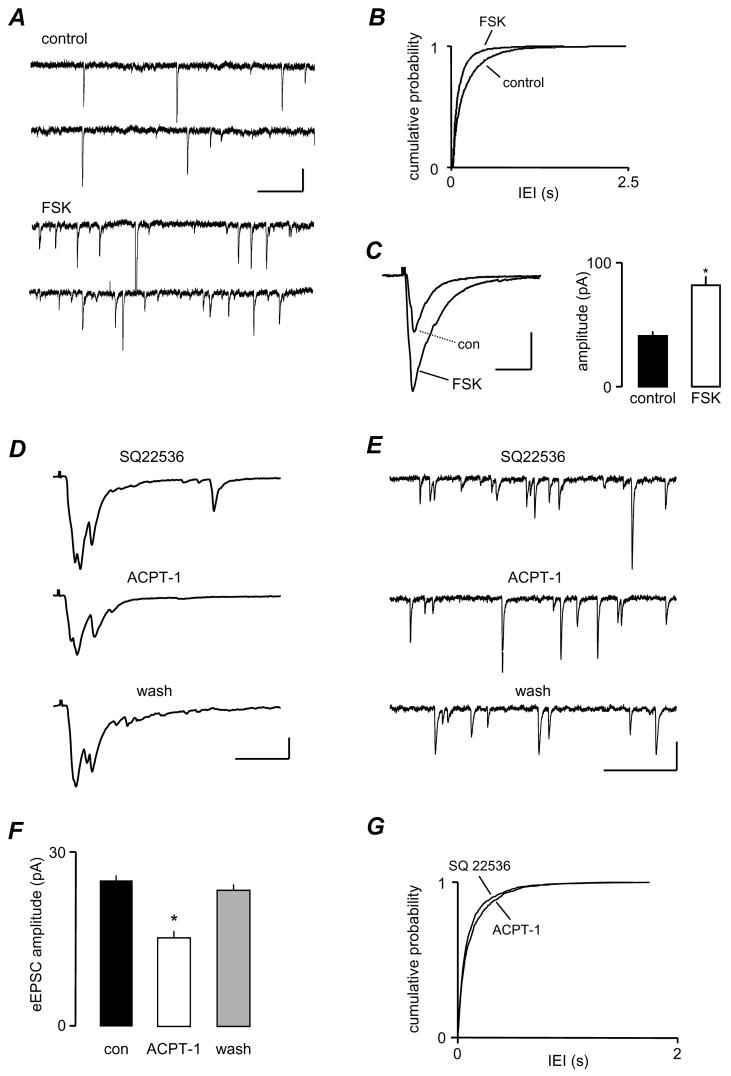
Figure 4.
The depression of eEPSC amplitude by ACPT-1 is not mediated by PKA. A. sEPSCs recorded before and during application of forskolin (FSK, 20 μM) showing a clear increase in frequency. B. This is confirmed by the cumulative probability analysis for pooled sEPSCs from 7 neurones. C. Averaged eEPSC responses (n=10) from the same cell as in A, showing that forskolin clearly increases eEPSC amplitude, and this is clearly shown by the pooled amplitude data in the bar chart, from the same 7 neurones as in B. C. Individual eEPSCs recorded in the presence of the specific AC inhibitor SQ22536 (50 μM) alone, and with the subsequent addition of ACPT-1 (20 μM). The agonist induced a similar depression of the eEPSC amplitude to that seen without the AC inhibitor. E. sEPSCs recorded from the same neurone as in D showing the lack of effect of ACPT-1 on spontaneous release during inhibition of AC. F. The bar graph summarises changes in eEPSC amplitude with ACPT-1 during application of SQ22536 to 7 neurones. G The cumulative probability plot shows pooled data for IEI in 7 neurones. Scale bars represent 10 pA and 60 ms in A, 60 pA, 20 ms in C and D, and 20 pA, 20 ms in E.

