

Abstract
There is ample evidence that humans are able to control the endpoint impedance of their arms in response to active destabilizing force fields. However, such fields are uncommon in daily life. Here, we examine whether the CNS selectively controls the arm’s endpoint impedance in the absence of active force fields but in the presence of instability arising from task geometry and signal-dependent noise in the neuromuscular system. Subjects were required to generate forces, in two orthogonal directions, onto four differently curved rigid objects simulated by a robotic manipulandum. The endpoint stiffness of the limb was estimated for each object curvature. With increasing curvature, the endpoint stiffness increased mainly parallel to the object surface, and to a lesser extent in the orthogonal direction. Therefore, the orientation of the stiffness ellipses did not orient to the direction of instability. Simulations showed that the observed stiffness geometries and their pattern of change with instability are the result of a trade-off between maximizing the mechanical stability and minimizing the destabilizing effects of signal-dependent noise. Therefore, it would have been sub-optimal to align the stiffness ellipse in the direction of instability. The time course of the changes in stiffness geometry suggests that modulation takes place both within and across trials. Our results show that an increase in stiffness relative to the increase in noise can be sufficient to reduce kinematic variability, thereby allowing stiffness control to improve stability in natural tasks.
Keywords: stiffness, motor noise, upper limb, optimality, learning, control
Introduction
Most tasks in daily life, from using a pencil, typing on a keyboard, or eating with a fork, involve dynamic interactions with the environment. Humans are dexterous at such interactions. However, in many cases, the geometry of the task makes the interaction inherently unstable (Rancourt and Hogan, 2001; Milner, 2002a; Franklin et al., 2003). Rancourt and Hogan (2001) postulated that the control of the arm’s endpoint stiffness could play an important role in stabilizing such inherently unstable interactions. However, to change the endpoint stiffness, muscular co-activation is needed (Hogan, 1984; Milner and Cloutier, 1993; Milner, 2002b). Such muscle contraction increases internal variability due to signal-dependent motor noise (SDN) and could therefore add to any instability (Harris and Wolpert, 1998).
Studies have shown that subjects have a limited ability to control their endpoint stiffness cognitively (Gomi and Osu, 1998; Perreault et al., 2002). However, subjects do modulate stiffness in response to instability generated by robotic interfaces. For example, appropriate changes in stiffness have been seen when significant amounts of energy are added to the arm either by applying random force pulses while subjects maintain a fixed posture (Darainy et al., 2004) or by creating a divergent force field in which deviations from a straight line movement are actively amplified (Burdet et al., 2001; Franklin et al., 2003b; 2004; 2007). In these studies, the destabilizing forces are either independent of hand position variability (Darainy et al., 2004), or increase linearly with hand deviation (Burdet et al., 2001; Franklin et al. 2003b; 2004; 2007), such that destabilizing force variability is proportional to positional variability. In contrast, when interacting with real world objects that impose stability constraints (e.g. a screwdriver), the perturbing forces can increase supra-linearly with positional errors. In this case, kinematic variability must be tightly controlled to maintain stability. It is unknown if stiffness control is seen in such interactions in which instability arises from purely passive elements and noise in the motor commands. Theoretical work suggests that if the stabilizing forces due to stiffness increase faster than the destabilizing forces due to SDN, then muscular co-activation will reduce kinematic variability and increase stability (Selen et al., 2005).
Here we examine whether subjects control their arm’s endpoint stiffness to maintain stability in a natural task. Subjects produced a force of defined magnitude and direction against objects of different curvature, which impose different levels of instability. The experiment was performed for two force directions. In addition to sessions in which objects of a particular curvature were presented repeatedly, we also measured the stiffness in sessions in which objects of different curvature were randomly interleaved. Importantly, the required force level generated by the subject against the objects was kept constant throughout the experiment so that any changes in stiffness are independent of the net force level. This allowed us to assess both the changes in the geometry of stiffness and the extent to which stiffness can be adapted from trial-to-trial to match varying task demands.
Materials and methods
Experiment
Six healthy, right-handed, subjects (ages 23-37) participated in the main study (4 male, 2 female). Seven healthy, right-handed subjects (ages 22-37) participated in a second study. Five of these subjects completed both the main study and the second study. The institutional ethics committee approved the experiments and the subjects gave informed consent prior to participating in the experiment. In the main study, subjects participated in two experimental sessions each of around 1.5 hours on separate days. The second study was performed in a single session of 1.5 hours.
Apparatus
Subjects were seated in a sturdy chair (Saab seat) in front of a planar robotic device (vBOT) (Howard et al., 2009). Their shoulders were strapped against the backrest of the chair by a four-point seat-belt. The subjects’ right forearm was securely coupled to the vBOT handle by a custom molded thermoplastic cuff (Omega Max/Plus, Promedics, UK) that also immobilized the wrist joint. The forearm rested on an air-sled that moved over a glass plate at chest level, constraining movement to the horizontal plane and reducing shoulder and elbow motion to a single degree of freedom each.
The position of the vBOT handle was calculated from joint-position sensors (IED, 58SA) on the motor axes. The sensors provide 30,000 pulses per revolution, and with a gearing of 7 give a nominal resolution on the order of 20 microns at the handle. The velocity of the handle was estimated by an extended Kalman filter using the vBOT’s joint-position readings in combination with handle accelerations (Entran, EGA-F, 10g). The forces exerted on the handle were measured by a six-degrees-of-freedom force sensor (Nano25, ATI, Apex, NC, USA), located between the vBOT handle and the vBOT arm. The vBot was controlled at 1000 Hz. Joint angles, handle accelerations and handle forces were sampled at the same frequency. Veridical feedback of the hand position and other task relevant cues was provided by a projection from a monitor (Apple Cinema, 30″, 16 ms loop-latency) in a mirror located just above the robot handle.
Experimental task
Subjects produced isometric forces against simulated rigid objects (Fig. 1). The hand position was continuously presented to the subject by a filled circle of 0.5 cm radius. The hand representation corresponded to the actual hand position except during the perturbations when the hand representation was frozen.
Figure 1.
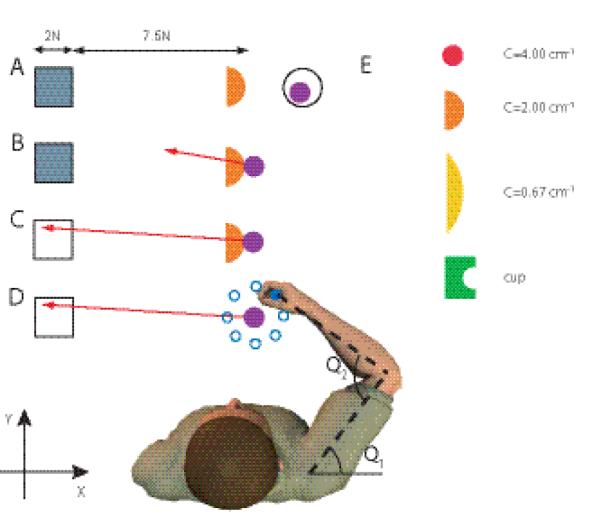
Overview of the experimental setup and paradigm for the main experiment. An additional experiment was carried out with the visual and haptic scene rotated 90 ° clockwise. A, Visual display when the subject is not touching the rigid object. Orange half circle represents a simulated rigid object that is fixed in space. The square is the target area and the purple circle is the veridical representation of the subject’s hand position. The hand is in the start area (black circle). The target area is grey, indicating that the force vector is not in it. B, Subject touches the rigid object and feels the interaction force. The force exerted on the object is shown to the subject as a red arrow. The start area is no longer presented. C, Same as above, but now the force vector is correctly within the target, which becomes white. D, After a 1.5—2.5 s delay the visual display is frozen and the hand is moved 8 mm to one of eight positions around a circle (blue). The visual display, the perturbation positions and the subject are not drawn on the same scale. E, The four objects with which the subjects interact. ‘C’ stands for curvature with unit cm−1. All objects had the same color in the experiment. The Cartesian axes are indicated by x and y and the shoulder and elbow joint angles by θ1 and θ2.
Trials were self-initiated by the subjects moving their hand into the start circle (Fig. 1A). The rigid object and force target (grey square) were then presented. When the hand contacted the object, the robot generated appropriate haptic feedback of the interaction forces. The force vector representing the force subjects exerted on the object was displayed (red arrow, Fig. 1B) and the subject was required to direct this force vector into the force target (Fig. 1C). The force target was a square with its closest boundary at 7.5 cm and sides of 2 cm. The force vector was drawn with a scale of 1 N = 1 cm requiring subjects to generate between 7.5-9.5 N. Whenever the tip of the force vector was within the target area, the force target turned from grey to white. Subjects were required to maintain the force vector continuously within the force target for a predefined time (1.5—2.5 s, randomly drawn from a uniform distribution), after which the hand position was perturbed as part of the stiffness estimation (Fig. 1D, see section on stiffness estimation). To avoid subjects interpreting the perturbation onset as the end of a trial and moving back to the start region, they were required to maintain the force until the end of the perturbation. If they failed to do so, the start region would not appear until subjects had reproduced the desired force again.
Haptic force feedback of the hand-object interaction was simulated for a ‘cup’ and three circular objects of different curvature (C=[4.00 2.00 0.67] cm−1, Fig. 1E). The hand-object interaction force was simulated with a stiff spring (90 N cm−1) and the force was always perpendicular to the surface at the interaction point. No frictional forces parallel to the surface were simulated. This resulted in unstable interactions for the objects with positive curvature. The ‘cup’ condition is fully stable and we plot results as though this had a curvature of zero (although it is in fact more stable than a flat surface). This plotting convention does not affect any statistical tests.
The main experiment was split into two sessions performed on separate days. In this experiment we looked at stiffness modulation while producing force in the negative x-direction (axes shown in Fig 1). The subject’s position relative to the hand-object interaction point was adjusted such that the shoulder and elbow angles were 45° and 90° respectively and that the shoulders were parallel to the x-axis. After familiarization, subjects completed 120 trials for each object in each experimental session (480 trials per day). In one session, each of the four objects was presented in blocks of 120 trials where the block order was randomized (blocked). In the other session, the objects were presented in random order changing from trial-to-trial (random). Half of the subjects started with the blocked session and the remaining half with the random session. All 6 subjects participated in both the blocked and random sessions
A second experiment was carried out to investigate the modulation of stiffness while producing forces along the positive y-direction (axes shown in Fig 1). In this experiment targets were only presented in blocks. The subject’s position relative to the hand-object interaction point was adjusted such that the shoulder and elbow angles were 30° and 80° respectively. For this experiment the required endpoint force range was decreased to 6.5-8.5 N. All other parameters of the experiment were the same as in the main experiment.
Task performance
Task performance was quantified with two measures. First, the time it took a subject to finish a trial, defined as the time the hand was in contact with the object before the force vector entered into the target for the final occasion (as it was possible to slip out of the target or off the object). Second, for each trial the mean force vector from 500—1500 ms after entering the force target was calculated.
Stiffness estimation
After the force vector was maintained within the force target for the predefined minimal time (1.5—2.5 s), the robot switched from force to position servo control (position gain: 120 N cm−1; velocity gain: 0.8 Ns cm−1). The servo smoothly and rapidly displaced the hand to one of eight equally distributed positions on a circle of 8 mm radius centered on the hand position just before perturbation onset (Fig. 1D). To avoid any visually induced reactions, visual feedback was frozen during the perturbations. The displacement consisted of a smooth 80 ms ramp-away, a 300 ms hold and a 120 ms ramp-back period. The average restoring force and displacement between 170—230 ms after perturbation onset were used to estimate the two-by-two endpoint stiffness matrix K by linear regression:
| (1) |
where Δ indicates the mean change measured in the perturbed location with respect to the mean measured in the final 100 ms prior to perturbation. The endpoint stiffness can be represented as an ellipse (Mussa-Ivaldi et al., 1985). Singular value decomposition of the stiffness matrix K was used to determine the area, shape and orientation of the stiffness ellipses (Gomi and Osu, 1998).
Statistics
All data analyses were performed off-line in Matlab (The Mathworks). Statistical analyses were performed using general linear models in SPSS 16.0 (SPSS, Chicago, IL). Most statistical analyses were repeated measures ANOVAs with object curvature (C=[4.00 2.00 0.67 ‘cup’]) and session (blocked and random) as factors. Statistical significance was considered at the 0.05 level and whenever appropriate post-hoc tests with Bonferroni correction were performed.
Model
Theoretical aspects of stiffness geometry on force and position variability
In order to understand the mechanisms by which force variability and stiffness interact during haptic interactions, a simple musculo-skeletal model of our task was built. For simplicity, the model only captures the open-loop behavior of the system and does not model reflexive and visual contributions. Simulations of this model were used to investigate the qualitative effects of endpoint stiffness geometry on force variability and position variability. Both instances of variability are the result of the signal dependency of the force fluctuations of the individual muscles (Harris and Wolpert, 1998; Jones et al., 2002), mediated by the dynamics, including the stiffness, of the musculoskeletal system (Selen et al., 2005). The arm was modeled as a two-link system exerting a force of 7.5 N onto a rigid circular object. The circular object had no surface friction. The arm model was driven by six muscles: four mono-articular muscles, two crossing the elbow and two crossing the shoulder and two bi-articular muscles.
The force attributed to each muscle was derived from the required endpoint stiffness matrix and external force demand. The stiffness geometry of the endpoint of the arm can be expressed as an endpoint stiffness matrix (K) in Cartesian space:
| (2) |
For our simulations we set Kxy and Kyx equal, resulting in a purely conservative stiffness (Mussa-Ivaldi et al., 1985) as was observed in the experiments. From the endpoint stiffness, the joint stiffness (R) can be determined (McIntyre et al., 1996):
| (3) |
Where J represents the Jacobian matrix of the current limb configuration and α the joint angles. The second term describes the geometric stiffness, which is a tensor product between the derivative of the Jacobian matrix J and the endpoint force F. This term corrects for the change in endpoint force when the hand is moved slightly and the net joint torques remain the same. The joint stiffness results from the stiffness of the individual muscles:
| (4) |
where D is a 6×2 matrix of the moment arms of the muscles around the shoulder and elbow joint. Moment arms were defined positive for flexor muscles and negative for extensor muscles and based on published values (Murray et al., 1995; Kuechle et al., 1997; Nijhof and Kouwenhoven, 2000)(see Table 1 for model parameters). M is a diagonal matrix representing the stiffness of each muscle, where the muscle stiffness terms (Mm,m) depend on the muscular force (Fm):
| (5) |
Table 1.
Parameter values for the limb model. Elements of the muscle moment arms matrix (Di,j), for the six muscles (i=1-6) around the shoulder (j=1) and elbow joints (j=2). All other elements of D are zero. Moment of inertia (I) around the center of mass, the mass (m) and length (l) of the upperarm (1) and forearm+hand (2). cm is the propotionality constant between muscle force and stiffness. The damping matrix (B) is proportional to the stiffness matrix (K).
| Muscle moment arms |
Segment parameters |
||
|---|---|---|---|
| D 1,1 | 0.0536 [m] | I1 | 0.04 [Nms2] |
| D 2,1 | −0.0536 [m] | I2 | 0.06 [Nms2] |
| D 3,2 | 0.0316 [m] | m1 | 1.93 [kg] |
| D 4,2 | −0.0267 [m] | m2 | 1.52 [kg] |
| D 5,1 | 0.0386 [m] | l1 | 0.31 [m] |
| D 6,1 | −0.0388 [m] | l2 | 0.34 [m] |
| D 5,2 | 0.0427 [m] | cm | 75 [m−1] |
| D 6,2 | −0.0300 [m] | B | 0.05 K |
The scaling constant cm was based on published joint torque-stiffness (Gomi and Osu, 1998; Franklin and Milner, 2003) and muscle force-stiffness (Edman and Josephson, 2007) regressions. We show results for cm = 75 m−1 across all muscles, but results look similar for other values within the physiological range. Combining these equations gives:
| (6) |
In order to calculate the muscle forces from the endpoint stiffness, we use the additional constraint that the joint torques (T) create the desired endpoint force:
| (7) |
Both these equations were simultaneously solved with the additional constraint that the sum of the squared muscular forces was minimized. This criterion was taken as a heuristic for energy expenditure. With a six-muscle arm model only a limited range of stiffness matrices can be created.
The muscle forces resulting from the optimization were subsequently contaminated with signal-dependent noise (SDN) and smoothed with a second order filter with time constants of 30 and 40 ms. The amount of SDN (CV=0.15) was chosen so that the coefficient of variation of the filtered force traces was 3% (Hamilton et al., 2004; Moritz et al., 2005). Note that using lower CV values that have been suggested for the more proximal joints (Hamilton et al., 2004) do not affect the basic result of the simulation. In a forward simulation these noisy forces were exerted on a two-link system with the corresponding joint stiffness matrix and external constraints set by the object curvature. The joint damping matrix was set equal to 5% of the stiffness matrix. This value is of similar magnitude to both that used in computational models of the arm (Franklin et al., 2008) and those measured experimentally (Dolan et al., 1993; Perreault et al., 2004). Outcome measures were the force variability and the kinematic variability of the system’s endpoint over a 10 s simulation. Both Kxx and Kyy were varied from 100 to 600 Nm−1 and the off-diagonal elements Kxy and Kyx from −200 Nm−1 to 0 Nm−1. Simulations were performed for object curvatures of 0.01, 0.1, 0.2 and 0.4 cm−1. For our model we took a force to stiffness ratio that is based on relatively large perturbations and therefore we probably underestimate the stiffness (Kearney and Hunter, 1982; Shadmehr et al., 1993). Due to this, and the lack of active feedback mechanisms, our model becomes unstable during interactions with objects of higher curvature.
Intrinsic and reflexive contributions to impedance
For simplicity, the model only attempts to predict the open-loop behavior of the limb and does not include feedback contributions. It is clear that reflex pathways significantly contribute to muscle stiffness (Carter et al., 1990; Hoffer and Andreassen, 1981; Nichols and Houk, 1976) and are modulated with task (Akazawa et al., 1983; Nashner 1976; Bennett et al., 1994; Lacquaniti et al., 1991) and environmental dynamics (Franklin et al., 2007; Perreault et al., 2008; Damm and McIntyre, 2008; Pruszynski et al., 2008). Despite this evidence we have chosen to model only the open-loop behavior of the limb. This is because we are not yet able to accurately model the reflex contributions to the impedance control during natural tasks. The only current techniques which allows for simultaneous estimates of both intrinsic and reflex stiffness either have not yet been applied to the two-joint limb due to limitations of current robotic devices (Stein and Kearney, 1995) or require stochastic perturbations which disturb performance of a natural task (Kearney et al., 1997; Zhang and Rymer 1997; Perreault et al., 2000; Van der Helm et al., 2002). This means that any modeled reflex contributions to the control of impedance would be physiologically unconstrained. Such modeling would not allow us to accurately understand the interplay between noise and stiffness. Our modeling therefore focused purely on the modulation of the intrinsic stiffness in order to see if this portion of the controlled impedance could explain the rather surprising experimental results. By constraining our model in this manner we gained understanding of the interplay between muscle stiffness, environmental instability and signal dependent noise.
Results
Forces
Build-up
Building up the required force while maintaining stability took time. As object curvature increased, this force build-up time increased four fold (main study: F(3,15)=33.371, p<0.001; second study: F(3,18)=19.543, p=0.002)(Fig. 2A). Force build-up times were not significantly different between the blocked or random sessions, and neither was there a significant interaction between object type and session. Several mechanisms may be responsible for the slower build-up: force variability tends to decrease with decreasing speed (Gordon and Ghez, 1987) and higher forces take more time to build up and are needed to increase the stiffness (Edman and Josephson, 2007).
Figure 2.

Task performance. A, The mean time (± sem across subjects) to stabilize the required force. B, The mean force (± sem) exerted in the target region. Circles (black) and squares (grey) indicate the blocked and random session respectively for pushing in the main study: negative-x direction (Fx). Black diamonds refer to pushing in the second study: positive-y direction (Fy), in a blocked design. Measures calculated over the final 40 trials of each condition. * Indicates significant difference between the blocked and random sessions (p<0.05).
Hold phase
After the build-up, subjects were required to keep the interaction force, represented by the force vector, within a target window of 7.5 to 9.5 N for at least 1.5 s before a perturbation occurred and the trial finished. Subjects exploited this force margin by lowering the average length of the force vector as the object curvature increased (main study: F(3,15)=27.930; p<0.001; second study: F(3,18)=8.463; p=0.001) (Fig. 2B), thereby possibly reducing the signal-dependent noise in the force signal. The average length of the force vector did not differ between blocked and random sessions. However, a significant interaction between object curvature and session type was found (F(3,15)=5.581; p=0.009). Post-hoc repeated measures on the sessions separately showed that the length of the force vector decreased with increasing object curvature for both sessions (blocked: F(3,15)=19.067; p<0.001 and random: F(3,15)=14.331; p<0.001). Subsequently we performed post-hoc paired t-tests between the sessions for the individual objects. For the ‘cup’ condition the length of the average force vector was significantly smaller in the random than in the blocked session (p=0.048). These results suggest that subjects reduce the force produced as the task becomes harder. Bringing the magnitude of the force vector closer to the lower boundary of the target force area increases the risk of producing too little force, thereby resetting the hold phase timer. However, this strategy is still less costly than slipping off the object. In the former case the force does not have to be build up again from zero, but only has to be increased by a small amount to get into the target area again.
Stiffness
The endpoint stiffness was estimated using linear regression of the force and position traces for the final 80 trials for each object. The regression was performed on the time averaged force and position in the estimation window (170—230 ms) of all individual perturbation trials. The variance explained (r2) by this linear regression ranged from 0.89 to 0.98 over all the subjects, force directions, objects and sessions.
Main study
Figure 3A presents the stiffness ellipses for the force in negative x-direction for all subjects, object curvatures and experimental sessions.
Figure 3.

Endpoint stiffness is adapted to the curvature of the objects for forces in the main study: negative–x direction. A, Endpoint stiffness represented as an ellipse for all subjects (S1-S6), object curvatures (color codes shown) and experimental sessions. B, Size (± sem) of the stiffness ellipses for the different objects for the blocked (red circles) and random (blue squares) sessions. C, Orientation (± sem) of the stiffness ellipses.
The size of the stiffness ellipse (Fig. 3B), a measure of the global increase in stiffness, systematically increased with increasing object curvature (F(3,15)=69.613; p<0.001). The stiffness ellipses systematically rotated toward the direction of instability (Fig. 3C) with increasing object curvature (F(3,15)=23.869; p<0.001). However, this rotation was small (maximum rotation: 23°) and the orientation of the ellipse never fully reached the 90° direction of the instability (closest value: 110°).
The stiffness ellipse, its size and orientation are convenient measures to represent the characteristics of the stiffness matrix. However, the full information about the endpoint stiffness is contained in the elements of the stiffness matrix (Fig. 4A). The diagonal elements Kxx and Kyy increased with increasing object curvature (F(3,15)=12.234; p<0.001 and F(3,15)=61.511; p<0.001). Across all objects, no significant main effect was observed between the blocked and random session for any element of the stiffness matrix. However, an interaction between object and session was found for Kyy (F(3,15)=4.897; p=0.014). To study this further, pair-wise comparisons of Kyy between the blocked and random sessions for the individual objects were performed, showing that for the lowest curvature and the ‘cup’ condition Kyy was higher in the random compared to the blocked session (p=0.013 and p=0.050). The ratio of Kyy to Kxx (Kyy/Kxx) was calculated to further examine the modulation of the total stiffness. This ratio increased with object curvature (F(3,15) = 36.603; p<0.001), indicating that Kyy increases faster than Kxx.
Figure 4.

Changes in the endpoint stiffness matrix for forces in the main study (negative–x direction). A, The elements (± sem) of the endpoint stiffness matrix. Circles indicate the blocked session and squares the random session. Both Kxx and Kyy show a significant increase with object curvature, and Kyy differed between the blocked and random sessions for the ‘cup’ and lowest curvature conditions. B, Changes in the ratio of Kyy and Kxx of the stiffness matrix. Kyy/Kxx differed between the blocked and random session for the ‘cup’ and lowest curvature conditions.
Second study
Stiffness ellipses for the individual subjects and the elements of the endpoint stiffness matrix are presented in Figure 5 for forces in the positive y-direction. For this direction, the modulation of the stiffness ellipse with object curvature is much more variable between subjects (Fig. 5A). However, across all subjects only the modulation in Kxx reaches significance with object curvature (F(3,18)=9.439; p=0.014, Fig 5B). Also for this force direction the ellipses are, in general, not oriented along the instability direction and the off-diagonal elements of the stiffness matrix did not vary with curvature, remaining around −120 Nm−1 (Fig. 5B).
Figure 5.

Endpoint stiffness is adapted to the curvature of the objects for forces in the second study (positive-y direction). A, Endpoint stiffness represented as an ellipse for all subjects (S1-S7) and object curvatures (color codes shown). B, The elements (± sem) of the endpoint stiffness matrix. Only Kxx shows a significant increase with object curvature. C, Changes in the ratio of Kyy and Kxx of the stiffness matrix.
Rancourt and Hogan (2001) have performed theoretical analyses on the stability requirements for a push-on-a-stick paradigm, which is mathematically equivalent to our experiments: the hand representation, together with the curved object, can be described as a pivoting stick around the center of the curved object. In the case of our main experimental task, theoretical values of Kyy should be greater than 1500 Nm−1, 1000 Nm−1, 428 Nm−1 and zero Nm−1 respectively. Several factors may have contributed to the lower stiffness estimates in our experiment. First, our stiffness estimates were based on relatively large perturbations (8 mm) compared to the infinitely small perturbations for the theoretical derivations. Previous studies have demonstrated that muscle (Rack and Westbury, 1974; Kearney and Hunter, 1982; MacKay et al., 1986) and limb (Shadmehr et al., 1993) stiffness decreases nonlinearly with the amplitude of the perturbations used for stiffness estimation, resulting in stiffness underestimates for larger perturbations. Another possible explanation for measured stiffness values lower than the theoretical values could be that the hand is not locally stable (Hasan, 2005) but relies on corrective responses for compensation. The feedback mechanisms necessary for these corrective responses are neither taken into account in the mathematical derivations by Rancourt and Hogan (2001) or in our simulations. Finally, the robotic manipulandum has some static and dynamic friction that adds to the overall stability of the system and reducing the required stiffness of the arm. Nevertheless, with these lower stiffness values our subjects were able to stabilize their hand while pushing.
History dependence of the stiffness matrix
Previous studies have shown that motor actions in the current trial systematically depend on the history of previous trials for grip force modulation (Witney et al., 2001), force compensation (Scheidt et al., 2001) and EMG modulation (Osu et al., 2002; Franklin et al., 2008) during motor adaptation to novel force fields. Our observation, in the main experiment, that the endpoint stiffness was higher in the random compared to the blocked session for the more stable objects, similarly suggests that the endpoint stiffness in the previous trial(s) is not entirely washed out during the force build-up of the present trial. To further investigate this, we calculated the stiffness ellipse for all possible trial transitions to all objects and compared that to the average stiffness for that object. For example, to examine the influence of the previous trial on the stiffness estimate for the object of curvature 2, we calculated the stiffness for the following transitions: Curvature 4.00 → Curvature 2.00, Curvature 2.00 → Curvature 2.00, Curvature 0.67 → Curvature 2.00, ‘Cup’ → Curvature 2.00.
Repeated-measures ANOVA with four possible transitions towards four possible objects revealed significant effects of both transition (F(3,21)=5.343; p=0.007) and object (F(3,21)=27.235; p=0.001) on Kyy. Because there were no interactions, we collapsed the transition data for all object curvatures (Fig. 6A). Interacting with the object of Curvature 4 on the previous trial will on average result in stiffness for the present trial that is 20 Nm−1 higher than the average stiffness for the object of the present trial. Similarly, having interacted with the ‘cup’ object in the previous trial will lower the stiffness in the present trial by about 15 Nm−1. Figure 6B shows the difference in the Kyy for each object relative to the mean Kyy across objects. To show the relative amount of influence of the previous object compared to the current object, the gray band in Fig 6B shows the full range of Kyy values in Fig 6A. Approximately 10% of the stiffness change can be explained by the curvature of the object on the previous trial.
Figure 6.
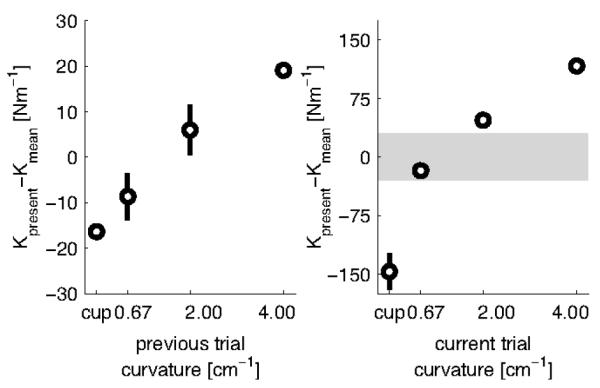
Effect of previous trial on stiffness (Kyy) produced in the current trial for main study. A, Transitional stiffness difference for all objects, relative to their overall mean, collapsed over all object curvatures. Horizontal axis shows the object curvature on the previous trial, vertical axis shows how object curvature systematically influences the stiffness on the current trial. B, Stiffness difference for the 4 objects, relative to their overall mean. Note the difference in scale between A and B (grey area corresponds with scale in A), indicating that the previous trial has a minor influence on the stiffness value of the current trial (approximately 10%).
Theoretical aspects of stiffness modulation for stabilization in a force production task
Our main experiment, where forces were produced in negative x-direction, showed two surprising results. First, subjects modulated their stiffness not only in the direction of the instability (the y-direction) but also in the orthogonal direction. Second, the orientation of the stiffness ellipse was never in the direction of the instability and Kxy remained roughly constant. These findings are at odds with studies on reaching movements in unstable environments, in which the major axis of the stiffness ellipse is oriented in the direction of instability (Burdet et al., 2001; Franklin et al., 2003b; 2007) and only modulates in that direction (Franklin et al., 2004). We hypothesized that our findings could arise because to maintain stability the motor system has to trade off the stabilizing properties of stiffness and the destabilizing properties of noise and that this tradeoff will depend in a complex way on the task geometry.
To investigate this, we simulated the effects of different stiffness geometries on force and position variability in a simple planar arm model. All attainable stiffness geometries for a stiffness-to-force constant of 75 m−1 were derived (see Methods). The muscle forces required to generate the stiffness geometry were contaminated with SDN with a CV of 3%.
Figure 7 shows how different stiffness geometries and object curvatures affect the kinematic variability (expressed as SD) of the arm’s endpoint. Kxy is varied along the columns and object curvature along the rows. Note that the object curvatures are smaller than those in the experiments. Presumably because of the lack of visual and reflexive feedback, our model could not maintain stability for objects of curvatures above 0.4 cm−1. The top row of Figure 7 shows the kinematic variability when the arm’s endpoint pushes onto a frictionless wall. The valley of minimal variability, shown in white, is a function of both Kxx and Kyy and it is along this valley that stiffness will be modulated. In order to reduce kinematic variability, subjects will have to change their stiffness geometry along this manifold and increase Kxx and Kyy simultaneously. Furthermore, it is clear that more negative Kxy’s result in less kinematic variability and a broader region, i.e. a shallower valley, of low kinematic variability. As object curvature increases, along the rows of Fig. 7, the kinematic variability for the same stiffness geometry increases (note the different color bar scales). The region spanned by Kxx and Kyy combinations reduces because for certain combinations the hand slips off the object.
Figure 7.

The simulated variability of endpoint position in relation to the endpoint stiffness and task geometry for the main study. Endpoint variability is caused by signal-dependent noise on the muscular forces. Each panel depicts the kinematic variability (SD) as a function of Kxx and Kyy. The columns represent different off-diagonal terms of the stiffness matrix (Kxy), with the leftmost column showing all stiffness geometries having one of their axes along the instability direction. Task geometry is expressed as object curvature, which increases down the rows (C=[0, 0.1, 0.2, 0.4] cm−1). The kinematic variability results for each object curvature are plotted using different scales as indicated beneath each row. Note that with increasing curvature the kinematic variability increases, which for some stiffness geometries results in slip offs. This is reflected by the increase of the white area. White lines indicate the valley of kinematic variability minima (i.e. the Kxx that minimizes the kinematic variability for a given Kyy).
These simulations, therefore, suggest that both Kxx and Kyy have to be increased for stability. In addition, they provide indications why we found experimentally that subject have a constant, non-zero, off-diagonal term (Kxy) in the stiffness matrix at all times: For a given combination of Kxx and Kyy, more negative values of Kxy are associated with lower global energy demands, expressed as the sum of all muscular forces (Fig. 8). However, lowering Kxy even further may be suboptimal because this requires extensive activation of the mono-articular shoulder muscles, thereby increasing the local physiological cost (Fig. 9, dashed lines).
Figure 8.

Sum of internal muscular forces as a function of stiffness geometry, simulated for the main study. Each panel depicts the sum of the internal muscular forces in N for different off-diagonal terms in the stiffness matrix (Kxy). This sum of internal muscular forces in N was an approximation of total energy expenditure.
Figure 9.
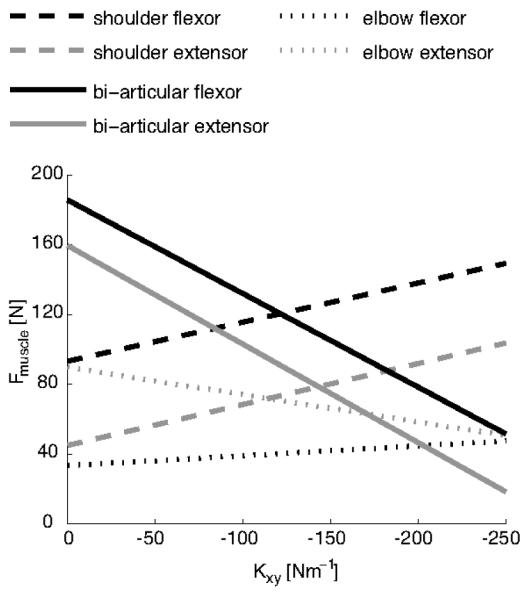
Simulation of the changes in muscle recruitment for different off-diagonal components of the stiffness matrix (for main study: negative–x force direction task). Muscle force as a function of Kxy. The elements Kxx and Kyy are fixed at 330 Nm−1 and 460 Nm−1 respectively. In order to increase the magnitude of Kxy, most muscles decrease their activity, resulting in lower global cost (Fig. 8). However, the mono-articular muscles around the shoulder (dashed lines) increase their activity, resulting in local fatigue and putting a limit on the negativity of Kxy.
In contrast to the main experiment, for the second experiment (positive y-direction) significant modulation of only Kxx was observed. We also simulated the effects of different stiffness geometries on position variability for this task. In correspondence with the experimental result, position variability was hardly influenced by changes in Kyy resulting in the absence of a clear valley of minimum position variability (Fig. 10B). Furthermore, the model predicts that position variability decreases with increasing Kxy before reaching a minimum at −120 Nm−1. This value nicely corresponds with the experimental observations.
Figure 10.

A comparison of the predicted and observed manifold along which the endpoint stiffness (Kxx and Kyy) should modulate as task difficulty increases. A, Simulated kinematic variability (SDy) for the main study (negative-x force production direction). A clear dependence of Kxx and Kyy is visible (see also Fig. 7). For the simulations Kxy=−150 and curvature was zero. B, Simulated kinematic variability for the second study (positive-y force direction). Now the kinematic variability (SDx) depends almost entirely on Kxx. C, The manifold along which the experimental results align. Regression lines of Kxx and Kyy through the experimental results for the main study (negative-x, red) and second study (positive-y, blue). Also the mean values and sem for each object curvature (see colormap of Fig. 1) and force direction are shown.
Figure 10 summarizes and relates the experimental and simulation results for both studies. Our simple arm model predicts a strong dependence between Kxx and Kyy for the negative-x force direction of the main study (Fig. 10A), resulting in a valley along which to modulate stiffness. Since the orientation of this valley hardly depends on object curvature (see Fig. 7), we show results for a simulated wall. In addition, we fixed Kxy to −150 Nm−1, which corresponds with our experimental findings. As stated earlier, Kyy hardly influences the kinematic variability in the simulations for the second study: positive-y direction (Fig. 10B). To summarize the experimental findings, we calculated the linear regression for all observed pairs of Kxx and Kyy (Fig. 10C). The regression slope is not different from zero for the second study (positive-y force direction), whereas the slope for the main study (negative x-direction) is significant (slope = 1.66, p = 0.007) and similar to that of the valley derived from our simulations (slope = 1.52). We also show the mean and sem for the individual object curvatures and the two force directions.
In conclusion, we found an increase in both Kxx and Kyy for the main study (negative-x force direction) and only an increase of Kyy in the second study (positive-y force direction). Furthermore, for both studies, the stiffness matrix was never oriented along the instability axis. These results are explained by the model as a trade-off between adding stiffness to maintain stability and minimizing the detrimental effects of SDN that the added stiffness does not compensate for.
Discussion
In this study we investigated the ability of the neuromuscular system to control the arm’s endpoint stiffness in an unstable force production task. As the curvature of the objects increased (higher instability), subjects changed their endpoint stiffness, both in the overall size and orientation. In particular, subjects adapted their arm endpoint stiffness geometry predominantly in the direction of the instability, but also in the orthogonal direction. Simulations showed that these features represent a trade-off between stability engendered by the increase in stiffness and the destabilizing effects of neuromotor noise. Random presentation of object curvatures resulted in a clear influence of the object curvature in the preceding trial on the endpoint stiffness in the current trial.
Influence of signal-dependent noise on stiffness geometry
Our findings complement earlier studies in which energy was added to the system to create an unstable environment. Increased instability during movement, caused by an external divergent force field, resulted in an alignment of the stiffness geometry with the direction of instability (Burdet et al., 2001; Franklin et al., 2003b; 2007) and scaled with the magnitude of the instability (Franklin et al., 2004). During posture maintenance, the addition of energy, in the form of directional force pulses, resulted in changes of the stiffness geometry that were specific to the instability of the environment (Darainy et al., 2004). In contrast, our study examined natural interactions in which instability arises from purely passive elements in the world and noise in the motor commands.
We found only limited changes in the orientation of the endpoint stiffness as the object curvatures increased, with a maximum change of 23° and the closest ellipse orientation to the 90° instability direction being 110°. Similar small changes in the ellipse orientation have been reported previously for postural tasks (Perreault et al., 2002; Darainy et al., 2004). However, the orientation of the stiffness ellipse itself is less important than the change in the endpoint stiffness relative to the normal endpoint stiffness. This was examined with the changes in the Kxx and Kyy terms of the stiffness matrix. While the ratio of Kyy/Kxx increased with object curvature, indicating that the greatest change in the endpoint stiffness was in the direction of the instability, both Kyy and Kxx increased as this instability increased. Therefore the endpoint stiffness of the arm increased both in the direction of the instability as well as in the orthogonal force direction.
Based on numerical simulations it has been argued that the properties of the neuromuscular system limits rotation of the stiffness ellipse to this small range (Darainy et al., 2004). In contrast, our numerical simulations indicated that in principle the neuromuscular system could orient the major axis of the stiffness ellipse in the direction of the instability (Fig 5, left column, Kxy=0). This ability arises in our model because, unlike the previous model, we allowed the independent control of co-activation of mono-articular and bi-articular muscles. While previous studies of stable force control tasks have shown mainly changes in the single joint muscles (Perreault et al., 2001) or a combined control over both the single and bi-articular muscles (Gomi and Osu, 1998), studies of unstable environments have favored a unique role for the bi-articular muscles (McIntyre et al., 1996) and independent control over these muscles for stability purposes (Franklin and Milner, 2003; Franklin et al., 2003a; 2007). Further support for this has been seen in the relative changes in bi-articular muscle involvement between force and movement control (Tax et al., 1990; van Groeningen and Erkelens, 1994; van Bolhuis and Gielen, 1997). These studies suggest that there is at least a degree of independent control over the mono-articular and bi-articular muscles which could lead to a greater degree of control over the endpoint stiffness than was predicted previously.
However, the most important finding of the simulation was that the lowest kinematic variability was not obtained when the stiffness ellipse was oriented in the direction of the instability. Instead it was obtained when the model adapted to the instability in a similar pattern to that observed in our subjects, with both an increase in the Kxx and Kyy terms of the stiffness matrix and only a partial rotation of the stiffness ellipse towards the direction of the instability. We argue that the neuromuscular system may be able to rotate the stiffness ellipse over a wider range than has been previously shown in static studies, but that a further rotation towards the instability direction is sub-optimal when one considers the effects of signal-dependent noise. For both force production directions, our simulations show that SDN has a bigger effect on kinematic variability when the main axis of the stiffness ellipse is along the instability direction. Having non-zero off-diagonal terms in the stiffness ellipse reduces this influence, thereby guaranteeing stability. These non-intuitive effects suggest that there are fundamental differences between the control of endpoint stiffness for movement variability reduction and for stabilization against external force fields.
Based upon an unstable task requiring the compressing of a spring able to buckle, it has been argued that stiffness modulation is inconceivable to guarantee stability because it would introduce instability due to signal-dependent noise (Venkadesan et al., 2007). The present study contradicts this claim and underpins earlier simulation work (Selen et al., 2005), by showing that the increase in SDN at the muscular force level can be counteracted by increase in joint- and endpoint stiffness. Nevertheless, it is conceivable that not all unstable interactions with the environment can be stabilized by stiffness modulation. In addition to changing the stiffness geometry, our subjects also exploited the size of the target force region to maintain stability. Lowering the forces has a positive effect on stability in two ways. First, the required stiffness decreases linearly with the average force (Rancourt and Hogan, 2001) and secondly the perturbing forces due to signal-dependent noise also decrease with lower forces (Jones et al., 2002; Hamilton et al., 2004).
The time course of stiffness modulation
When faced with a new dynamical environment, the CNS has to update its internal representation of (the stability of) that environment and adapt its control policy accordingly (Franklin et al., 2008). Because excessive co-activation is energy-consuming (Franklin et al., 2004), it is expected that the CNS can quickly adapt the stiffness geometry to the instability of the environment. However, so far the build-up of this stability representation and the adaptation of the control policy have only been investigated over the time course of repeated trials with the same instability (Franklin et al., 2003b; 2004). The results of the present study suggest that the modification of the endpoint stiffness not only takes place between trials, but may also take place as an online process within a trial. The longer force build-up times for the more curved objects suggest that modification of the endpoint stiffness may be an online process that is, at least partially, feedback driven.
Apart from this stiffness adaptation during the trial, we also found indications for a stiffness memory across trials. First, for the object of highest curvature, all stiffness measures were similar for the blocked and random session. However, the slope with which the total stiffness and Kyy decreased with decreasing object curvature was lower for the random session, ultimately resulting in higher total stiffness and Kyy for the ‘cup’ and object of lowest curvature. This presumably is a reflection of the stiffness adaptation process that progresses over trials. Second, in the random session there was a systematic effect of the previous trial on the observed stiffness in the present trial. Such effects have been reported previously in terms of EMG (Franklin et al., 2008) or the force (Scheidt et al., 2001) while learning a new force field, but not on the endpoint stiffness itself.
Stiffness control for self-generated instability and noise
The present study experimentally confirms that stiffness geometry is adapted to the instability experienced in an isometric force production task. Increasing the stiffness of the limb requires larger muscle activation, which further results in larger force variability due to signal-dependent noise (Jones et al., 2002; Hamilton et al., 2004). This force variability results in movement variability (Harris and Wolpert, 1998) that can be controlled by changing the stiffness geometry (Lametti et al., 2007) and magnitude (Selen et al., 2006a; Selen et al., 2006b). While some researchers have shown that force variability increases with co-contraction (Christou et al., 2007), our result show that this does not necessarily increase kinematic variability. In conclusion, while stiffness control is not a suitable solution for reducing force variability, it can reduce kinematic variability during interactions with objects.
Acknowledgments
The authors would like to thank Ian Howard and James Ingram for technical assistance. This study was supported by the Wellcome Trust and the European grant SENSOPAC IST-2005-028056.
References
- Akazawa K, Milner TE, Stein RB. Modulation of reflex EMG and stiffness in response to stretch of human finger muscle. J Neurophysiol. 1983;49:16–27. doi: 10.1152/jn.1983.49.1.16. [DOI] [PubMed] [Google Scholar]
- Bennett DJ, Gorassini M, Prochazka A. Catching a ball: contributions of intrinsic muscle stiffness, reflexes, and higher order responses Can. J. Physiol. Pharmacol. 1994;72:525–534. doi: 10.1139/y94-076. [DOI] [PubMed] [Google Scholar]
- Burdet E, Osu R, Franklin DW, Milner TE, Kawato M. The central nervous system stabilizes unstable dynamics by learning optimal impedance. Nature. 2001;414:446–449. doi: 10.1038/35106566. [DOI] [PubMed] [Google Scholar]
- Carter RR, Crago PE, Keith MW. Stiffness regulation by reflex action in the normal human hand. J Neurophysiol. 1990;64:105–118. doi: 10.1152/jn.1990.64.1.105. [DOI] [PubMed] [Google Scholar]
- Christou EA, Poston B, Enoka JA, Enoka RM. Different neural adjustments improve endpoint accuracy with practice in young and old adults. J Neurophysiol. 2007;97:3340–3350. doi: 10.1152/jn.01138.2006. [DOI] [PubMed] [Google Scholar]
- Damm L, McIntyre J. Physiological basis of limb-impedance modulation during free and constrained movements. J Neurophysiol. 2008;100:2577–258. doi: 10.1152/jn.90471.2008. [DOI] [PubMed] [Google Scholar]
- Darainy M, Malfait N, Gribble PL, Towhidkhah F, Ostry DJ. Learning to control arm stiffness under static conditions. J Neurophysiol. 2004;92:3344–3350. doi: 10.1152/jn.00596.2004. [DOI] [PubMed] [Google Scholar]
- Dolan JM, Friedman MB, Nagurka ML. Dynamic and loaded impedance components in te maintenance of human posture. IEEE Trans Syst Man Cybern. 1993;23:698–709. [Google Scholar]
- Edman KAP, Josephson RK. Determinants of force rise time during isometric contraction of frog muscle fibres. J Physiol (Lond) 2007;580:1007–1019. doi: 10.1113/jphysiol.2006.119982. [DOI] [PMC free article] [PubMed] [Google Scholar]
- Franklin DW, Milner TE. Adaptive control of stiffness to stabilize hand position with large loads. Exp Brain Res. 2003;152:211–220. doi: 10.1007/s00221-003-1540-3. [DOI] [PubMed] [Google Scholar]
- Franklin DW, So U, Kawato M, Milner TE. Impedance control balances stability with metabolically costly muscle activation. J Neurophysiol. 2004;92:3097–3105. doi: 10.1152/jn.00364.2004. [DOI] [PubMed] [Google Scholar]
- Franklin DW, Osu R, Burdet E, Kawato M, Milner TE. Adaptation to stable and unstable dynamics achieved by combined impedance control and inverse dynamics model. J Neurophysiol. 2003a;90:3270–3282. doi: 10.1152/jn.01112.2002. [DOI] [PubMed] [Google Scholar]
- Franklin DW, Burdet E, Osu R, Kawato M, Milner TE. Functional significance of stiffness in adaptation of multijoint arm movements to stable and unstable dynamics. Exp Brain Res. 2003b;151:145–157. doi: 10.1007/s00221-003-1443-3. [DOI] [PubMed] [Google Scholar]
- Franklin DW, Liaw G, Milner TE, Osu R, Burdet E, Kawato M. Endpoint stiffness of the arm is directionally tuned to instability in the environment. J Neurosci. 2007;27:7705–7716. doi: 10.1523/JNEUROSCI.0968-07.2007. [DOI] [PMC free article] [PubMed] [Google Scholar]
- Franklin DW, Burdet E, Tee KP, Osu R, Chew C, Milner TE, Kawato M. CNS learns stable, accurate, and efficient movements using a simple algorithm. J Neurosci. 2008;28:11165–11173. doi: 10.1523/JNEUROSCI.3099-08.2008. [DOI] [PMC free article] [PubMed] [Google Scholar]
- Gomi H, Osu R. Task-dependent viscoelasticity of human multijoint arm and its spatial characteristics for interaction with environments. J Neurosci. 1998;18:8965–8978. doi: 10.1523/JNEUROSCI.18-21-08965.1998. [DOI] [PMC free article] [PubMed] [Google Scholar]
- Gordon J, Ghez C. Trajectory control in targeted force impulses. II. Pulse height control. Exp Brain Res. 1987;67:241–252. doi: 10.1007/BF00248546. [DOI] [PubMed] [Google Scholar]
- Hamilton AFD, Jones KE, Wolpert DM. The scaling of motor noise with muscle strength and motor unit number in humans. Exp Brain Res. 2004;157:417–430. doi: 10.1007/s00221-004-1856-7. [DOI] [PubMed] [Google Scholar]
- Harris CM, Wolpert DM. Signal-dependent noise determines motor planning. Nature. 1998;394:780–784. doi: 10.1038/29528. [DOI] [PubMed] [Google Scholar]
- Hasan Z. The human motor control system’s response to mechanical perturbation: should it, can it, and does it ensure stability? J Mot Behav. 2005;37:484–493. doi: 10.3200/JMBR.37.6.484-493. [DOI] [PubMed] [Google Scholar]
- Hoffer JA, Andreassen S. Regulation of soleus muscle stiffness in premammillary cats: intrinsic and reflex components. J Neurophysiol. 1981;45:267–285. doi: 10.1152/jn.1981.45.2.267. [DOI] [PubMed] [Google Scholar]
- Hogan N. Adaptive control of mechanical impedance by coactivation of antagonist muscles. IEEE Trans Auto Control. 1984;29:681–690. [Google Scholar]
- Howard IS, Ingram JN, Wolpert DM. A modular planar robotic manipulandum with end-point torque control. J Neurosci Methods. 2009 doi: 10.1016/j.jneumeth.2009.05.005. doi:10.1016/j.jneumeth.2009.05.005. [DOI] [PubMed] [Google Scholar]
- Jones KE, Hamilton AFC, Wolpert DM. Sources of Signal-Dependent Noise during isometric force production. J Neurophysiol. 2002;88:1533–1544. doi: 10.1152/jn.2002.88.3.1533. [DOI] [PubMed] [Google Scholar]
- Kearney RE, Hunter IW. Dynamics of human ankle stiffness: variation with displacement amplitude. J Biomech. 1982;15:753–756. doi: 10.1016/0021-9290(82)90090-2. [DOI] [PubMed] [Google Scholar]
- Kearney RE, Stein RB, Parameswaran L. Identification of intrinsic and reflex contributions to human ankle stiffness dynamics. IEEE Trans Biomed Eng. 1997;44:493–504. doi: 10.1109/10.581944. [DOI] [PubMed] [Google Scholar]
- Kuechle DK, Newman SR, Itoi E, Morrey BF, An KN. Shoulder muscle moment arms during horizontal flexion and elevation. J Shoulder Elbow Surg. 1997;6:429–439. doi: 10.1016/s1058-2746(97)70049-1. [DOI] [PubMed] [Google Scholar]
- Lacquaniti F, Borghese NA, Carrozzo M. Transient reversal of the stretch reflex in human arm muscles. J Neurophysiol. 1991;66:939–954. doi: 10.1152/jn.1991.66.3.939. [DOI] [PubMed] [Google Scholar]
- Lametti DR, Houle G, Ostry DJ. Control of movement variability and the regulation of limb impedance. J Neurophysiol. 2007;98:3516–3524. doi: 10.1152/jn.00970.2007. [DOI] [PubMed] [Google Scholar]
- MacKay WA, Crammond DJ, Kwan HC, Murphy JT. Measurements of human forearm viscoelasticity. J Biomech. 1986;19:231–238. doi: 10.1016/0021-9290(86)90155-7. [DOI] [PubMed] [Google Scholar]
- McIntyre J, MussaIvaldi FA, Bizzi E. The control of stable postures in the multijoint arm. Exp Brain Res. 1996;110:248–264. doi: 10.1007/BF00228556. [DOI] [PubMed] [Google Scholar]
- Milner TE. Contribution of geometry and joint stiffness to mechanical stability of the human arm. Exp Brain Res. 2002a;143:515–519. doi: 10.1007/s00221-002-1049-1. [DOI] [PubMed] [Google Scholar]
- Milner TE. Adaptation to destabilizing dynamics by means of muscle cocontraction. Exp Brain Res. 2002b;143:406–416. doi: 10.1007/s00221-002-1001-4. [DOI] [PubMed] [Google Scholar]
- Milner TE, Cloutier C. Compensation for mechanically unstable loading in voluntary wrist movement. Exp Brain Res. 1993;94:522–532. doi: 10.1007/BF00230210. [DOI] [PubMed] [Google Scholar]
- Moritz CT, Barry BK, Pascoe MA, Enoka RM. Discharge rate variability Influences the variation in force fluctuations across the working range. J Neurophysiol. 2005;93:2449–2459. doi: 10.1152/jn.01122.2004. [DOI] [PubMed] [Google Scholar]
- Murray WM, Delp SL, Buchanan TS. Variation of muscle moment arms with elbow and forearm position. J Biomech. 1995;28:513–525. doi: 10.1016/0021-9290(94)00114-j. [DOI] [PubMed] [Google Scholar]
- Mussa-Ivaldi FA, Hogan N, Bizzi E. Neural, mechanical, and geometric factors subserving arm posture in humans. J Neurosci. 1985;5:2732–2743. doi: 10.1523/JNEUROSCI.05-10-02732.1985. [DOI] [PMC free article] [PubMed] [Google Scholar]
- Nashner LM. Adapting reflexes controlling the human posture. Exp Brain Res. 1976:59–72. doi: 10.1007/BF00235249. [DOI] [PubMed] [Google Scholar]
- Nichols TR, Houk JC. Improvement in linearity and regulation of stiffness that results from actions of stretch reflex. J Neurophysiol. 1976;39:119–142. doi: 10.1152/jn.1976.39.1.119. [DOI] [PubMed] [Google Scholar]
- Nijhof EJ, Kouwenhoven E. Simulation of multi-joint arm movements. In: Winters JM, Crago PE, editors. Biomechanics and Neural Control of Posture and Movement. Springer-Verlag; 2000. pp. 363–372. [Google Scholar]
- Osu R, Franklin DW, Kato H, Gomi H, Domen K, Yoshioka T, Kawato M. Short- and long-term changes in joint co-contraction associated with motor learning as revealed from surface EMG. J Neurophysiol. 2002;88:991–1004. doi: 10.1152/jn.2002.88.2.991. [DOI] [PubMed] [Google Scholar]
- Perreault E, Kirsch R, Crago PE. Multijoint dynamics and postural stability of the human arm. Exp Brain Res. 2004;157:507–517. doi: 10.1007/s00221-004-1864-7. [DOI] [PubMed] [Google Scholar]
- Perreault EJ, Kirsch RF, Crago PE. Effects of voluntary force generation on the elastic components of endpoint stiffness. Exp Brain Res. 2001;141:312–323. doi: 10.1007/s002210100880. [DOI] [PubMed] [Google Scholar]
- Perreault EJ, Kirsch RF, Crago PE. Voluntary control of static endpoint stiffness during force regulation tasks. J Neurophysiol. 2002;87:2808–2816. doi: 10.1152/jn.2002.87.6.2808. [DOI] [PubMed] [Google Scholar]
- Perreault EJ, Chen K, Trumbower RD, Lewis G. Interactions with compliant loads alter stretch reflex gains but not intermuscular coordination. J Neurophysiol. 2008;99:2101–2113. doi: 10.1152/jn.01094.2007. [DOI] [PMC free article] [PubMed] [Google Scholar]
- Perreault EJ, Crago PE, Kirsch RF. Estimation of intrinsic and reflex contributions to muscle dynamics: a modeling study. IEEE Trans Biomed Eng. 1997;47:1413–1421. doi: 10.1109/TBME.2000.880092. [DOI] [PubMed] [Google Scholar]
- Rack PMH, Westbury DR. The short range stiffness of active mammalian muscle and its effect on mechanical properties. J Physiol. 1974;240:331–350. doi: 10.1113/jphysiol.1974.sp010613. [DOI] [PMC free article] [PubMed] [Google Scholar]
- Pruszynski JA, Kurtzer I, Scott SH. Rapid motor responses are appropriately tuned to the metrics of a visuospatial task. J Neurophysiol. 2008;100:224–238. doi: 10.1152/jn.90262.2008. [DOI] [PubMed] [Google Scholar]
- Rancourt D, Hogan N. Stability in force-production tasks. J Motor Behav. 2001;33:193–204. doi: 10.1080/00222890109603150. [DOI] [PubMed] [Google Scholar]
- Scheidt RA, Dingwell JB, Mussa-Ivaldi FA. Learning to move amid uncertainty. J Neurophysiol. 2001;86:971–985. doi: 10.1152/jn.2001.86.2.971. [DOI] [PubMed] [Google Scholar]
- Selen LPJ, Beek PJ, van Dieen JH. Can co-activation reduce kinematic variability? A simulation study. Biol Cybern. 2005;93:373–381. doi: 10.1007/s00422-005-0015-y. [DOI] [PubMed] [Google Scholar]
- Selen LPJ, Beek PJ, van Dieen JH. Impedance is modulated to meet accuracy demands during goal-directed arm movements. Exp Brain Res. 2006a;172:129–138. doi: 10.1007/s00221-005-0320-7. [DOI] [PubMed] [Google Scholar]
- Selen LPJ, van Dieen JH, Beek PJ. Impedance modulation and feedback corrections in tracking targets of variable size and frequency. J Neurophysiol. 2006b;96:2750–2759. doi: 10.1152/jn.00552.2006. [DOI] [PubMed] [Google Scholar]
- Shadmehr R, Mussa-Ivaldi FA, Bizzi E. Postural force fields of the human arm and their role in generating multijoint movements. J Neurosci. 1993;13:45–62. doi: 10.1523/JNEUROSCI.13-01-00045.1993. [DOI] [PMC free article] [PubMed] [Google Scholar]
- Stein RB, Kearney RE. Nonlinear behavior of muscle reflexes at the human ankle joint. J Neurophysiol. 1995;73:65–72. doi: 10.1152/jn.1995.73.1.65. [DOI] [PubMed] [Google Scholar]
- Tax AA, van der Gon JJ Denier, Erkelens CJ. Differences in coordination of elbow flexor muscles in force tasks and in movement tasks. Exp Brain Res. 1990;81:567–572. doi: 10.1007/BF02423505. [DOI] [PubMed] [Google Scholar]
- van Bolhuis BM, Gielen CC. The relative activation of elbow-flexor muscles in isometric flexion and in flexion/extension movements. J Biomech. 1997;30:803–811. doi: 10.1016/s0021-9290(97)00027-4. [DOI] [PubMed] [Google Scholar]
- van Groeningen CJ, Erkelens CJ. Task-dependent differences between mono- and bi-articular heads of the triceps brachii muscle. Exp Brain Res. 1994;100:345–352. doi: 10.1007/BF00227204. [DOI] [PubMed] [Google Scholar]
- van der Helm FCT, Schouten AC, de Vlugt E, Brouwn GG. Identification of intrinsic and reflexive components of human arm dynamics during postural control. J Neurosci Methods. 2002;119:1–14. doi: 10.1016/s0165-0270(02)00147-4. [DOI] [PubMed] [Google Scholar]
- Venkadesan M, Guckenheimer J, Valero-Cuevas FJ. Manipulating the edge of instability. J Biomech. 2007;40:1653–1661. doi: 10.1016/j.jbiomech.2007.01.022. [DOI] [PMC free article] [PubMed] [Google Scholar]
- Witney AG, Vetter P, Wolpert DM. The influence of previous experience on predictive motor control. Neuroreport. 2001;12:649–653. doi: 10.1097/00001756-200103260-00007. [DOI] [PubMed] [Google Scholar]
- Zhang L, Rymer WZ. Simultaneous and nonlinear identification of mechanical and reflex properties of human elbow joint muscles. IEEE Trans Biomed Eng. 1997;44:1192–1209. doi: 10.1109/10.649991. [DOI] [PubMed] [Google Scholar]