Figure 2.

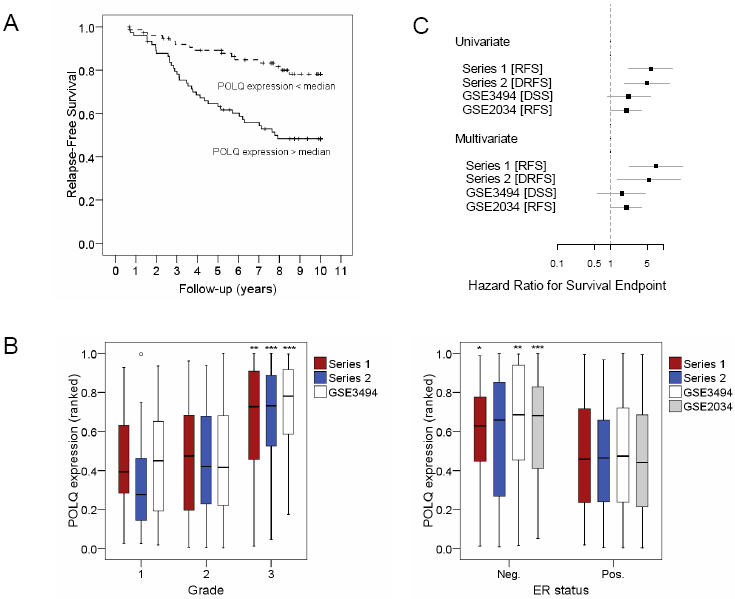
POLQ expression is prognostic in breast cancer independently from clinico-pathological variables. A) Univariate analysis in 152 breast cancers (Series 1). POLQ expression is divided in two groups by median value. B) POLQ expression is associated with tumour grade (left) and ER status (right) in Series 1 and 2 described in this study (Affymetrix and Illumina arrays respectively) and two published series (Affymetrix arrays, see Methods), although grade information was not available for GSE2034. Boxes summarize the median, quartiles and extreme values of POLQ expression in the different categories. One outlier is shown (circle), defined as case with values between 1.5-3 box lengths from the edge of the box. Mann-Whitney and Spearman Rank Association significance levels for the null hypotheses of POLQ expression not varying with ER and Grade respectively, are indicated on the highest category of each plot:*=p<0.05, **=p<0.01, ***=p<0.001. C) Forest plot of POLQ Hazard Ratio for Survival Endpoints in univariate and multivariate analysis in the 2 series described in this study and 2 published datasets (GEO Ids shown). Dots represent Hazard Ratios of POLQ expression and grey bars the 95% confidence intervals. Dot dimensions are proportional to dataset size. The expression of POLQ is entered in this model as a continuous ranked variable, normalised between 0 (lowest rank) and 1 (highest rank). RFS= Recurrence Free Survival, DRFS=Distant Relapse Free Survival, DSS= Disease Specific Survival.
