

Abstract
Chondroitinase ABC (ChABC) represents a promising therapeutic strategy for the treatment of spinal cord injury due to its potent effects on restoring function to spinal injured adult mammals. However, there is limited mechanistic insight as to the underlying effects of ChABC treatment, where the effects are mediated, and which signalling pathways are involved in ChABC-mediated repair. Here we utilise a transgenic (YFP-H) mouse to demonstrate that cortical layer V projection neurons undergo severe atrophy four weeks following thoracic dorsal column injury and that ChABC is neuroprotective for these neurons following ICV infusion. ChABC also prevented cell atrophy following localised delivery to the spinal cord, suggesting a possible retrograde neuroprotective effect mediated at the injury site. Furthermore, neuroprotection of corticospinal cell somata coincided with increased axonal sprouting in the spinal cord. In addition, Western blot analysis of a number of kinases important in survival and growth signalling revealed a significant increase in phosphorylated ERK1 at the spinal injury site following in vivo ChABC treatment, indicating that activated ERK may play a role in downstream repair processes following ChABC treatment. Total forms of PKC and AKT were also elevated, indicating that modification of the glial scar by ChABC promotes long-lasting signalling changes at the lesion site. Thus, using the YFP-H mouse as a novel tool to study degenerative changes and repair following spinal cord injury we demonstrate, for the first time, that ChABC treatment regulates multiple signalling cascades at the injury site and exerts protective effects on axotomised corticospinal projection neurons.
Keywords: spinal cord injury, proteoglycan, neuroprotection, regeneration, repair, transgenic
A key factor preventing growth and regeneration in the adult mammalian CNS is the presence of chondroitin sulphate proteoglycans (CSPGs) (Busch and Silver, 2007; Galtrey and Fawcett, 2007). CSPGs are inhibitory extracellular matrix molecules present throughout development and in the adult and are important for guidance and stability (Faissner and Steindler, 1995). CSPGs become upregulated around CNS injury sites (Asher et al., 2000, 2002; Tang et al., 2003; Jones et al., 2003) and are potent inhibitors of neurite outgrowth for adult neurons (Snow et al., 1990; Dou and Levine, 1994; Smith-Thomas et al., 1994; Davies et al., 1999). Degradation of the glycosaminoglycan (GAG) component of CSPG molecules using chondroitinase ABC (ChABC) renders inhibitory substrates more permissive to growth (McKeon et al., 1995; Zuo et al., 1998; Grimpe et al., 2005) and, when delivered in vivo, enhances axon regeneration (Moon et al., 2001; Bradbury et al., 2002; Chau et al., 2004; Houle et al., 2006; Cafferty et al., 2007; Massey et al., 2008), plasticity and sprouting (Pizzorusso et al., 2002; Massey et al., 2006; Barritt et al., 2006; Cafferty et al., 2008) following CNS injury. More importantly, beneficial effects on functional recovery following ChABC treatment have been demonstrated in spinal injured adult rats in a number of experimental paradigms, including improvements in locomotor and proprioceptive function after dorsal column injury (Bradbury et al., 2002), locomotion and bladder function after compression injury (Caggiano et al., 2005), locomotion after complete transection (Fouad et al., 2005) and forelimb symmetry after hemisection (Yick et al., 2004). The effectiveness of ChABC treatment has also recently been demonstrated in larger mammals, with ChABC treatment promoting skilled locomotor recovery in spinal injured adult cats (Tester and Howland, 2008).
Thus, ChABC treatment is emerging as one of the most promising therapeutic strategies for the treatment of spinal cord injury. However, mechanistic insight into underlying repair mechanisms remains limited (Bradbury and McMahon, 2006; Crespo et al., 2007). While the majority of studies have focused on studying regeneration and sprouting of injured axons, little is known about responses at the level of the cell soma of injured neurons following spinal cord injury, whether repair is mediated at the cell body or the injury site, and which intracellular signalling cascades may be regulated by ChABC treatment. Here we utilise a yellow fluorescent protein (YFP)– expressing mouse (YFP-H line) (Feng et al., 2000) to visualise the entire corticospinal tract (CST), from the cell bodies in layer V of the cortex through to their projecting axons in the spinal cord. Using this transgenic methodology as a novel tool to study degenerative changes following spinal cord injury we demonstrate that ChABC treatment prevents atrophy of corticospinal projection neurons following a thoracic dorsal column lesion. Neuroprotective effects may originate at the injury site since treatment of cell bodies and/or the spinal cord resulted in similar rescue effects, and also corresponded with increased sprouting of injured axons and regulation of multiple signalling cascades in the spinal cord. These findings demonstrate neuroprotection as a novel mechanism underlying the reparative effects of ChABC following spinal cord injury.
Materials and Methods
YFP-H mice
YFP-H mice (B6.Cg-TgN(Thy1-YFP-H)2Jrs, Jackson Laboratories, Bar Harbor, USA), originally described by Feng et al. (Feng et al., 2000), were received as a generous gift from Dr Michael Coleman (The Babraham Institute, Cambridge). The YFP-H line was maintained as transgenic heterozygotes by a transgenic × homozygous wildtype (C57 BL/6; Harlan UK Ltd., Bicester, UK) cross. YFP-positive mice were phenotyped as previously described (English et al., 2005). Briefly, ear notches were taken under minimal restraint at weaning on postnatal day 21 then the skin was pulled apart with fine forceps to expose the subcutaneous tissue, and mounted onto a microscope slide for examination under fluorescein isothiocyanate (FITC) illumination (Carl Zeiss, Axioplan 2). Animals were considered positive for the YFP transgene if fluorescent peripheral axons were observed.
Animals and experimental groups
Eighty-two adult male and female YFP-positive mice (12 weeks old, 20-25 g) were used in these studies. For assessment of pyramidal layer V neuronal degeneration over time, animals received a spinal cord injury and were perfused at 2 weeks (n = 4) or 4 weeks (n = 4) post-lesion; sham surgery animals served as uninjured controls (n = 4). To determine the appropriate region of the cortex for assessing degenerative changes following injury a further group of naïve (n=3) and spinal injured (n =3) animals received an injection of Fast Blue tracer and tissue was taken at either 1 week (injection only) or four weeks (injection + lesion) after surgery. For determining neuroprotective effects following treatment, animals received a spinal cord injury and were treated with a control enzyme (penicillinase, ICV delivery, n = 12) or ChABC (ICV delivery, n = 12; IT delivery, n = 12). Tissue was processed at 4 weeks post-lesion for analysis of neuroprotection (n = 4 per group) and Western blotting (n = 4 per group) and immunohistochemical analysis (n = 4 per group) with n = 4 uninjured controls included in each condition. In a further group of spinal-injured animals, apoptosis was assessed using a TUNEL assay at one week (n = 4) and four weeks (n = 4) post injury, with n = 4 sham operated controls in each case.
Spinal cord injury and cannulation surgery
All surgical procedures were performed in accordance with U.K. Home Office regulations (European Communities Council Directive of 24 November 1986 (86/609/EEC)) and sterile precautions were used throughout. Mice were anaesthetised with Avertin mouse anaesthetic (1.25 g 2,2,2-tribromoethanol / 100 ml tert-amyl alcohol; both Sigma, Poole, U.K.; diluted to 20mg/ml with saline) administered i.p (0.5 ml / 20 g), with re-administration as a half dose as required. For ICV cannulation, anaesthetised mice were placed into a stereotaxic frame, the skull was exposed and a hole made with a 25-gauge needle (with coordinates −0.5 mm from Bregma, 1mm lateral to the midline). A steel cannula composed of an insertion end made of a 26-gauge needle with a 90° bend at 2.5 mm and an exposed end, connected to 30 mm long flexible silastic tubing (VWR, UK) was inserted into the hole and secured into place using cyanoacrylate gel (RS Components, UK). The skin over the skull was sutured with 6-0 Vicryl sutures (Ethicon, Johnson & Johnson Intl) leaving only the tubing exposed. For IT cannulation, a partial laminectomy was performed at the T10 spinal level. Following application of lignocaine, the dura was incised and 20 mm Micro-Renathane tubing (inner diameter 0.12 mm, outer diameter 0.25 mm; Braintree Scientific, MA, USA) attached to 40 mm silastic tubing was inserted 5 mm intrathecally to lie just rostral to the T12 spinal segment and anchored to the rostral vertebral bone with cyanoacrylate gel. The other end was guided under the skin and externalised and secured as above. Animals were placed on a heated blanket during recovery, before being returned to their home cage. One day after cannulation surgery mice were re-anaesthetised with Avertin, as above, and received a dorsal column crush injury. Surgery was adapted from methods described previously for rats (Bradbury et al., 1999; Bradbury et al., 2002). Briefly, mice were prepared for surgery by shaving and disinfecting the dorsal surface of the back. Following incision, muscle tissue was cleared from the dorsal processes of the lower thoracic vertebrae and a laminectomy was performed to expose the dorsal surface of the T12 spinal cord. A piece of gelfoam soaked with lignocaine (0.2%) was placed on the spinal cord for 2 mins, then the dura was opened. Lignocaine was reapplied, as above, and then the exposed dorsal columns were crushed to a depth of 0.5 mm into the cord using a pair of fine forceps (Fine Science Tools, Inc), which were held in place for 10 seconds before being removed. The muscle and skin layers were sutured with 6-0 Vicryl sutures. Mice were placed on a heated blanket during recovery, before being returned to their home cage. Control mice received sham surgery, which was identical to the above up to the laminectomy after which the muscle and skin layers were sutured with 6-0 Vicryl sutures without lesion.
ICV delivery of ChABC
Immediately after the dorsal column lesion, mice received either 6 μl (10 U/ml) high-purity, protease-free ChABC (Seikagaku Corporation, Japan) or penicillinase (Sigma, same μg protein delivered) followed by a 3 μl saline flush. Treatment was delivered as a slow bolus IT or ICV injection using a Hamilton syringe inserted into the externalised cannula tubing, with tubing sealed after injection with cyanoacrylate gel. Mice received further bolus injections on days 2, 4, 6, 8 and 10 following dorsal column lesion, with injections performed under isoflurane anaesthesia (Abbott Laboratories Ltd; 5% induction and 2% maintenance).
Fast Blue retrograde tracing
To determine the appropriate cortical level and regions of interest for analysing degenerative changes in corticospinal neurons following thoracic spinal cord injury retrograde tracing was undertaken using Fast Blue. Briefly, the T12 spinal cord was exposed as above and a drawn glass micropipette (external tip diameter < 15 μm) was advanced through the dorsal columns using a Narishige hydraulic manipulator. Fast Blue (0.5 μl, 2%; Sigma) was injected at depths of 0.4 mm and 0.3 mm from the surface of the spinal cord. The micropipette was left in situ for 20 seconds before being withdrawn. In a second group of mice, a dorsal column crush lesion was then performed at the site of injection, as above.
Tissue processing
For analysis of cortical layer V neurons, mice were deeply anaesthetised with pentobarbitone (80 mg/kg, ip) and transcardially perfused with 10 ml heparinised saline followed by 50 ml paraformaldehyde (4% in 0.1M phosphate buffer). Brains and spinal cords were dissected, post-fixed in 4% paraformaldehyde (2 h at 4°C) and transferred to PBS (plus 0.1% sodium azide) then embedded in gelatin (10%, 300 bloom, Sigma).
Gelatin blocks were hardened in 4% paraformaldehyde and then 40 μm free floating serial coronal sections were cut on a vibratome (Leica) and collected in 24-well plates containing PBS (plus 0.1% sodium azide). For immunohistochemical analysis, animals were perfused as above (with the addition of 15% picric acid) and post-fixed tissue was transferred to 20% sucrose (in 0.1M PB, overnight at 4 °C) then blocked in OCT embedding compound (BDH, Essex, UK) for cryostat sectioning. Sagittal spinal cord sections (20 μm) were thaw mounted onto superfrost plus slides and coronal brain sections (30 μm) were collected and stored free-floating as above. For Western blot analysis, following a rapid transcardial saline flush, tissue pieces from the spinal cord were fresh dissected and snap frozen in liquid nitrogen. To minimise sampling inconsistencies the injury site was routinely identified by the site of laminectomy and injury adhesions on the cord surface. A 4 mm tissue piece spanning the lesion site (with the lesion centred) was dissected.
Analysis of cell size
All photomicrographs were acquired under FITC, DAPI and TRITC illumination, using a Carl Zeiss AxioImager Z1 microscope and Zeiss MRm AxioCam. High magnification images were acquired as Z-stacks, (1.5 μm Z interval) using an ApoTome imaging system fitted to the AxioImager Z1 microscope.
Analysis of YFP-labelled neurons after injury and treatment: Cortical regions for analysis of CSN cell size were selected according to the distribution of Fast Blue-labelled CSNs retrogradely traced from the site of a T12 dorsal column injury. Dual labelling of Fast Blue tracing and YFP-positive cortical neurons were viewed in the coronal plane using AxioVision LE V4.6.1 (Carl Zeiss Imaging, Germany) in serial sections from +0.14mm through −0.46 mm, corresponding to Bregma. The area containing Fast Blue-labelled cells spanned an 800 μm region of cortical layer V, located 400 μm lateral to the midline interhemispheric fissure. Therefore, for analysis of cell size following spinal cord injury, one section per animal corresponding to Bregma +0.14 mm, Bregma −0.10 mm and Bregma −0.46 mm (Paxinos and Franklin, 2001) were selected and a box (800 × 400 μm) was positioned over cortical layer V, 400μm from the interhemispheric fissure. The profiles of all YFP-positive layer V neurons within this area (which contained ~100 cells per section) were then outlined using AxioVision analysis package, by an investigator blinded to the treatment groups. The bound diameter of each profile was recorded and a circular area was then derived for each profile. Size/frequency distributions were tabulated for each animal and a mean distribution calculated for each treatment group.
Comparison of YFP and retrograde labelling: In order to directly compare measurements of CSN cell size using intrinsic YFP-labelling in the YFP-H mouse with more traditional tracing methods, cell size distributions were determined separately for YFP-labelled neurons and Fast Blue-labelled neurons in animals which had undergone either a single intraspinal injection of Fast Blue or injection of Fast Blue plus dorsal column crush lesion. Photomicrographs were opened in AxioVision analysis software and the profiles of all YFP-positive layer V neurons and all Fast Blue labelled neurons, sampled as above, were outlined separately in dual-labelled images. Size/frequency distributions were then determined separately for both markers allowing a direct comparison of the two labels.
Analysis of cell survival
The total YFP-positive cell count within the sampling area was recorded from one tissue section per animal and a mean cell count determined for each group. For assessment of TUNEL reactivity in layer V following spinal cord injury, triple-labelled (YFP/TUNEL/DAPI) high power ApoTome Z stack images were acquired through the region of interest. In the resultant images, co-localisation of TUNEL staining with a DAPI-labelled nuclear profile was defined as an apoptotic cell and all TUNEL-reactive cells residing in layer V were counted in three sections per animal. Layer V was defined with reference to the distribution of DAPI-reactive nuclei and YFP-labelled pyramidal neurons.
Analysis of fibre growth at the spinal cord injury site
The growth of intrinsically labelled YFP fibres was assessed within the lesion epicentre. The borders of the lesion were defined by the abrupt halting of YFP-labelled descending CST and ascending dorsal column axons, with the lesion epicentre apparently devoid of YFP-labelling (see Figure 7B). This allowed an unimpeded view of fine YFP-labelled fibres growing within the lesion epicentre. The total number of YFP-labelled fibres within this zone was quantified in three sagittal sections through the dorsal funiculus per animal by an investigator blind to the treatment group. Mean fibre counts were then calculated for each treatment group.
Figure 7. ChABC treatment degrades CSPGs at the site of spinal cord injury and promotes regeneration of YFP labelled fibres.

Sagittal section of the naïve (A) and injured (B-I) YFP-H mouse spinal cord shows that crush injury to the dorsal columns (B) disrupts the main descending CST projection (long arrows) and the ascending dorsal column projection (arrowheads), leaving the ventral tracts intact (short arrows). At the injury epicentre (asterisks), C-4-S immunolabelling of degraded matrix CSPGs (red) is absent in penicllinase treated animals (C), but both intrathecal (D) and intracerebroventricular (E) delivery of ChABC results in extensive digestion of CSPGs within the lesion site, the surrounding scar and extending rostrocaudally in white matter tracts (arrowheads). Low (F,H) and high (G,I) power images show that the lesion epicentre is devoid of YFP-labelled fibres in penicillinase treated animals (F,G). In contrast, following IT ChABC treatment, numerous small YFP-labelled fibres are apparent (H,I) indicating regenerative growth of lesioned YFP-labelled axons into the modified scar. Scale bars = 500 μm (A-E), 100 μm (F,H) and 20 μm (G,I).
Immunohistochemistry and TUNEL staining
TUNEL staining: TUNEL labelling was performed using an indirect ApopTag Red in situ apoptosis detection kit (Millipore, UK) according to the manufacturer’s instructions. Briefly, sections were permeabilised in PBS plus 0.5% Triton X-100 (10 min), treated with equilibration buffer (5 min, room temperature) and then incubated in a humidified atmosphere with terminal deoxinucleotidyl transferase (TdT), in a reaction buffer containing deoxigenin-dUTP, (1 hr, 37 °C). Sections were then incubated under agitation in stop/wash buffer (10 min) and washed in 3 changes of PBS before incubation in rhodamine-conjugated anti-deoxigenin antibody (30 min, room temperature). Negative control tissue was treated as above with the omission of active TdT enzyme. As a positive control, cortical tissue was prepared by pre-treatment with DNAseI. Sections were treated with DN buffer (30 mM Tris pH 7, 4 mM MgCl2, 0.1 mM DTT; 5 min) before incubation with DNAseI solution (1000 U/ml in DN Buffer; 10 min, room temperature). Pre-digested sections were washed in 6 changes of double distilled water prior to TUNEL processing as described above. TUNEL-reacted sections were coverslipped in Vectashield mounting medium containing 0.5 μg/ml DAPI as a nuclear counterstain. (Vector Laboratories).
Chondroitin-4-sulphate: in order to assess the CSPG-GAG digestion, brain and spinal cord sections were processed for chondroitin-4-sulphate (C-4-S) immunostaining to reveal digested sugar stub regions as previously described (Barritt et al., 2006). Briefly, sections were incubated in the following (with three PBS washes between each step): hydrogen peroxide (0.3%, 30 min), mouse anti-C-4-S (1:5000, overnight; ICN Biochemicals, Aurora OH), biotinylated horse anti-mouse secondary antibody (1:400, 90 min; Jackson ImmunoResearch, West Grove, PA), ABC reagent (1:250, 20 min; Vector Laboratories), biotinyl tyramide (1:75, 10 min; PerkinElmer Life Sciences, Boston MA), and extra-avidin TRITC (1:200, 2 hr; Sigma). Free floating brain sections were slide-mounted and all slides were cover-slipped with Vectashield mounting medium.
Wisteria floribunda agglutinin: To evaluate degradation of CSPGs within cortical peri-neuronal nets (PNNs), free-floating brain sections were processed for WFA histochemistry by incubation in the following: biotin-conjugated Wisteria floribunda agglutinin (WFA, 10 μg/ml, overnight; Sigma) and then extra-avidin TRITC (1:200, 2 hr, Sigma). Sections were mounted and coverslipped as above. For quantification of cortical PNN labeling, the region of interest was defined relative to the interhemispheric fissure (as above) and the total number of WFA-reactive profiles was quantified across all cortical layers in 2sections/animal by an investigator blind to the treatment group. Mean counts were then derived for each treatment group.
Western blotting
Samples were homogenised in ice-cold lysis buffer (20 mM Tris pH 8, 137 mM NaCl, 10% glycerol, 1% Nonidet P-40, 2 mM EDTA, 1 mM PMSF, antipain, anti-leupeptin, pepstatin (all 10 μg/ml), 1mM sodium vanadate, 5 mM NaF). Lysates were left under agitation for 2hr on ice before centrifugation (1200 rpm, 20 min, 4 °C) and collection of the supernatant. The protein concentration of lysates was estimated using a colorimetric protein assay according to the manufacturer’s instructions (BCA protein assay, (Pierce UK). 15 μg of total protein from each sample was electrophoresed in loading buffer (60 mM TrisCl pH 6.8, 2% SDS, 2% beta-mercaptoethanol, 10% glycerol, 0.01% bromophenol blue) across a 10% acrylamide gel (2 hr at 120 mV). Proteins were transferred to a nitrocellulose membrane using a semi-dry transfer method (45min, 15 mV). Membranes were then blocked in skimmed milk (10%, 1hr) prior to incubation with a phospho-specific primary antibody: rabbit anti-phospho(thr202/tyr204)p44/42 MAPK, rabbit anti-phospho(βII ser660)PKC (pan), rabbit anti-phospho(ser473)AKT, rabbit anti-phospho(ser9)GSK3β (all 1:1000, overnight; Cell Signalling, Beverly, MA) and mouse anti-beta-III tubulin (1:1000, overnight; Promega, Maddison, WI). Membranes were washed and then incubated with secondary antibodies (Donkey anti-rabbit IRDye 800, goat anti-mouse IRDye 680, 1 hr; LiCor Biosciences) and visualised using Odyssey Infrared imaging system (LiCor Biosciences UK, Cambridge). Membranes were stripped for 45 min at 50 °C in stripping buffer (2% SDS, 0.8% beta-mercaptoethanol, 12.5% TrisCl pH 6.8), blocked again in skimmed milk and re-probed for the corresponding non-phosphorylated form of each kinase: rabbit anti-AKT, rabbit anti-p44/42 MAPK, rabbit anti-GSK3β (all, 1:1000, overnight; Cell Signalling) or rabbit anti-PKC βII (1:500, Santa Cruz Biotechnology). Integrated band intensities for phosphorylated and total forms of each kinase and beta-III-tubulin were quantified for each sample using Odyssey software. Densitometric values for target proteins or phosphoproteins were normalised against the β-III-tubulin loading control for each sample and mean expression data was calculated from 4 animals per treatment group.
Statistical analysis
For analysis of corticospinal somata size, size/frequency distributions were plotted as histograms representing mean frequency ± SEM for each treatment (n = 4 per group). Using SPSS 16.0 (SPSS Inc), pairwise statistical comparisons of cell size distributions were made between sham, lesion plus penicillinase, lesion plus ICV ChABC and lesion plus IT ChABC using a two-sample Kolmogorov Smirnov test. Tests were performed against a significance threshold of 0.01 to correct for multiple testing. Quantification of YFP-positive fibre growth and WFA-labelled PNN staining was compared between lesion plus penicillinase, lesion plus ICV ChABC and lesion plus IT ChABC groups (n = 4 per group) using a one way ANOVA with Tukey post-hoc analysis. Densitometric quantifications of Western blots, normalised against loading control, were compared between treatment groups (n = 4 per group) using one way ANOVA with block design and Tukey post-hoc analysis.
Results
Expression of YFP in the naïve YFP-H mouse
Since YFP labels neurons in their entirety (including cell bodies, axons, nerve terminals, dendrites and dendritic spines) (Feng et al., 2000), the CST projection was examined in serial sections throughout the neuraxis of naïve YFP-H mice. In sagittal sections through the brain, intense YFP expression was observed in layer V pyramidal neurons in the cortex (Fig. 1A,B), where the cell bodies of corticospinal neurons (CSNs) reside, and in projecting fibre bundles within the internal capsule (Fig. 1A) and the pyramids of the brainstem (Fig. 1B). Other regions of the brain expressing YFP included neurons in the CA1 field of the hippocampus and the granule cell layer of the dentate gyrus and some midbrain and brainstem nuclei (Fig. 1A,B). Intensely labelled CST projections could be clearly visualised in transverse sections through the brainstem, in the pyramidal tracts (Fig. 1C) and at the level of pyramidal decussation, where the majority of CST axons decussate to project dorsally (Fig. 1D). In the spinal cord, the major CST component in the ventral portion of the dorsal funiculus was intensely labelled at all spinal levels examined (Fig. 1E,F). Other spinal cord systems also expressed YFP, including some ascending dorsal column axons, projections in the lateral and ventral columns and motoneurons (Fig. 1E,F). Thus, in the YFP-H mouse CSNs are labelled in their entirety, with both cell bodies and their spinally projecting axons easily identifiable. This provides a unique opportunity for studying changes in this important descending projection following spinal cord injury.
Figure 1. YFP labels corticospinal neurons in their entirety in the YFP-H mouse.

Sagittal sections through the brain (A,B) identifying YFP expression in the naïve YFP-H mouse. (A) Intense labelling is observed in the cell bodies and apical dendrites of layer V pyramidal neurons (inset shows boxed area at high power) and their projecting axons within the internal capsule (arrow). (B) More medially, an intensely labelled bundle of corticospinal tract axons is observed in the pyramidal tract (inset shows boxed area at high power). In transverse sections through brainstem and spinal cord, intense YFP expression in corticospinal tract axons (arrows) is observed bilaterally in the brainstem pyramids (C), the pyramidal tract decussation (D) and in the ventral portion of the dorsal columns in cervical (E) and thoracic (F) spinal cord. Other spinal systems also contain the YFP label, including spinal motoneurons (open arrowhead) and projections in the dorsal (arrowhead), ventral (short arrow) and lateral (open arrow) columns (E). Scale bars = 500 μm (A,B), 200 μm (C-F) and 50 μm (insets).
Thoracic spinal cord injury leads to progressive atrophy, but not death, of corticospinal neurons in the YFP-H mouse
To determine whether degenerative changes could be observed in YFP-labelled pyramidal neurons in layer V of the cortex following a thoracic dorsal column lesion, cell atrophy and death were examined at several post-injury time points. Layer V pyramidal neurons showed progressive pathology following a T12 dorsal column lesion, with evidence of cell atrophy apparent at 2 weeks post-injury, with the somata of many neurons appearing shrunken (Fig. 2C,D), compared to the large healthy pyramidal neurons evident in sham (uninjured) mice (Fig. 2A,B,G). By four weeks post-injury cell atrophy was severe, with a marked shrunken appearance of cell soma (Fig. 2E,F,H). Quantification revealed significant cell shrinkage in lesioned animals compared to sham controls at 4 weeks after injury (Fig. 2I), with a marked shift to the left in cumulative frequency distribution (indicating smaller cell sizes) confirming significant atrophy of layer V pyramidal neurons following thoracic dorsal column injury (P < 0.001, Kolmogorov-Smirnov test; Fig. 2J).
Figure 2. Spinal cord injury induces progressive atrophy of corticospinal neurons in the YFP-H mouse.

Representative low (A,C,E) and high power (B,D,F) images of coronal sections through the YFP-H mouse sensorimotor cortex at Bregma −0.46 mm show injury induced changes in YFP-labelled layer V pyramidal neurons. In naive (uninjured) animals (A,B) many large healthy pyramidal somata are apparent; arrows denote region of interest. Following thoracic dorsal column lesion, progressive atrophy of these cells is observed at two (C,D) and four (E,F) weeks post injury. Higher magnification images (G,H) highlight the striking contrast between large healthy somata in naïve YFP-H mouse cortex (G, arrows) and severely atrophied somata at 4 weeks following spinal cord injury (H, arrow heads). Cell size distribution histogram (I) and cumulative frequency (J) plots demonstrate that YFP-labelled pyramidal neurons have undergone significant shrinkage at four weeks post lesion, with a significant leftward shift in cell size distribution towards smaller cell areas, compared to sham controls (Two sample Kolmogorov Smirnov test P < 0.001). Scale bars = 500 μm (A,C,E) and 250 μm (B,D,F) and 25 μm (G,H).
A direct comparison of cell atrophy measurements obtained with intrinsic YFP-labelling compared to a more conventional retrograde tracing method showed the two techniques to give highly comparable measurements of cell soma size and distribution (Fig. 3). In both spinal injured and uninjured YFP-H mice, YFP-labelling of cell soma closely matched Fast Blue cell soma labelling following injection of the tracer into the thoracic spinal cord, (Fig. 3A,B). Cell size distributions (Fig. 3C) and cumulative frequency plots (Fig. 3D) determined from dual-labelled sections showed no significant difference between YFP-labelling and retrograde tracing in either uninjured (tracer injection only) or spinal cord injured (lesion + tracer) YFP-H mice (P > 0.05, Kolmogorov Smirnov test), with both techniques demonstrating a similar degree of CSN atrophy 4 weeks after thoracic spinal cord injury. Thus, intrinsic labelling of layer V projection neurons in the YFP-H mouse provides a reliable marker for measuring CSN cell size and atrophy following spinal cord injury.
Figure 3. Intrinsic YFP labelling enables highly comparable measurements of corticospinal neuron soma size to those obtained with traditional retrograde tracing.

Coronal sections of layer V cortex in the YFP-H mouse following injection of Fast Blue into the naïve (A) or injured (B) thoracic spinal cord. Cell size distribution histograms (C) and cumulative frequency (D) plots were determined separately for YFP-labelled neurons (green) and Fast Blue labelled neurons (blue), in order to directly compare these two labels. Many Fast Blue retrogradely labelled neurons also express YFP, though some are not intrinsically labelled (asterisks). One week following tracer injection (A), many large, rounded corticospinal neuronal soma (arrows) are apparent, but at four weeks following thoracic spinal cord injury, these cells are markedly shrunken (B). At Bregma −0.46mm, the cell size distribution of YFP labelled layer V neurons perfectly matches that of retrogradely labelled CSNs one week after tracer injection. Similarly, four weeks after spinal cord injury, both YFP labelled neurons and retrogradely labelled CSNs undergo atrophy to the same extent, with a significant leftward shift in the cell size distribution towards smaller cell areas (C, D) Cell size distributions determined from YFP and Fast Blue labelled cells are not significantly different after injection only, (P> 0.05, Kolmogorov Smirnov test) or injection plus lesion, (P> 0.05, Kolmogorov Smirnov test), showing that intrinsic YFP-labelling of layer V neurons in the YFP-H mouse, provides a reliable index of CSN somata size. Scale bars = 25 μm.
As well as marked atrophy of surviving cells, there also appeared to be fewer cells in the region of interest following injury, compared to sham controls (Fig. 2A-F). However, the impression of empty space is partly due to the reduced YFP signal in the atrophied cell soma and proximal processes, rather than actual cell loss. Cell counts confirmed that although YFP-labelled CSNs underwent atrophy following thoracic dorsal column lesion, there was no significant cell loss, with mean cell numbers (within the region of interest) of 139 ± 22, compared to 128 ± 14 in sham controls and 4 week injured mice respectively (P = 0.6, 2 sided t-test). Furthermore, assessment of apoptotic cell death by TUNEL assay (Fig. 4) did not reveal any apoptotic nuclei in cortical layer V, at either 1 week (data not shown) or 4 weeks (Fig. 4D) after dorsal column crush injury, suggesting that atrophy was not associated with ongoing apoptotic cell death of lesioned CSNs at these time points.
Figure 4. Lack of TUNEL-reactive apoptosis in layer V projection neurons following thoracic spinal cord injury in the YFP-H mouse.
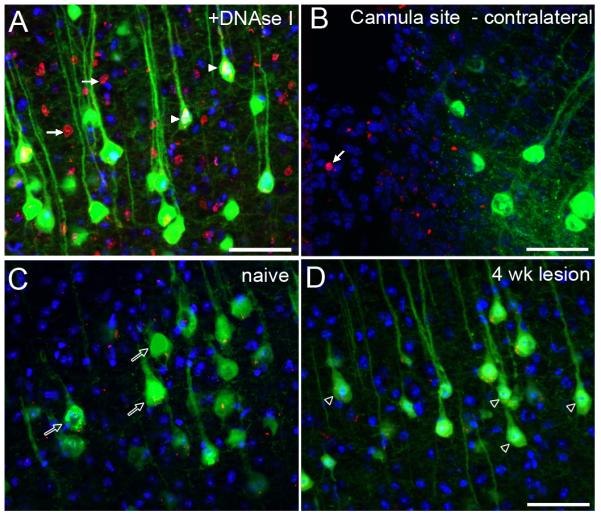
TUNEL labelled coronal sections of layer V cortex in the YFP-H mouse. In control samples, pre-treatment of sections with DNAseI (a positive control) results in extensive TUNEL signal (red) throughout the tissue (A). Many TUNEL-reactive nuclei (arrows) are observed within layer V and TUNEL reactivity can also be detected within the nuclei of YFP-labelled CSNs (arrowheads). At the site of ICV cannulation in the contralateral hemisphere (B), TUNEL-reactive apoptotic nuclei (arrow) are sporadically detected (without pre-treatment of the tissue) in the area of reactive tissue, bordering the cannula site. At Bregma −0.46mm in naïve animals (C), only background labelling is apparent and no TUNEL reactive nuclei are detected within layer V pyramidal neurons (open arrows). Four weeks following dorsal column crush injury (D), no TUNEL reactive nuclei are detected in either YFP-positive CSNs or unlabelled cells, though many YFP labelled somata appear shrunken in size (open arrowheads). Scale bars = 50 μm.
ChABC promotes neuroprotection of corticospinal projection neurons following spinal cord injury in the YFP-H mouse
To determine whether degenerative changes in YFP-labelled pyramidal neurons could be reversed following degradation of CSPGs, cell atrophy was examined at four weeks post-injury in mice subjected to a thoracic dorsal column lesion and treated with penicillinase (a control enzyme treatment) or ChABC, delivered via intracerebroventricular (ICV) infusion. Atrophy was examined in two cortical regions that contained CSNs projecting to the thoracic spinal cord (determined by dual fluorescence of Fast Blue tracing and YFP-H labelling, supplementary Fig. 1) and a third region, Bregma +0.14 mm, which acted as a control region to check for effects in neighbouring uninjured projection neurons (supplementary Fig. 2). At Bregma −0.10 mm and −0.46 mm, cell atrophy was marked at 4 weeks post-injury in animals treated with penicillinase (Fig. 5A,B,F and Supplemental Fig. 3, respectively). In contrast, following ICV ChABC treatment, many more neurons with large normal-looking somata were apparent in both regions (Fig. 5C,D,G and supplemental Fig. 3, respectively). A cell size distribution analysis revealed significant cell shrinkage following injury and penicillinase treatment compared to uninjured sham controls (Fig. 5H), with a significant leftward shift in cumulative frequency distribution confirming significant cell atrophy (Fig. 5I; P < 0.001, lesion plus penicillinase compared to sham controls Kolmogorov-Smirnov). ICV delivery of ChABC following thoracic dorsal column injury led to a reversal of cell atrophy, with fewer cells of small diameter and more cells of large diameter (Fig. 5H,N). This reversal of atrophy was almost complete at Bregma −0.10 mm, with the cumulative frequency curve almost identical to that of the uninjured sham group (Fig. 5I; lesion plus ICV ChABC significantly different from lesion plus ICV penicillinase, P < 0.001, and not significantly different from sham, P = 0.76, Kolmogorov-Smirnov). At Bregma −0.46 mm rescue from atrophy was partial, with the distribution curve following ChABC treatment lying mid-way between the lesion plus penicillinase group and sham controls (supplemental Fig. 3; lesion plus ICV ChABC significantly different from lesion plus penicillinase P < 0.001 and significantly different from sham P < 0.001, Kolmogorov-Smirnov). Thus, ICV delivery of ChABC can prevent the atrophy that occurs in the cell bodies of corticospinal neurons following injury to their axonal projections in the spinal cord.
Figure 5. ChABC treatment, via two distinct methods of delivery promotes neuroprotection of corticospinal projection neurons following spinal cord injury in the YFP-H mouse.

In coronal sections through the YFP-H sensorimotor cortex at Bregma −0.10mm (A-I), representative low (A,C) and high power (B,D) images show many more large healthy YFP-labelled somata in the sensorimotor cortex following ChABC treatment (C,D) as compared with penicllinase treated animals (A,B). Higher magnification images highlight the shift in cell size from large healthy cell somata in naïve (uninjured) animals (E, arrows) to severely atrophied cells in injured animals treated with penicillinase (F, arrowheads). Following injury and ChABC treatment (G) atrophy is apparent in only a small number of neurons (arrowheads), with the majority retaining normal cell sizes (arrows). Histogram (H) and cumulative frequency (I) plots confirm YFP-labelled CSNs in penicllinase treated animals are significantly reduced in area compared with sham operated animals (P < 0.05 Kolmogorov-Smirnov test). ChABC treatment results in complete rescue of CSNs from injury induced atrophy at Bregma −0.10, with the cell size distribution not significantly different from sham (P > 0.05, Kolmogorov-Smirnov test). Cell size frequency distribution histograms display mean frequency ± SEM, n = 4 per treatment group. Scale bars: 500 μm (A,C), 250 μm (B,D) and 20 μm (E,F,G).
Intrathecal and intracerebroventricular delivery of ChABC promote equivalent protection of lesioned CSNs
Since ICV delivery of ChABC can degrade CSPGs throughout the neuraxis (Garcia-Alias et al., 2008), it is not certain whether neuroprotective effects following ICV delivery of ChABC are mediated via changes at the level of the cell body in the cortex or at the site of the injured axons in the spinal cord. Therefore, the effects of ChABC treatment following intrathecal (IT) administration, which largely restricts delivery of ChABC to the spinal cord, were also determined. Strikingly, the neuroprotective effects following IT treatment were virtually identical to those observed following ICV treatment, with the cell size distribution revealing fewer small diameter cells and many more cells of larger diameter (Fig. 5H) and the cumulative frequency distribution curve perfectly aligned with the ICV ChABC treatment group and the uninjured sham controls, indicating a complete rescue from atrophy at Bregma −0.10 mm (Fig. 5I; lesion plus IT ChABC significantly different from lesion plus penicillinase, P < 0.001 and not significantly different from lesion plus ICV ChABC or sham, P = 0.9, Kolmogorov-Smirnov) and partial rescue at Bregma −0.46 mm (Supplemental Fig 3; lesion plus IT ChABC significantly different from lesion plus penicillinase P < 0.001, and significantly different from sham P < 0.001, Kolmogorov-Smirnov test). Thus, the effects of ChABC on promoting neuroprotection of lesioned CSNs may be mediated at the injury site in the spinal cord, rather than at the cell body. To explore this further, we examined the pattern of CSPG degradation in cortex and spinal cord.
Changes in CSPG extracellular matrix composition in the cortex and spinal cord following ChABC treatment
To determine changes in the extracellular matrix in the region of cortex containing YFP-labelled CSN cell bodies (Fig. 6A) we examined the pattern of CSPG degradation following ChABC treatment using an antibody against C-4-S, the stub epitope remaining after successful CS digestion with ChABC (Moon et al., 2001). In animals treated with penicillinase, no C-4-S immunoreactivity was apparent in the cortex (Fig. 6B). Following IT ChABC treatment, more limited rostral dispersal of ChABC within CSF resulted in a border of C-4-S immunoreactivity superficially, at the pial surface of the cortex (Fig. 6C). However, following ICV delivery of ChABC, C-4-S was also apparent in deep cortical layers (layers V-VI; Fig. 6D), including the region containing layer V YFP-labelled pyramidal neurons, indicating that only ICV treatment reaches the cell bodies of YFP-labelled neurons. Reactivity for WFA, a marker of CSPG-rich PNNs (Pizzorusso et al., 2002) was also examined. In animals treated with penicillinase, abundant WFA labeling was seen in the sensorimotor cortex (mean PNN count ± SEM; 124.3 ±11.8), in particular around neurons in cortical layers IV and VI but, as described previously (Bruckner et al., 1998), not around layer V pyramidal neurons (Fig. 6E). This pattern of reactivity was not significantly altered following IT delivery of ChABC (mean PNN count ± SEM; 118.6 ± 6.3, P = 0.88 One way ANOVA, Tukey post-hoc analysis; Fig. 6F). However, following ICV delivery of ChABC, WFA reactivity was significantly reduced (mean PNN count ± SEM; 77.0 ± 6.0, P = 0.01 One way ANOVA, Tukey post-hoc analysis) and largely absent from neurons in the deeper cortical layers (Fig. 6G), indicating digestion of these CSPG-rich perineuronal nets in neighbouring neurons following ICV, but not IT, delivery. Thus, ICV ChABC treatment leads to changes in the extracellular matrix in the sensorimotor cortex but the neurons affected are principally neighbouring neurons which contain PNNs, rather than the layer V projection neurons. Since ICV and IT ChABC treatment promote an equivalent degree of rescue from atrophy, yet produce such distinct patterns of CSPG digestion in the cortex, we considered the spinal cord as an alternative site of action.
Figure 6. ICV but not IT delivery of ChABC degrades CSPGs close to layer V CSNs.

Degradation of CSPGs in the sensorimotor cortex was evaluated at bregma −0.46mm (A). Immunoreactivity for chondroitin-4-sulphate (C-4-S) epitopes (red) reveals degradation of matrix CSPGs after cleavage of sugar side chains by ChABC (B-D). Representative photomicrographs show no C-4-S immunoreactivity in the sensorimortor cortex of penicllinase-treated animals (B). Following IT delivery of ChABC to the spinal injury site, CSPG digestion is only observed close to the pial surface (C, arrow). ICV delivery of ChABC (D, arrow) results in more extensive CSPG digestion in the cortex, including the area containing layer V YFP-labelled pyramidal neurons (green). Wisteria Floribunda agglutinin histochemistry (E-G) reveals CSPGs within perineuronal nets in the sensorimotor cortex (red). Prominent labelling is observed in cortical layers IV and VI in penicllinase treated animals (E). Labelling of PNNs is unchanged following IT delivery of ChABC (F) but ICV ChABC delivery results in a marked reduction in PNNs in cortical layer VI, close to the cell bodies of YFP-labelled layer V CSNs (G). Scale bars = 200 μm.
Both descending and ascending axon projections were clearly labelled in sagittal sections of uninjured YFP-H mouse spinal cord (Fig. 7A). Four weeks after a dorsal column injury there was a clear disruption of both the descending corticospinal tract and the ascending projection in the dorsal columns, with classic retraction bulbs apparent at the severed axon endings and no evidence of regrowth into the injury site (Fig. 7B). The pattern of CSPG degradation in the spinal cord following ChABC treatment was assessed using the antibody against C-4-S. In lesioned animals treated with penicillinase, no C-4-S immunoreactivity was apparent (Fig. 7C). In contrast, following ChABC treatment C-4-S immunoreactivity was abundant in the lesioned spinal cord, with a similar pattern observed following IT or ICV delivery, with intense immunoreactivity typically apparent within and surrounding the lesion site, as well as in superficial white matter tracts rostral and caudal to the lesion epicentre (Fig. 7D,E, respectively). Thus, in vivo delivery of ChABC degrades CSPGs at the site of a spinal cord injury in the YFP-H mouse. As both ICV and IT ChABC treatment degrade CSPGs at the spinal injury site to a comparable degree, neuroprotective effects may be mediated here rather than at the cell body level in the cortex.
ChABC treatment promotes growth of injured axons in the spinal cord of the YFP-H mouse
We then examined whether ChABC treatment would induce sprouting of injured axons in the spinal cord of the YFP-H mouse, since the response of the cell body to axotomy may depend on the ability of injured axon tips to form growth cones and regenerative sprouts. In the spinal cord of lesioned animals treated with penicillinase there was no evidence of growth of YFP-labelled axons into the lesion site (mean fibre count per section ± SEM; 1.3 ± 0.3; Fig. 7F,G), with the central lesion core virtually devoid of YFP-labelled fibres. In contrast, following IT treatment with ChABC, significantly more fine fibres were observed growing into the lesion site, within the central core of necrotic tissue (mean fibre count per section ± SEM; 5.2 ± 0.9, P = 0.01 One way ANOVA, Tukey post-hoc analysis; Fig. 7H,I) which is known to be highly inhibitory and refractory to regrowth. Similar sprouting effects were observed following injury and ICV ChABC treatment (mean fibre count per section ± SEM; 4.3 ± 0.4; P = 0.04, One way ANOVA, Tukey post-hoc analysis). Thus, in vivo ChABC treatment following spinal cord injury in the YFP-H mouse leads to a robust sprouting response of injured axons at the lesion site, which could have a retrograde effect on cell body survival in the cortex.
ChABC treatment is associated with increased MAPK, AKT and PKC signalling at the spinal cord injury site
We investigated whether ChABC treatment could promote signalling changes in vivo by examining the expression and activation state of several distinct signalling pathways at the site of spinal cord injury four weeks post-injury (a time point where neuroprotection and regenerative sprouting was observed) using Western blot analysis (Fig. 8). Extracellular signal regulated kinases 1 and 2 (ERK1/2, p44/42 MAPK) play an important role in cell survival, growth and differentiation in response to trophic factors and are activated upon threonine and tyrosine phosphorylation by a single upstream protein kinase, ERK kinase. ChABC treatment via both ICV and IT delivery promoted a significant increase in the phosphorylation of ERK1 (p44 MAPK) at the lesion site, as compared with penicillinase-treated controls (Fig. 8A,C; normalised band intensity ± SEM, penicillinase 0.80 ± 0.10; ICV ChABC 1.55 ± 0.13, P = 0.004; IT ChABC 1.30 ± 0.12, P = 0.04; One way ANOVA with block design, Tukey post-hoc analysis). The total expression of ERK1 in ChABC-treated animals was not significantly different to controls at four weeks post injury (Fig. 8B; penicillinase 4.42 ± 1.17; ICV ChABC 4.58 ± 0.81; IT ChABC 4.97 ± 1.12, P > 0.05) and no significant differences in the expression or phosphorylation state of ERK2 (p42 MAPK) were observed (Fig. 8A; densitometry not shown).
Figure 8. ChABC treatment upregulates multiple signalling pathways at the site of spinal cord injury.

Four weeks after dorsal column injury, the expression and activation state of intracellular signalling pathways was evaluated at the site of injury. Representative Western blots and densitometric quantification are shown for p44/42 MAPK (A-C), PKC (D-F), AKT (G-I), and GSK3β (J-L). Treatment with ChABC using either ICV or IT delivery promoted a significant increase in the phosphorylation of p44 MAPK (ERK1) after spinal cord injury as compared with penicillinase treated controls (C), but did not alter the total expression level of the kinase (B). IT delivery of ChABC, but not treatment via ICV delivery, promoted a significant increase in the expression level of the PKC βII isoform (E) and the serine/threonine kinase AKT (H) compared with the penicillinase treated group. The phosphorylation state of PKC (F) and AKT (I) was not significantly changed from control and, neither the expression (K) or phosphorylation (L) of GSK3β in the spinal cord was significantly altered by ChABC treatment. Densitometric values for target proteins or phosphoproteins were normalised against a β-III- tubulin loading control for each sample. Bar graphs represent mean normalised densitometric reading ± SEM of 4 animals per group. * P < 0.05, ** P < 0.01 One way ANOVA with block design using Tukey post-hoc analysis.
Conventional isoforms of protein kinase C (PKC) include the serine/threonine kinases PKCα, PKCβI, PKCβII and PKCγ, which are regulated principally by intracellular calcium and diacylglycerol. Expression of the PKC βII isoform at the site of spinal injury was significantly increased following IT ChABC treatment as compared with penicillinase-treated controls (Fig 8D,E; normalised band intensity ± SEM, penicillinase 64.00 ± 3.46; IT ChABC 95.16 ± 8.23, P = 0.04; One way ANOVA with block design, Tukey post-hoc analysis). PKC expression following ICV ChABC treatment was not significantly different from control (Fig.6E; ICV ChABC 63.63 ± 16.69, P > 0.05), and ChABC treatment had no significant effect on the total phosphorylation state of PKC isoforms at the site of spinal injury (Fig 8F; normalised band intensity ± SEM, penicillinase 24.50 ± 2.99; ICV ChABC 24.01 ± 5.84; IT ChABC 33.70 ± 10.61, P > 0.05; One way ANOVA with block design, Tukey post-hoc analysis).
The serine/threonine protein kinase AKT is a key mediator of survival signalling in neurons (Dudek et al., 1997; Yano et al., 1998), acting downstream of the lipid kinase, phosphatidylinositol-3 kinase. AKT expression at the lesion site was significantly increased in animals treated with ChABC via IT delivery as compared with the penicillinase-treated group (Fig. 8G,H; normalised band intensity ± SEM, penicillinase, 2.70 ± 0.90; IT ChABC 5.21 ± 1.13, P = 0.03; One way ANOVA with block design, Tukey post-hoc analysis). ChABC treatment via ICV delivery did not significantly alter AKT expression (Fig 8H; ICV ChABC 3.17 ± 0.71, P > 0.05; One way ANOVA with block design, Tukey post-hoc analysis) and serine-phosphorylation of the AKT regulatory domain was not significantly different between treatment groups, (Fig 8I; penicillinase 0.21 ± 0.05; ICV ChABC 0.25 ± 0.03; IT ChABC 0.29 ± 0.06, P > 0.05; One way ANOVA with block design, Tukey post-hoc analysis).
Phosphorylation and inhibition of glycogen synthase kinase 3β (GSK3β) is one mechanism by which activated AKT promotes neuronal survival (Cross et al., 1995; Hetman et al., 2000). We investigated whether increased expression of AKT following ChABC treatment was associated with downstream changes to GSK3β. No significant differences in GSK3β expression were detected between penicllinase and ChABC-treated animals (Fig 8J,K; normalised band intensity ± SEM, penicillinase 41.44 ± 3.02; ICV ChABC 37.06 ± 4.24; IT ChABC 39.63 ± 3.10, P > 0.05; One way ANOVA with block design, Tukey post-hoc analysis), and phosphorylation of GSK3β was not significantly different between treatment groups, (Fig 8L; penicillinase 42.97 ± 3.33; ICV ChABC 38.59 ± 3.00; IT ChABC 48.26 ± 5.16; P > 0.05; One way ANOVA with block design, Tukey post-hoc analysis).
Thus, ChABC treatment promoted a significant increase in the activation and expression of several intracellular kinases which play important roles in neuronal survival and outgrowth. ChABC treatment therefore significantly modifies the signalling environment of the injured spinal cord, which may contribute to protective retrograde effects on lesioned CSNs.
Discussion
Using the YFP-H transgenic mouse as a novel method to study degenerative changes and repair, we demonstrate that corticospinal neurons undergo progressive atrophy following thoracic spinal cord injury and that degradation of CSPGs by ChABC restores soma size to that of uninjured controls. We also demonstrate that ChABC administered to the spinal cord injury site has neuroprotective effects equivalent to intracerebroventricular ChABC treatment, which also degrades CSPGs around the cell bodies. We further demonstrate that ChABC treatment regulates several signalling cascades at the site of injury and renders the lesion epicentre more permissive to the in-growth of lesioned fibres. Together this work demonstrates that modification of the extracellular matrix at the spinal cord injury site promotes a protective response in injured projection neurons and represents a novel mechanism underlying ChABC-mediated repair.
The YFP-H mouse as a novel tool for spinal cord injury studies
Degeneration of spinal projection neurons has classically been studied using retrograde tracing methodology and has proved a valuable tool for assessing changes following injury and neuroprotective treatment strategies (Giehl and Tetzlaff, 1996; Kobayashi et al., 1997; Bradbury et al., 1998). Following spinal cord injury in adult rats a number of such studies have provided evidence for both atrophy (McBride et al., 1989;Tang et al., 2004) and apoptotic cell death in injured CSNs (Hains et al., 2003; Sasaki et al., 2006). Other studies have indicated developmental differences in the response of CSNs to axotomy, with cell death observed when CSNs are injured prior to 14 days, but not at later time points following CST innervation of spinal cord targets, when atrophy but not cell death was apparent (Merline and Kalil, 1990). In the present study, using a novel transgenic mouse model, we observed significant atrophy of CSN somata following thoracic spinal cord injury with no evidence for cell loss or apoptosis.
Methodologically, however, injection of tracer dye is prone to variability as well as being invasive. We found that intrinsic labelling of layer V projection neurons in the YFP-H mouse provides a reliable marker for determining CSN cell atrophy following spinal injury, highly comparable with traditional retrograde tracing methods and therefore, the YFP-H mouse line offers a distinct advantage. Furthermore, as layer V pyramidal neurons throughout the forebrain are labelled in the YFP-H mouse, this enables the study of both injured and intact neighbouring pyramidal neurons, not only those back-traced from the lesion. Thus, we were able to study the effects of ChABC on neighbouring cortical neurons that would have been treated by ICV infusion of ChABC but which do not project to the thoracic spinal cord. We found no evidence of cell atrophy or hypertrophy in uninjured neighbouring projection neurons following ChABC treatment, indicating a specific “rescue” effect on injured neurons. Furthermore, YFP-H mouse studies are not restricted to examining effects in only the cell body since the fluorescent protein labels the neuron in its entirety (Feng et al., 2000), allowing the study of both cell bodies in the cortex and projecting axons in the spinal cord. Thus, we were able to observe growth of YFP-labelled fibres within the lesion site following ChABC treatment. As axonal labelling in the spinal cord of the YFP-H mouse is not purely CST, these sprouting fibres are likely to be a mixture of ascending dorsal column as well as CST axons. However, it should be noted that since fibres are pre-labelled, how ChABC treatment might modify the degeneration and clearance of injured axons cannot be determined. Nevertheless, we have previously shown that ChABC treatment promotes regeneration (Bradbury et al., 2002) and sprouting (Barritt et al., 2006) of the injured CST, using conventional tracing techniques. Thus, the apparent growth of intrinsically labelled injured fibres into the lesion epicentre observed here following ChABC treatment supports the hypothesis that the outgrowth and formation of novel contacts by injured axons may provide access to protective cues in the injured spinal cord which promote the rescue of lesioned projection neurons, possibly via a retrograde mechanism.
Is neuroprotection a result of increased sprouting and growth cone formation at the injury site?
In this study the digestion of cortical CSPGs following ICV ChABC treatment was limited and restricted largely to cortical layers neighbouring layer V pyramidal neurons, rather than affecting layer V itself. It remains possible therefore, that ChABC promotes the rescue of injured CSNs, not by directly affecting the cell body, but by modifying the extracellular environment in the dendritic field of these neurons, providing supportive cues to the apical or basal dendrites. The current findings might also suggest however, that neuroprotection of injured projection neurons may be linked to processes of growth at the injury site. For example, growth cone motility may lead to a more robust response at the level of the cell body following injury. Evidence that exposure to CSPGs stimulates the formation of dystrophic growth cones on lesioned sensory axons (Tom et al., 2004) suggests that in the present study reducing CSPG inhibition at the injury site enabled growth cone formation and neurite sprouting which retrogradely promoted rescue of the cell body from atrophy,.
Other factors are known to be important contributors to the lack of growth and repair following spinal cord injury, such as inhibitory factors associated with CNS myelin (Liu et al., 2006; Chaudhry and Filbin, 2007; Gonzenbach and Schwab, 2008) and both anti-Nogo and CSPG degradation strategies have been shown to have potent effects on restoring function to spinal-injured adult rats and on promoting axonal regeneration and sprouting. However, recent studies in adult monkeys have demonstrated that while anti-Nogo therapy promotes sprouting of CST axons at the lesion site following spinal injury (Freund et al., 2006), it does not prevent the shrinkage of CSN somata (Beaud et al., 2008). Thus, regenerative sprouting of injured axons per se may not be a sufficient stimulus to mount a neuroprotective response in the cell body of injured projection neurons. This suggests that there is something specific about the changes in the cellular environment at the spinal cord injury site following CSPG degradation that favours growth and has a retrograde neuroprotective effect. We have identified some of the signalling changes that may be important in this process.
Intracellular signalling changes following spinal cord injury and in vivo ChABC treatment
We found that ChABC treatment following spinal cord injury modified the expression and activation state of several important intracellular kinase cascades in vivo. Signalling changes were apparent two weeks after completion of the ChABC dosing period, indicating that this promotes long-lasting molecular changes to cells at the lesion site. Thus, four weeks after injury the activation of ERK1, indicated by phosphorylation, was significantly elevated in ChABC-treated spinal cord compared with penicillinase-treated controls. Furthermore, the expression level, but not the phosphorylation state, of PKC and AKT was elevated at the injury site following IT ChABC treatment, which may reflect an upregulation of these pathways in response to modification of the extracellular environment. It is not certain from these data, how such changes might affect the response of lesioned projection neurons following spinal cord injury, but these intracellular kinase cascades are known to be involved in processes of growth and survival. For example, ERK1/MAPK cascades are activated by a diverse range of extracellular stimuli and play an important role in cell survival, growth and differentiation in response to trophic factors. In particular, MAPK cascades have an established role in mediating neuronal survival via transcription-dependent mechanisms involving CREB and via the phosphorylation of pro-apoptotic targets (Xing et al., 1996; Bonni et al., 1999). Other evidence suggests a role for ERK signalling in axonal growth (Zhou and Snider, 2006), including activity in the regulation of growth associated cytoskeletal proteins such as MAP1b (Goold and Gordon-Weeks, 2005) and the regulation of local protein synthesis in neuronal growth cones (Campbell and Holt, 2003). AKT is also known to be a critical mediator of survival signalling in neurons (Dudek et al., 1997; Yano et al., 1998) but the role of PKC is less clear. While PKC isoforms are known to play an important role in cytoskeletal reorganisation, plasticity and axonal outgrowth via phosphorylation of regeneration associated genes such as growth associated protein-43 (Aigner et al., 1995; He et al., 1997), PKC pathways have also been implicated in the growth inhibitory activity of myelin and CSPGs, and inhibiting PKC activity can promote regeneration of sensory (but not CST) axons following spinal cord injury (Sivasankaran et al., 2004; Koprivica et al., 2005). The signalling changes at the lesion site reported here following ChABC treatment coincide with favourable anatomical changes, namely the restoration of cell size in injured projection neurons and evidence of growth within the lesion. Thus, at 4 weeks post-injury activation of ERK1 and up-regulation of PKC and AKT may contribute to ChABC-mediated repair. This is the first demonstration of molecular changes occurring in vivo following ChABC treatment and provides key evidence that CSPG degradation modulates the intracellular signalling environment at the spinal cord injury site
Mechanisms underlying neuroprotective effects following ChABC treatment
It has been suggested that degradation of CSPGs may generate repair products, such as CSPG-disaccharides which are neuroprotective to retinal ganglion cells following glutamatergic insult (Rolls et al., 2004). Although the in vivo existence of CSPG-disaccharides remains to be demonstrated, it is likely that enzymatic modification of CSPGs could lead to the release of other bound factors beneficial to repair, since highly sulphated forms of chondroitin sulphate can bind a variety of growth factors and other proteins (Crespo et al., 2007). The MAPK and AKT signalling cascades shown to be altered here are known to be involved in downstream signalling in response to neurotrophic factors (Bonni et al., 1999; Goold and Gordon-Weeks, 2005), suggesting that the neuroprotective effects observed may be due to increased access to neurotrophic factors following ChABC treatment. Indeed, the neuroprotective effects are comparable to classic studies where neuroprotection of axotomised corticospinal and rubrospinal projection neurons has been observed following exogenous delivery of neurotrophic factors (Tetzlaff et al., 1994; Giehl and Tetzlaff, 1996; Kobayashi et al., 1997). While these studies administered neurotrophic factors to axotomised cell bodies, we demonstrate long distance retrograde survival effects with treatment restricted to the injury site, similar to the effects observed following transplantation of neurotrophic factor secreting fibroblasts into the injured spinal cord (Tobias et al., 2003) or olfactory ensheathing cells, whose neuroprotective effects were attributed to elevated levels of BDNF at the spinal injury site (Sasaki et al., 2006).
Thus, using a novel transgenic approach we demonstrate that CSPG degradation promotes neuroprotection of axotomised projection neurons as well as sprouting of injured axons, demonstrating multiple reparative effects of ChABC treatment. Furthermore, we provide key evidence that CSPG degradation modulates the intracellular signalling environment at the spinal cord injury site, which might contribute to these protective effects.
Supplementary Material
Supplementary Figure 1: YFP and Fast Blue dual labelling to identify thoracic projecting corticospinal neurons in the YFP-H mouse.
YFP-labelling in layer V pyramidal neurons is present throughout the forebrain. Thus, to determine the most appropriate cortical regions in which to assess degeneration of YFP-labelled pyramidal neurons following thoracic spinal cord injury, the retrograde tracer Fast Blue was injected into a T12 dorsal column injury site and serial coronal sections through the brain were examined for the presence of YFP- and Fast Blue-labelled neurons (schematic, A). Fast Blue labelled pyramidal neurons were observed in a discrete area within layer V of the sensorimotor cortex (B, inset shows Fast Blue labelled pyramidal neurons at high power). The greatest number of labelled neurons were observed between Bregma + 0.02 mm and −0.7mm. Area M1 of the motor cortex at Bregma −0.10 mm (D) and −0.46 mm (E) contain a high number of neurons lalelled with the Fast Blue tracer. Many of the Fast Blue-labelled neurons (D,E, blue) also expressed YFP (D,E, green), confirming that many of the YFP-labelled layer V pyramidal neurons in these regions are indeed corticospinal projection neurons. Therefore, levels −0.10 mm and −0.46 mm were selected as the optimal regions of interest for assessing degenerative effects of thoracic spinal cord injury and ChABC treatment on YFP-labelled layer V projection neurons. Some YFP-labelled neurons did not contain the Fast Blue label, indicating a proportion of neurons in this region that either do not project to the spinal cord, project to the spinal cord but arborise rostral to the T12 level, or project to the T12 spinal cord but did not take up the tracer. Conversely, some Fast Blue-labelled neurons did not contain the YFP label, indicating the presence of some spinally projecting CSNs that do not express YFP. In areas more rostral and caudal few Fast Blue labelled cells were apparent, for example at Bregma +0.14 mm (C). Thus, most layer V pyramidal neurons at this level do not project to the thoracic cord and would not be affected by a T12 dorsal column lesion. This region was also analysed to determine whether CSPG degradation could lead to hypertrophy of neighbouring uninjured YFP-labelled projection neurons (see supplementary Figure 2). Thus, we have identified cortical regions in the YFP-H mouse where a high proportion of YFP expressing neurons project to the thoracic spinal cord and are susceptible to degenerative changes following thoracic dorsal column injury. Scale bars = 500μm (B-E) and 50 μm (inset).
Supplementary Figure 2: ChABC treatment does not lead to hypertrophy of uninjured YFP labelled projection neurons in the YFP-H mouse cortex.
Cell size distribution analysis was also performed at Bregma +0.14 mm, a cortical region which does not contain cells projecting to the thoracic spinal cord (determined from Fast Blue tracing experiments, see supplementary Figure 1), to determine whether ChABC could cause hypertrophy in uninjured neighbouring projection neurons. Representative low (A,C) and high power (B,D) images of the sensorimotor cortex at Bregma +0.14 mm shows that YFP-labelled somata are similar in appearance following a thoracic dorsal column injury plus either penicillinase (A,B) or ChABC treatment (C,D), with cells appearing normal and no evidence of either atrophy or hypertrophy in this cortical region following lesion and treatment. Cell size distribution histogram (E) and cumulative frequency (F) plots confirm that in this area the cell size distributions were identical in unlesioned sham controls and lesioned animals treated with penicillinase, confirming that there was no evidence of cell atrophy in this region following thoracic spinal injury; furthermore, cell size distributions did not change following ICV or IT delivery of ChABC, indicating that ChABC treatment does not lead to hypertrophy of uninjured projection neurons in the cortex (P > 0.05 Kolmogorov-Smirnov test, all pairwise comparisons). Scale bars = 500 μm (A,C) and 250 μm (B,D).
Supplementary Figure 3: ChABC treatment following spinal cord injury rescues corticospinal projections at bregma −0.46 from lesion-induced atrophy.
At Bregma −0.46mm (A-F), ChABC treatment (C,D) again protects lesioned CSNs from injury-induced atrophy compared with penicillinase treated animals (A,B). Histogram (E) and cumulative frequency (F) distributions show that here ChABC promotes a partial rescue of lesioned CSNs, with the cell size distribution curve mid-way between that of sham uninjured and penicillinase treated injured animals. At both Bregma −0.10mm and −0.46mm, intrathecal and intracerebroventricular treatment with ChABC promote equivalent protection of lesioned CSNs (F). Cell size frequency distribution histograms display mean frequency ± SEM, n = 4 per treatment group. Scale bar = 500 μm (A,C) and 250 μm (B,D).
Acknowledgements
This work was funded by the U.K. Medical Research Council and the International Spinal Research Trust. We thank Jodie Hall, Tom Hutson and Sophie Pezet for expert assistance and Tim Boucher for critical review of the manuscript.
Reference List
- Aigner L, Arber S, Kapfhammer JP, Laux T, Schneider C, Botteri F, Brenner HR, Caroni P. Overexpression of the neural growth-associated protein GAP-43 induces nerve sprouting in the adult nervous system of transgenic mice. Cell. 1995;83:269–278. doi: 10.1016/0092-8674(95)90168-x. [DOI] [PubMed] [Google Scholar]
- Asher RA, Morgenstern DA, Fidler PS, Adcock KH, Oohira A, Braistead JE, Levine JM, Margolis RU, Rogers JH, Fawcett JW. Neurocan is upregulated in injured brain and in cytokine-treated astrocytes. J Neurosci. 2000;20:2427–2438. doi: 10.1523/JNEUROSCI.20-07-02427.2000. [DOI] [PMC free article] [PubMed] [Google Scholar]
- Asher RA, Morgenstern DA, Shearer MC, Adcock KH, Pesheva P, Fawcett JW. Versican is upregulated in CNS injury and is a product of oligodendrocyte lineage cells. J Neurosci. 2002;22:2225–2236. doi: 10.1523/JNEUROSCI.22-06-02225.2002. [DOI] [PMC free article] [PubMed] [Google Scholar]
- Barritt AW, Davies M, Marchand F, Hartley R, Grist J, Yip P, McMahon SB, Bradbury EJ. Chondroitinase ABC promotes sprouting of intact and injured spinal systems after spinal cord injury. J Neurosci. 2006;26:10856–10867. doi: 10.1523/JNEUROSCI.2980-06.2006. [DOI] [PMC free article] [PubMed] [Google Scholar]
- Beaud ML, Schmidlin E, Wannier T, Freund P, Bloch J, Mir A, Schwab ME, Rouiller EM. Anti-Nogo-A antibody treatment does not prevent cell body shrinkage in the motor cortex in adult monkeys subjected to unilateral cervical cord lesion. BMC Neurosci. 2008;9:5. doi: 10.1186/1471-2202-9-5. [DOI] [PMC free article] [PubMed] [Google Scholar]
- Bonni A, Brunet A, West AE, Datta SR, Takasu MA, Greenberg ME. Cell survival promoted by the Ras-MAPK signaling pathway by transcription-dependent and - independent mechanisms. Science. 1999;286:1358–1362. doi: 10.1126/science.286.5443.1358. [DOI] [PubMed] [Google Scholar]
- Bradbury EJ, Khemani S, Von R, King, Priestley JV, McMahon SB. NT-3 promotes growth of lesioned adult rat sensory axons ascending in the dorsal columns of the spinal cord. Eur J Neurosci. 1999;11:3873–3883. doi: 10.1046/j.1460-9568.1999.00809.x. [DOI] [PubMed] [Google Scholar]
- Bradbury EJ, King VR, Simmons LJ, Priestley JV, McMahon SB. NT-3, but not BDNF, prevents atrophy and death of axotomized spinal cord projection neurons. European Journal of Neuroscience. 1998;10:3058–3068. doi: 10.1046/j.1460-9568.1998.00307.x. [DOI] [PubMed] [Google Scholar]
- Bradbury EJ, McMahon SB. Spinal cord repair strategies: why do they work? Nat Rev Neurosci. 2006;7:644–653. doi: 10.1038/nrn1964. [DOI] [PubMed] [Google Scholar]
- Bradbury EJ, Moon LD, Popat RJ, King VR, Bennett GS, Patel PN, Fawcett JW, McMahon SB. Chondroitinase ABC promotes functional recovery after spinal cord injury. Nature. 2002;416:636–640. doi: 10.1038/416636a. [DOI] [PubMed] [Google Scholar]
- Bruckner G, Bringmann A, Hartig W, Koppe G, Delpech B, Brauer K. Acute and long-lasting changes in extracellular-matrix chondroitin-sulphate proteoglycans induced by injection of chondroitinase ABC in the adult rat brain. Exp Brain Res. 1998;121:300–310. doi: 10.1007/s002210050463. [DOI] [PubMed] [Google Scholar]
- Busch SA, Silver J. The role of extracellular matrix in CNS regeneration. Curr Opin Neurobiol. 2007;17:120–127. doi: 10.1016/j.conb.2006.09.004. [DOI] [PubMed] [Google Scholar]
- Cafferty WB, Yang SH, Duffy PJ, Li S, Strittmatter SM. Functional axonal regeneration through astrocytic scar genetically modified to digest chondroitin sulfate proteoglycans. J Neurosci. 2007;27:2176–2185. doi: 10.1523/JNEUROSCI.5176-06.2007. [DOI] [PMC free article] [PubMed] [Google Scholar]
- Cafferty WB, Bradbury EJ, Lidierth M, Jones M, Duffy PJ, Pezet S, McMahon SB. Chondroitinase ABC-mediated plasticity of spinal sensory function. J Neurosci. 2008;28:11998–12009. doi: 10.1523/JNEUROSCI.3877-08.2008. [DOI] [PMC free article] [PubMed] [Google Scholar]
- Caggiano AO, Zimber MP, Ganguly A, Blight AR, Gruskin EA. Chondroitinase ABCI improves locomotion and bladder function following contusion injury of the rat spinal cord. J Neurotrauma. 2005;22:226–239. doi: 10.1089/neu.2005.22.226. [DOI] [PubMed] [Google Scholar]
- Campbell DS, Holt CE. Apoptotic pathway and MAPKs differentially regulate chemotropic responses of retinal growth cones. Neuron. 2003;37:939–952. doi: 10.1016/s0896-6273(03)00158-2. [DOI] [PubMed] [Google Scholar]
- Chau CH, Shum DK, Li H, Pei J, Lui YY, Wirthlin L, Chan YS, Xu XM. Chondroitinase ABC enhances axonal regrowth through Schwann cell-seeded guidance channels after spinal cord injury. FASEB J. 2004;18:194–196. doi: 10.1096/fj.03-0196fje. [DOI] [PubMed] [Google Scholar]
- Chaudhry N, Filbin MT. Myelin-associated inhibitory signaling and strategies to overcome inhibition. J Cereb Blood Flow Metab. 2007;27:1096–1107. doi: 10.1038/sj.jcbfm.9600407. [DOI] [PubMed] [Google Scholar]
- Crespo D, Asher RA, Lin R, Rhodes KE, Fawcett JW. How does chondroitinase promote functional recovery in the damaged CNS? Exp Neurol. 2007;206:159–171. doi: 10.1016/j.expneurol.2007.05.001. [DOI] [PubMed] [Google Scholar]
- Cross DA, Alessi DR, Cohen P, Andjelkovich M, Hemmings BA. Inhibition of glycogen synthase kinase-3 by insulin mediated by protein kinase B. Nature. 1995;378:785–789. doi: 10.1038/378785a0. [DOI] [PubMed] [Google Scholar]
- Davies SJ, Goucher DR, Doller C, Silver J. Robust regeneration of adult sensory axons in degenerating white matter of the adult rat spinal cord. Journal of Neuroscience. 1999;19:5810–5822. doi: 10.1523/JNEUROSCI.19-14-05810.1999. [DOI] [PMC free article] [PubMed] [Google Scholar]
- Dou CL, Levine JM. Inhibition of neurite growth by the NG2 chondroitin sulfate proteoglycan. Journal of Neuroscience. 1994;14:7616–7628. doi: 10.1523/JNEUROSCI.14-12-07616.1994. [DOI] [PMC free article] [PubMed] [Google Scholar]
- Dudek H, Datta SR, Franke TF, Birnbaum MJ, Yao R, Cooper GM, Segal RA, Kaplan DR, Greenberg ME. Regulation of neuronal survival by the serine-threonine protein kinase Akt. Science. 1997;275:661–665. doi: 10.1126/science.275.5300.661. [DOI] [PubMed] [Google Scholar]
- English AW, Meador W, Carrasco DI. Neurotrophin-4/5 is required for the early growth of regenerating axons in peripheral nerves. Eur J Neurosci. 2005;21:2624–2634. doi: 10.1111/j.1460-9568.2005.04124.x. [DOI] [PubMed] [Google Scholar]
- Faissner A, Steindler D. Boundaries and inhibitory molecules in developing neural tissues. Glia. 1995;13:233–254. doi: 10.1002/glia.440130402. [DOI] [PubMed] [Google Scholar]
- Feng G, Mellor RH, Bernstein M, Keller-Peck C, Nguyen QT, Wallace M, Nerbonne JM, Lichtman JW, Sanes JR. Imaging neuronal subsets in transgenic mice expressing multiple spectral variants of GFP. Neuron. 2000;28:41–51. doi: 10.1016/s0896-6273(00)00084-2. [DOI] [PubMed] [Google Scholar]
- Fouad K, Schnell L, Bunge MB, Schwab ME, Liebscher T, Pearse DD. Combining Schwann cell bridges and olfactory-ensheathing glia grafts with chondroitinase promotes locomotor recovery after complete transection of the spinal cord. J Neurosci. 2005;25:1169–1178. doi: 10.1523/JNEUROSCI.3562-04.2005. [DOI] [PMC free article] [PubMed] [Google Scholar]
- Freund P, Schmidlin E, Wannier T, Bloch J, Mir A, Schwab ME, Rouiller EM. Nogo-A-specific antibody treatment enhances sprouting and functional recovery after cervical lesion in adult primates. Nat Med. 2006;12:790–792. doi: 10.1038/nm1436. [DOI] [PubMed] [Google Scholar]
- Galtrey CM, Fawcett JW. The role of chondroitin sulfate proteoglycans in regeneration and plasticity in the central nervous system. Brain Res Brain Res Rev. 2007 doi: 10.1016/j.brainresrev.2006.09.006. [DOI] [PubMed] [Google Scholar]
- Garcia-Alias G, Lin R, Akrimi SF, Story D, Bradbury EJ, Fawcett JW. Therapeutic time window for the application of chondroitinase ABC after spinal cord injury. Exp Neurol. 2008;210:331–338. doi: 10.1016/j.expneurol.2007.11.002. [DOI] [PubMed] [Google Scholar]
- Giehl KM, Tetzlaff W. BDNF and NT-3, but not NGF, prevent axotomy-induced death of rat corticospinal neurons in vivo. European Journal of Neuroscience. 1996;8:1167–1175. doi: 10.1111/j.1460-9568.1996.tb01284.x. [DOI] [PubMed] [Google Scholar]
- Gonzenbach RR, Schwab ME. Disinhibition of neurite growth to repair the injured adult CNS: focusing on Nogo. Cell Mol Life Sci. 2008;65:161–176. doi: 10.1007/s00018-007-7170-3. [DOI] [PMC free article] [PubMed] [Google Scholar]
- Goold RG, Gordon-Weeks PR. The MAP kinase pathway is upstream of the activation of GSK3beta that enables it to phosphorylate MAP1B and contributes to the stimulation of axon growth. Mol Cell Neurosci. 2005;28:524–534. doi: 10.1016/j.mcn.2004.11.005. [DOI] [PubMed] [Google Scholar]
- Grimpe B, Pressman Y, Lupa MD, Horn KP, Bunge MB, Silver J. The role of proteoglycans in Schwann cell/astrocyte interactions and in regeneration failure at PNS/CNS interfaces. Mol Cell Neurosci. 2005;28:18–29. doi: 10.1016/j.mcn.2004.06.010. [DOI] [PubMed] [Google Scholar]
- He Q, Dent EW, Meiri KF. Modulation of actin filament behavior by GAP-43 (neuromodulin) is dependent on the phosphorylation status of serine 41, the protein kinase C site. J Neurosci. 1997;17:3515–3524. doi: 10.1523/JNEUROSCI.17-10-03515.1997. [DOI] [PMC free article] [PubMed] [Google Scholar]
- Hetman M, Cavanaugh JE, Kimelman D, Xia Z. Role of glycogen synthase kinase-3beta in neuronal apoptosis induced by trophic withdrawal. J Neurosci. 2000;20:2567–2574. doi: 10.1523/JNEUROSCI.20-07-02567.2000. [DOI] [PMC free article] [PubMed] [Google Scholar]
- Houle JD, Tom VJ, Mayes D, Wagoner G, Phillips N, Silver J. Combining an autologous peripheral nervous system “bridge” and matrix modification by chondroitinase allows robust, functional regeneration beyond a hemisection lesion of the adult rat spinal cord. J Neurosci. 2006;26:7405–7415. doi: 10.1523/JNEUROSCI.1166-06.2006. [DOI] [PMC free article] [PubMed] [Google Scholar]
- Jones LL, Margolis RU, Tuszynski MH. The chondroitin sulfate proteoglycans neurocan, brevican, phosphacan, and versican are differentially regulated following spinal cord injury. Exp Neurol. 2003;182:399–411. doi: 10.1016/s0014-4886(03)00087-6. [DOI] [PubMed] [Google Scholar]
- Kobayashi NR, Fan DP, Giehl KM, Bedard AM, Wiegand SJ, Tetzlaff W. BDNF and NT-4/5 prevent atrophy of rat rubrospinal neurons after cervical axotomy, stimulate GAP-43 and Talpha1-tubulin mRNA expression, and promote axonal regeneration. J Neurosci. 1997;17:9583–9595. doi: 10.1523/JNEUROSCI.17-24-09583.1997. [DOI] [PMC free article] [PubMed] [Google Scholar]
- Koprivica V, Cho KS, Park JB, Yiu G, Atwal J, Gore B, Kim JA, Lin E, Tessier-Lavigne M, Chen DF, He Z. EGFR activation mediates inhibition of axon regeneration by myelin and chondroitin sulfate proteoglycans. Science. 2005;310:106–110. doi: 10.1126/science.1115462. [DOI] [PubMed] [Google Scholar]
- Liu BP, Cafferty WB, Budel SO, Strittmatter SM. Extracellular regulators of axonal growth in the adult central nervous system. Philos Trans R Soc Lond B Biol Sci. 2006;361:1593–1610. doi: 10.1098/rstb.2006.1891. [DOI] [PMC free article] [PubMed] [Google Scholar]
- Massey JM, Amps J, Viapiano MS, Matthews RT, Wagoner MR, Whitaker CM, Alilain W, Yonkof AL, Khalyfa A, Cooper NG, Silver J, Onifer SM. Increased chondroitin sulfate proteoglycan expression in denervated brainstem targets following spinal cord injury creates a barrier to axonal regeneration overcome by chondroitinase ABC and neurotrophin-3. Exp Neurol. 2008;209:426–445. doi: 10.1016/j.expneurol.2007.03.029. [DOI] [PMC free article] [PubMed] [Google Scholar]
- Massey JM, Hubscher CH, Wagoner MR, Decker JA, Amps J, Silver J, Onifer SM. Chondroitinase ABC digestion of the perineuronal net promotes functional collateral sprouting in the cuneate nucleus after cervical spinal cord injury. J Neurosci. 2006;26:4406–4414. doi: 10.1523/JNEUROSCI.5467-05.2006. [DOI] [PMC free article] [PubMed] [Google Scholar]
- McBride RL, Feringa ER, Garver MK, Williams JK., Jr. Prelabeled red nucleus and sensorimotor cortex neurons of the rat survive 10 and 20 weeks after spinal cord transection. J Neuropathol Exp Neurol. 1989;48:568–576. doi: 10.1097/00005072-198909000-00007. [DOI] [PubMed] [Google Scholar]
- McKeon RJ, Hoke A, Silver J. Injury-induced proteoglycans inhibit the potential for laminin-mediated axon growth on astrocytic scars. Exp Neurol. 1995;136:32–43. doi: 10.1006/exnr.1995.1081. [DOI] [PubMed] [Google Scholar]
- Merline M, Kalil K. Cell death of corticospinal neurons is induced by axotomy before but not after innervation of spinal targets. J Comp Neurol. 1990;296:506–516. doi: 10.1002/cne.902960313. [DOI] [PubMed] [Google Scholar]
- Moon LD, Asher RA, Rhodes KE, Fawcett JW. Regeneration of CNS axons back to their target following treatment of adult rat brain with chondroitinase ABC. Nat Neurosci. 2001;4:465–466. doi: 10.1038/87415. [DOI] [PubMed] [Google Scholar]
- Paxinos G, Franklin KBJ. The Mouse Brain in Stereotaxic Coordinates. Academic Press; San Diego, CA: 2001. [Google Scholar]
- Pizzorusso T, Medini P, Berardi N, Chierzi S, Fawcett JW, Maffei L. Reactivation of ocular dominance plasticity in the adult visual cortex. Science. 2002;298:1248–1251. doi: 10.1126/science.1072699. [DOI] [PubMed] [Google Scholar]
- Rolls A, Avidan H, Cahalon L, Schori H, Bakalash S, Litvak V, Lev S, Lider O, Schwartz M. A disaccharide derived from chondroitin sulphate proteoglycan promotes central nervous system repair in rats and mice. Eur J Neurosci. 2004;20:1973–1983. doi: 10.1111/j.1460-9568.2004.03676.x. [DOI] [PubMed] [Google Scholar]
- Sasaki M, Hains BC, Lankford KL, Waxman SG, Kocsis JD. Protection of corticospinal tract neurons after dorsal spinal cord transection and engraftment of olfactory ensheathing cells. Glia. 2006;53:352–359. doi: 10.1002/glia.20285. [DOI] [PMC free article] [PubMed] [Google Scholar]
- Sivasankaran R, Pei J, Wang KC, Zhang YP, Shields CB, Xu XM, He Z. PKC mediates inhibitory effects of myelin and chondroitin sulfate proteoglycans on axonal regeneration. Nat Neurosci. 2004;7:261–268. doi: 10.1038/nn1193. [DOI] [PubMed] [Google Scholar]
- Smith-Thomas LC, Fok-Seang J, Stevens J, Du JS, Muir E, Faissner A, Geller HM, Rogers JH, Fawcett JW. An inhibitor of neurite outgrowth produced by astrocytes. J Cell Sci. 1994;107(Pt 6):1687–1695. doi: 10.1242/jcs.107.6.1687. [DOI] [PubMed] [Google Scholar]
- Snow DM, Lemmon V, Carrino DA, Caplan AI, Silver J. Sulfated proteoglycans in astroglial barriers inhibit neurite outgrowth in vitro. Exp Neurol. 1990;109:111–130. doi: 10.1016/s0014-4886(05)80013-5. [DOI] [PubMed] [Google Scholar]
- Tang X, Davies JE, Davies SJ. Changes in distribution, cell associations, and protein expression levels of NG2, neurocan, phosphacan, brevican, versican V2, and tenascin-C during acute to chronic maturation of spinal cord scar tissue. J Neurosci Res. 2003;71:427–444. doi: 10.1002/jnr.10523. [DOI] [PubMed] [Google Scholar]
- Tang XQ, Wang Y, Huang ZH, Han JS, Wan Y. Adenovirus-mediated delivery of GDNF ameliorates corticospinal neuronal atrophy and motor function deficits in rats with spinal cord injury. Neuroreport. 2004;15:425–429. doi: 10.1097/00001756-200403010-00009. [DOI] [PubMed] [Google Scholar]
- Tester NJ, Howland DR. Chondroitinase ABC improves basic and skilled locomotion in spinal cord injured cats. Exp Neurol. 2008;209:483–496. doi: 10.1016/j.expneurol.2007.07.019. [DOI] [PMC free article] [PubMed] [Google Scholar]
- Tetzlaff W, Kobayashi NR, Giehl KM, Tsui BJ, Cassar SL, Bedard AM. Response of rubrospinal and corticospinal neurons to injury and neurotrophins. Progress in Brain Research. 1994;103:271–286. doi: 10.1016/s0079-6123(08)61142-5. [DOI] [PubMed] [Google Scholar]
- Tobias CA, Shumsky JS, Shibata M, Tuszynski MH, Fischer I, Tessler A, Murray M. Delayed grafting of BDNF and NT-3 producing fibroblasts into the injured spinal cord stimulates sprouting, partially rescues axotomized red nucleus neurons from loss and atrophy, and provides limited regeneration. Exp Neurol. 2003;184:97–113. doi: 10.1016/s0014-4886(03)00394-7. [DOI] [PubMed] [Google Scholar]
- Tom VJ, Steinmetz MP, Miller JH, Doller CM, Silver J. Studies on the development and behavior of the dystrophic growth cone, the hallmark of regeneration failure, in an in vitro model of the glial scar and after spinal cord injury. J Neurosci. 2004;24:6531–6539. doi: 10.1523/JNEUROSCI.0994-04.2004. [DOI] [PMC free article] [PubMed] [Google Scholar]
- Xing J, Ginty DD, Greenberg ME. Coupling of the RAS-MAPK pathway to gene activation by RSK2, a growth factor-regulated CREB kinase. Science. 1996;273:959–963. doi: 10.1126/science.273.5277.959. [DOI] [PubMed] [Google Scholar]
- Yano S, Tokumitsu H, Soderling TR. Calcium promotes cell survival through CaM-K kinase activation of the protein-kinase-B pathway. Nature. 1998;396:584–587. doi: 10.1038/25147. [DOI] [PubMed] [Google Scholar]
- Yick LW, So KF, Cheung PT, Wu WT. Lithium chloride reinforces the regeneration-promoting effect of chondroitinase ABC on rubrospinal neurons after spinal cord injury. J Neurotrauma. 2004;21:932–943. doi: 10.1089/neu.2004.21.932. [DOI] [PubMed] [Google Scholar]
- Zhou FQ, Snider WD. Intracellular control of developmental and regenerative axon growth. Philos Trans R Soc Lond B Biol Sci. 2006;361:1575–1592. doi: 10.1098/rstb.2006.1882. [DOI] [PMC free article] [PubMed] [Google Scholar]
- Zuo J, Neubauer D, Dyess K, Ferguson TA, Muir D. Degradation of chondroitin sulfate proteoglycan enhances the neurite-promoting potential of spinal cord tissue. Exp Neurol. 1998;154:654–662. doi: 10.1006/exnr.1998.6951. [DOI] [PubMed] [Google Scholar]
Associated Data
This section collects any data citations, data availability statements, or supplementary materials included in this article.
Supplementary Materials
Supplementary Figure 1: YFP and Fast Blue dual labelling to identify thoracic projecting corticospinal neurons in the YFP-H mouse.
YFP-labelling in layer V pyramidal neurons is present throughout the forebrain. Thus, to determine the most appropriate cortical regions in which to assess degeneration of YFP-labelled pyramidal neurons following thoracic spinal cord injury, the retrograde tracer Fast Blue was injected into a T12 dorsal column injury site and serial coronal sections through the brain were examined for the presence of YFP- and Fast Blue-labelled neurons (schematic, A). Fast Blue labelled pyramidal neurons were observed in a discrete area within layer V of the sensorimotor cortex (B, inset shows Fast Blue labelled pyramidal neurons at high power). The greatest number of labelled neurons were observed between Bregma + 0.02 mm and −0.7mm. Area M1 of the motor cortex at Bregma −0.10 mm (D) and −0.46 mm (E) contain a high number of neurons lalelled with the Fast Blue tracer. Many of the Fast Blue-labelled neurons (D,E, blue) also expressed YFP (D,E, green), confirming that many of the YFP-labelled layer V pyramidal neurons in these regions are indeed corticospinal projection neurons. Therefore, levels −0.10 mm and −0.46 mm were selected as the optimal regions of interest for assessing degenerative effects of thoracic spinal cord injury and ChABC treatment on YFP-labelled layer V projection neurons. Some YFP-labelled neurons did not contain the Fast Blue label, indicating a proportion of neurons in this region that either do not project to the spinal cord, project to the spinal cord but arborise rostral to the T12 level, or project to the T12 spinal cord but did not take up the tracer. Conversely, some Fast Blue-labelled neurons did not contain the YFP label, indicating the presence of some spinally projecting CSNs that do not express YFP. In areas more rostral and caudal few Fast Blue labelled cells were apparent, for example at Bregma +0.14 mm (C). Thus, most layer V pyramidal neurons at this level do not project to the thoracic cord and would not be affected by a T12 dorsal column lesion. This region was also analysed to determine whether CSPG degradation could lead to hypertrophy of neighbouring uninjured YFP-labelled projection neurons (see supplementary Figure 2). Thus, we have identified cortical regions in the YFP-H mouse where a high proportion of YFP expressing neurons project to the thoracic spinal cord and are susceptible to degenerative changes following thoracic dorsal column injury. Scale bars = 500μm (B-E) and 50 μm (inset).
Supplementary Figure 2: ChABC treatment does not lead to hypertrophy of uninjured YFP labelled projection neurons in the YFP-H mouse cortex.
Cell size distribution analysis was also performed at Bregma +0.14 mm, a cortical region which does not contain cells projecting to the thoracic spinal cord (determined from Fast Blue tracing experiments, see supplementary Figure 1), to determine whether ChABC could cause hypertrophy in uninjured neighbouring projection neurons. Representative low (A,C) and high power (B,D) images of the sensorimotor cortex at Bregma +0.14 mm shows that YFP-labelled somata are similar in appearance following a thoracic dorsal column injury plus either penicillinase (A,B) or ChABC treatment (C,D), with cells appearing normal and no evidence of either atrophy or hypertrophy in this cortical region following lesion and treatment. Cell size distribution histogram (E) and cumulative frequency (F) plots confirm that in this area the cell size distributions were identical in unlesioned sham controls and lesioned animals treated with penicillinase, confirming that there was no evidence of cell atrophy in this region following thoracic spinal injury; furthermore, cell size distributions did not change following ICV or IT delivery of ChABC, indicating that ChABC treatment does not lead to hypertrophy of uninjured projection neurons in the cortex (P > 0.05 Kolmogorov-Smirnov test, all pairwise comparisons). Scale bars = 500 μm (A,C) and 250 μm (B,D).
Supplementary Figure 3: ChABC treatment following spinal cord injury rescues corticospinal projections at bregma −0.46 from lesion-induced atrophy.
At Bregma −0.46mm (A-F), ChABC treatment (C,D) again protects lesioned CSNs from injury-induced atrophy compared with penicillinase treated animals (A,B). Histogram (E) and cumulative frequency (F) distributions show that here ChABC promotes a partial rescue of lesioned CSNs, with the cell size distribution curve mid-way between that of sham uninjured and penicillinase treated injured animals. At both Bregma −0.10mm and −0.46mm, intrathecal and intracerebroventricular treatment with ChABC promote equivalent protection of lesioned CSNs (F). Cell size frequency distribution histograms display mean frequency ± SEM, n = 4 per treatment group. Scale bar = 500 μm (A,C) and 250 μm (B,D).