

Abstract
Attentional orientation to a spatial cue and reorientation – after invalid cueing – are mediated by two distinct networks in the human brain: a bilateral dorsal frontoparietal network, comprising the intraparietal sulcus (IPS) and the frontal eye fields (FEF), controls the voluntary deployment of attention and may modulate visual cortex in preparation for upcoming stimulation. In contrast, reorienting attention to invalidly cued targets engages a right-lateralized ventral frontoparietal network comprising the temporoparietal junction (TPJ) and ventral frontal cortex. The present fMRI study investigated the functional architecture of these two attentional systems by characterizing effective connectivity during lateralized orienting and reorienting of attention, respectively. Subjects performed a modified version of Posner’s location-cueing paradigm. Dynamic causal modelling (DCM) of regional responses in the dorsal and ventral network, identified in a conventional (SPM) whole-brain analysis, was used to compare different functional architectures. Bayesian model selection showed that top-down connections from left and right IPS to left and right visual cortex, respectively, were modulated by the direction of attention. Moreover, model evidence was highest for a model with directed influences from bilateral IPS to FEF, and reciprocal coupling between right and left FEF. Invalid cueing enhanced forward connections from visual areas to right TPJ, and directed influences from right TPJ to right IPS and IFG. These findings shed further light on the functional organization of the dorsal and ventral attentional network and support a context-sensitive lateralisation in the top-down (backward) mediation of attentional orienting and the bottom-up (forward) effects of invalid cueing.
Introduction
The voluntary orienting of attention to locations where behaviourally relevant targets are expected – and the reorienting of attention to targets appearing at unexpected locations – are mediated by two anatomically distinct frontoparietal networks in the human brain (Corbetta et al., 2002; Corbetta et al., 2008; Vandenberghe and Gillebert, 2009). A bilateral system, comprising the intraparietal sulcus (IPS) and the frontal eye fields (FEF) has been shown to respond to attention-directing spatial cues in location-cueing paradigms (Corbetta et al., 2000; Hopfinger et al., 2000). This dorsal network may modulate visual processing in preparation for expected input via top-down connections to visual areas – unilateral structural or functional damage to the IPS produces asymmetrical activation of visual areas (Corbetta et al., 2005; Vuilleumier et al., 2008). Combined fMRI-TMS studies have recently shown that TMS of the FEF and IPS differentially influences visual cortex activity (Driver et al., 2010; Ruff et al., 2006; Ruff et al., 2008a, 2008b), suggesting distinct functional roles for the two nodes of this network.
Functional specialisation may also exist within the ventral frontoparietal attention network, which responds to unexpected stimuli appearing outside the attentional focus (Corbetta et al., 2002; Macaluso et al., 2002; Vossel et al., 2006; 2009). This network comprises the temporoparietal junction (TPJ) and ventral frontal areas of the right hemisphere. Activation of the IPS is, however, also frequently observed when responses during invalid and valid trials are compared in location-cueing paradigms (Corbetta and Shulman, 2010; Thiel et al., 2004; Vossel et al., 2009) and the exact role of these regions in attentional control remains unclear.
Recent advances in fMRI analysis now allow one to measure the directed effective connectivity (and condition-dependent changes in coupling) between brain regions. Directed (functional or effective) connectivity can be studied with dynamic causal modelling (DCM, Friston et al., 2003), Granger causality (Roebroeck et al., 2005) or psychophysiological interactions (PPI, Friston et al., 1997). Using Granger causality, Bressler et al. (2008) showed that both FEF and IPS exert top-down influence on visual cortex. In contrast to Granger causality, DCM uses an explicit model of coupling that allows for inferences about how directed effective connectivity between brain areas is affected by experimental factors. DCM tests specific hypotheses about functional anatomy, defined in terms of connectivity architectures with context-sensitive effects. Bayesian model selection among competing DCMs uses model evidence (i.e. the probability of the data given a specific DCM) to adjudicate formally in favour of one model (or family models) relative to others.
The present fMRI study used DCM to further characterise the context-sensitive organization of the dorsal and ventral attention systems in the human brain. The models we evaluated were motivated by both theoretical models of attentional control (Kinsbourne, 2003; Mesulam, 1999) and empirical findings from fMRI analyses (Corbetta et al., 2000; Hopfinger et al., 2000; Szczepanski et al., 2010; Vossel et al., 2006). Our particular focus, when specifying alternative models, was the putative lateralisation of top-down modulatory effects of attentional orientation and bottom-up modulatory effects of attentional reorientation.
Methods
Subjects
Twenty-six subjects with no history of neurological or psychiatric disease gave written informed consent to participate in the study. Two subjects were excluded from analysis due to technical problems during scanning. Therefore, data from 24 subjects were analyzed (10 females; age range from 20-37 years; mean age 26.83 years). All subjects were right-handed, as indexed by a handedness inventory (Oldfield, 1971) and had normal colour vision. The study was conducted in compliance with the ethical principles of the World Medical Association (Declaration of Helsinki) and was approved by the local ethics committee.
Stimuli and experimental paradigm
We employed a modified version of a location-cueing paradigm with central predictive cueing (Posner, 1980) (see figure 1).
Figure 1.
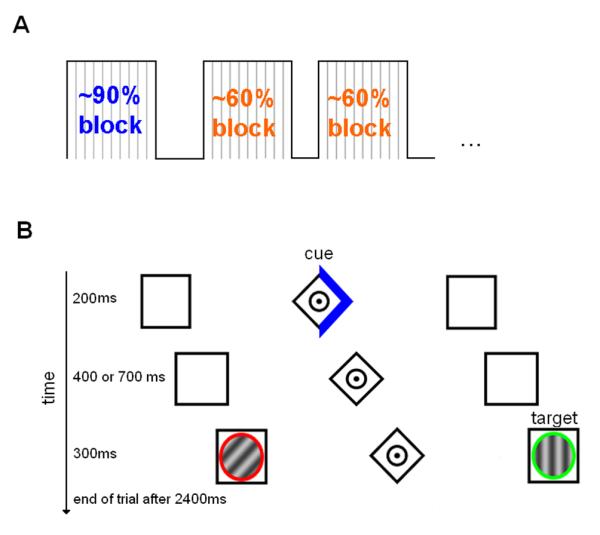
Illustration of the experimental design and paradigm. (A) Trials were presented using a mixed event-related and block design with %validity (90% or 60%) being manipulated across different blocks. %validity was indicated to the subjects by instruction as well as by the colour of the cue (blue or orange). (B) In the example shown here, the subject was asked to discriminate the orientation of the green grating while maintaining fixation at the centre of the display (i.e. the dot in the diamond).
Stimuli were shown on a TFT screen behind the MR scanner and presented to the subjects by means of a mirror-system. Viewing distance was approximately 245 cm. Subjects were presented with two horizontally placed boxes (1° wide and the centres were presented at 4° eccentricity). A central diamond (0.5° wide) between the boxes served as a fixation point. Subjects were asked to maintain fixation throughout the experiment. Cues comprised a 200 ms increasing brightness of one side of the diamond – depicting an arrowhead pointing to one of the peripheral boxes. Percentage cue validity (i.e. the proportion of validly and invalidly cued targets) was manipulated between different experimental blocks (see figure 1A). For each block, %validity (either ~90% or ~60%) was explicitly indicated to the subjects using coloured cues (blue and orange). The assignment of cue colour and %validity was counterbalanced across subjects.
After a variable cue-target interval of 400 or 700 ms, the cue was followed by two circular sinusoidal gratings appearing for 300ms in the two peripheral boxes (see figure 1B). The grating orientation could be either vertical (0° orientation) or tilted (45° orientation). Subjects were asked to report the orientation (vertical/tilted) of the target grating (defined by the colour of a surrounding circle, see below) as quickly as possible by button presses with the index and middle finger of their right hand. The allocation of the fingers was balanced across subjects. Vertical and titled gratings were presented randomly and with equal probability. Targets were presented on the left and right with equal probability and were indicated by a red or green circle around the gratings. The target colour was counterbalanced across subjects. The orientation of non-targets in the opposite hemifield was either identical or different to that of the target (with equal probability) across all experimental conditions.
The total duration of one trial was 2400 ms. Trials were presented in different blocks (comprising 14 trials each) according to a mixed design. For each of the two cue-validity conditions, 18 blocks were presented. Experimental blocks were followed by a resting period of variable duration (mean duration 16 secs; range 12 secs to 19.2 secs), in which only the baseline stimuli (consisting of the fixation point and the two peripheral boxes) were displayed. The block number was indicated to the subjects before each experimental block. The total duration of the experiment was 31 minutes.
Data acquisition
T2*-weighted echoplanar (EPI) images with blood oxygen level-dependent (BOLD) contrast (matrix size 64 × 64, voxel size 3.1 × 3.1 × 3.0 mm3) were obtained using a 3 T MRI System (Trio, Siemens, Erlangen, Germany). Additional high-resolution anatomical images (voxel size 1 × 1 × 1 mm3) were acquired using a standard T1-weighted 3D MP-RAGE sequence.
Eight-hundred fifty-six EPI volumes, each consisting of thirty-six 3 mm thick axial slices, were acquired sequentially with a 0.3 mm gap (repetition time 2.2 s, echo time 30 ms). The first 5 volumes were discarded to allow for T1 equilibration effects. The data were pre-processed and analyzed with Statistical Parametric Mapping software SPM8 (Wellcome Department of Imaging Neuroscience, London; Friston et al., 1995; http://www.fil.ion.ucl.ac.uk/spm). To correct for inter-scan movement, the images were spatially realigned to the first of the remaining 851 volumes and subsequently re-realigned to the mean of all images. The mean EPI image for each subject was then computed and spatially normalized to the MNI single subject template – using the ‘unified segmentation’ function in SPM8. The ensuing deformation was subsequently applied to the individual EPI volumes and the T1 scan, which was coregistered to the mean of the realigned EPIs. All images were thereby transformed into standard stereotaxic space and re-sampled into 2 × 2 × 2 mm3 voxels. The normalized images were spatially smoothed using an 8 mm full-width half-maximum (FWHM) Gaussian kernel to satisfy the statistical assumptions of parametric inference and random field theory – and to compensate for residual variation in functional anatomy across subjects.
Statistical analysis of imaging data (General linear model, GLM)
Data were analyzed with SPM8 using a random-effects model. Nine regressors were defined at the single-subject level (valid and invalid trials in the context of 90% and 60% cue validity, separately for left and right target stimuli: v90l, v90r, i90l, i90r, v60l, v60r, i60l and i60r; and an additional regressor for missed/incorrect responses). The eight event types reflect the 2 × 2 × 2 factorial nature of our design, in which validity was crossed with percent and the side of target presentation. Events were time-locked to the onset of the cue (for the analysis of valid trials) and of the target (for contrasts of invalid and valid trials). The resulting stimulus functions were convolved with a canonical hemodynamic response function and its temporal derivative, to provide regressors in the usual way. The six movement parameters of the (rigid body) realignment were included in the design matrix as additional regressors. Data were high-pass filtered at 1/128 Hz. For each subject, 8 condition-specific contrast images were created (each trial type vs. baseline) and entered into a second-level within-subjects ANOVA model (without constant terms). Inhomogeneity of variance and correlations among errors were estimated with Restricted Maximum Likelihood.
Planned t-contrasts were used to compare i) valid trials versus baseline and ii) invalid versus valid trials. Simple contrasts (i.e. the contrast of valid trials versus baseline) were thresholded at p <.05 (corrected) using an extent threshold of 100 voxels. Differential contrasts (invalid > valid trials) were thresholded at p<.05 (corrected) at the cluster-level (with a height threshold of p<.001 uncorrected). Parameter estimates were extracted at the peak voxels for the clusters of interest and analysed with separate ANOVAs to test for the effects of orthogonal experimental factors in these regions.
Dynamic causal modelling (DCM)
To investigate effective connectivity and compare different models of functional architecture, DCM was performed using DCM10, as implemented in SPM8.
a) Time series extraction
DCMs were fitted to distributed BOLD time series from individual subjects. Subject-specific time series were extracted from specific regions of interest (ROIs) that were selected on the basis of functional and anatomical constraints (cf. Stephan et al., 2007). Specifically, time series were extracted from voxels that survived a threshold of p<.05 (uncorrected) in single-subject analyses (valid trials versus baseline for the orienting – and invalid trials versus baseline for the reorienting network); and were located within 16 mm of the corresponding group maximum. The first eigenvariate was then computed across all suprathreshold voxels within 4mm of the subject-specific maximum. With these criteria, time series for one of the selected regions (TPJ, see below) could not be identified in one of the 24 subjects, and DCM of the ventral network was accordingly performed on the remaining 23 participants.
b) Specification of DCMs
We specified bilinear deterministic DCMs (Friston et al., 2003). Bilinear DCM’s include (bilinear) parameters that model condition or trial-specific changes in particular connections that are specified as part of the model. To study the (driving and bilinear or modulatory) effects of attentional orientation during valid trials – and reorienting of attention after invalid trials – DCMs were specified separately for dorsal and ventral attention networks that included common visual areas. MNI coordinates for visual areas, IPS and FEF were established by contrasting valid trials versus baseline at the group-level (GLM analysis). Ventral areas of the reorienting network were identified by the group-level contrast of invalid versus valid targets.
For the DCMs of the dorsal network, trials with (centrally presented) leftward and rightward cues were used as driving inputs. Here, it was assumed that the cue activated left and right IPS or FEF, respectively (depending on the specific structure of the alternative models, figure 2) (cf. Corbetta et al., 2000; Hopfinger et al., 2000). We also included visual input to the left and right visual cortex, since the cues were followed by a target after several hundred milliseconds. Separate single-subject design matrices with a parametric regressor coding for the direction of attention (left = 1, right = -1) were used to specify bilinear inputs that modulated the coupling strength among nodes of the dorsal network (note that because of this specification, right > left attentional modulation corresponds to a negative bilinear or modulatory parameter). Due to the number of possible models for architectures we could entertain, a stepwise (greedy search) procedure was used to identify the interactions between bilateral FEF, IPS and visual cortex:
Figure 2.

Model space for Bayesian model comparison of dorsal network DCMs. (A) Models including IPS and visual cortex. (B) Models including FEF, IPS and visual cortex. Fixed connections are indicated by dashed arrows and are identical across competing models. Solid arrows represent the model-specific modulatory (bilinear) effects on connections.
Given the evidence from patient studies for the importance of the IPS for lateralized modulation of visual cortex activity (Corbetta et al., 2005; Vuilleumier et al., 2008), models (subgraphs) including bilateral IPS and visual cortex only were specified to identify the network architecture that best explains parietal influences on visual cortex (cf. section c) and figure 2 A). These models were motivated by theoretical accounts of spatial attentional control (Kinsbourne, 2003; Mesulam, 1999; Szczepanski et al., 2010). Subsequently, the final model was identified by a Bayesian model comparison of models that were equipped with connections to and from left and right FEF (cf. figure 2 B).
For the ventral network, separate design matrices were used in which the trials with left and right targets provided driving input for right and left visual cortex, respectively. Invalidly cued targets (irrespective of probabilistic context) and invalidly cued targets in the context of high %validity were entered as two modulatory effects: Expected (validly cued) and unexpected (invalidly cues) targets were assumed to differentially modulate the coupling between visual areas and frontoparietal regions (cf. section c) and figure 3). Moreover, the coupling between those regions was assumed to be greater in invalid trials in the high %validity condition (i.e. with increased unexpectedness of the invalid target).
Figure 3.

Model space for Bayesian model comparison of ventral network DCMs. Fixed connections are indicated by dashed arrows and are identical across competing models. Solid arrows represent the model-specific modulatory (bilinear) effects on connections.
c) Designing the model space
Specifying the model space for subsequent Bayesian model selection (see section d)), is crucial for identifying the most likely DCM and hence for making inferences about the most likely functional architecture. This model space constitutes the set of network hypotheses that we consider plausible explanations for observed responses: DCMs are specified in terms of fixed connections between brain areas and input-specific changes in the strength of these connections (i.e. modulatory or bilinear effects). For each of the two networks, the fixed connections were identical across all competing models (illustrated by dashed arrows in figures 2 and 3). The models of the dorsal network contained fixed reciprocal connections between all areas within one hemisphere (visual cortex V, IPS, FEF), as well as interhemispheric connections between left and right IPS and FEF. For the ventral network, fixed reciprocal connections were assumed for the left IFG and IPS, for the right IFG, IPS and TPJ as well as for left and right IPS and IFG. Moreover, the ventral models contained bottom-up connections between visual areas and the IFG, IPS and TPJ.
The key differences between the competing models (hypotheses) were defined by the deployment of modulatory effects (illustrated by solid arrows in figures 2 and 3). For the dorsal network, these modulatory effects represented the direction of attention (left > right) that affected top-down connections from IPS and FEF to visual cortex, as well as connections between left and right FEF and IPS. In reduced model versions (including IPS and visual cortex only), modulatory effects were assumed for bilateral connections from the IPS to visual cortex for all four models. Model 1 (figure 2A) contained a directed connection from right to left IPS (cf. the proposal of a right-hemispheric dominance for attentional control; Mesulam, 1999). We also included the alternative model with a modulatory effect on the connection from left to right IPS (model 2), as well as two symmetrical models with either reciprocal (model 3) or no (model 4) interhemispheric modulatory effects (corresponding to the attentional model proposed by Kinsbourne, 2003 and its recent neurobiological formulation by Szczepanski et al., 2010). The winning model (model 4) was then extended by including left and right FEF.
In particular, we tested models with a modulation of (left, right or bilateral) FEF->IPS or IPS->FEF connections, respectively (including different modulations of interhemispheric FEF connectivity). Here, directed connections from FEF to IPS have previously been reported by Bressler et al. (2008), while a recent MEG study has shown shorter latencies for parietal areas than for the FEF, after the presentation of a spatial cue (motivating a modulatory effect on the connection from IPS to FEF rather than from FEF to IPS; Simpson et al., 2011). We also tested for additional modulatory (direct) effects on connections from the FEF to visual cortex (with or without indirect influences via the IPS), since TMS studies provide evidence for effects of FEF stimulation on attentional orienting and visual cortex activity. In sum, these variations resulted in 20 different models of the dorsal network.
For the ventral network, we tested models in which bottom-up connections from visual areas to either bilateral IFG or IPS, or right IFG, IPS or TPJ were modulated by invalid cueing and %validity, with additional model-specific modulatory effects on connections between these regions. While it has been observed that all of these regions respond to invalidly cued targets, it remains unclear where the unexpected sensory input enters the system and how it affects the coupling between its components. Most studies report a right-hemispheric lateralization of the reorienting response. Hence, we compared models with a right-lateralization of the bottom-up modulatory effects (models 1, 2, 4, 7 and 8, cf. figure 3) and models with symmetrical modulation of bottom-up connections from visual cortex to bilateral IFG (model 3) or IPS (model 5 and 6). These models implied different modulatory effects on connections between right TPJ, bilateral IFG and IPS, resulting in 8 different models of the ventral network. In addition to this analysis, these 8 ventral models were re-estimated with inclusion of fixed connections to and from the left TPJ. Since the left TPJ was not significantly activated in the whole brain SPM group analysis, time series for this region were extracted from the homologous coordinates of the right TPJ. Ten additional models were estimated with symmetrical connections that were modulated by invalid cueing and invalid cueing in the context of high %validity. These models were constructed by mirroring the connections of the right hemisphere for the left hemisphere and varying the interhemispheric connections between left and right areas. The two different model families (right-lateralized versus symmetrical models) were then compared using family inference (Penny et al., 2010). This additional analysis was performed (at the suggestion of our reviewers) to further corroborate the right-hemispheric lateralisation within the ventral network and to rule out any bias resulting from the statistical threshold selection in the SPM group analysis (in which the left TPJ was not significantly activated in the contrast of invalid versus valid trials).
d) Model selection and parameter inference
A random effects Bayesian model selection was employed to identify the most likely DCM (Penny et al., 2004; Stephan et al., 2009). Additionally, the maximum a posteriori (MAP) estimates of the parameters of the winning model (i.e. the model with the highest exceedance probability when compared to alternative models) were tested for significance with two-sided one-sample t-tests to illustrate the effect sizes (increase vs. decrease of connectivity) and consistency of the parameters across subjects. Note that model parameters in DCMs correspond to rate constants and are expressed in units of 1/second (Hz). t-tests were performed separately on the fixed connections, modulatory effects on connections and driving inputs of the optimal model, with Bonferroni correction for multiple comparisons within each parameter class (cf. Stephan et al., 2007). The results of these tests were summarised in terms of the group mean (effect size) and (classical) p-values; and were reported graphically for each (significant) connection.
Statistical analysis of behavioural data
Reaction times (RTs) faster than 100 ms (i.e. anticipations) were excluded from the analyses. Median RTs and percent incorrect responses were calculated for the 4 different experimental conditions (valid and invalid trials in the context of 90% and 60% cue validity) and entered into 2 (cue: valid/invalid) x 2 (%validity: 90%/60%) repeated measures ANOVAs.
Eye movement control
Eye position was monitored during scanning with an MR-compatible infrared eye tracker (SensoMotoric Instruments® SMI, Berlin Germany) to ensure that the subjects maintained eye fixation in response to the cue and the target stimuli. Eye movement data could not reliably be recorded in 8 subjects, so that data from 16 subjects were analyzed. For each trial, gaze deviations of maximal 25%, 50%, 75%, or 100% of the distance between central fixation point and the target locations were determined. First, the interval between cue- and target onset was analysed (separately for the 90% and 60% cueing conditions). Second, the time period from target onset +600ms was analysed to compare maintenance of fixation in the different experimental conditions. Differences in eye position data for the different conditions were tested with repeated measures ANOVAs with the factor position (centre, 25%, 50%, 75% and target position) and experimental condition (%validity for the cue period and targets in the v90, i90, v60, i60 conditions for the target period).
Results
Eye movement data
The results of the analyses of the eye movement data are shown in figure 4A and B. On average, the subjects maintained their gaze within a region of ±25% of the cue-target distance in 89.25 ± 2.9% (mean ± SEM) of the trials after 90% cues and in 87.81 ± 2.8% of the trials after 60% cues. The %validity (90%/60%) x position (centre/25%/50%/75%/target) ANOVA did not reveal a main effect of %validity nor a position x %validity interaction.
Figure 4.

Eye movement data for the cue (A) and target (B) periods, response times (C) and error rates (D) in the different experimental conditions.
After target appearance, the time spent in a fixation zone of ±25% of the cue-target distance amounted to 89.88 ± 2.6%, 90.72 ± 3.4 %, 90.47 ± 2.4% and 91.09 ± 2.4% in the v90, i90, v60 and i60 condition, respectively. There were no significant main effects of cueing (valid/invalid) or %validity (90%/60%), nor any interaction effects of these factors with the position factor.
Behavioural Data
Response times and error rates are shown in figure 4C and D. The 2 (cue: valid/invalid) x 2 (%validity: 90%/60%) ANOVA on median RTs revealed a significant main effect of cue, reflecting slower responses in invalid as compared to valid trials (F(1,23) = 11.05; p<.01). Moreover, the cue x %validity interaction was significant (F(1,23) = 8.55; p<.01) indicating a differential impact of %validity in validly and invalidly cued trials (see figure 4C). No other significant effects were obtained.
The equivalent ANOVA on error rates in the different experimental conditions revealed a significant main effect of cue (F(1,23)= 7.7; p<.05) and a significant cue x %validity interaction (F(1,23)=5.3; p<.05) (see figure 4D). Altogether, error rates supported the results observed in the RT-analysis.
Neural data – whole-brain SPM analyses
The contrast of all valid trials versus baseline revealed activation of bilateral dorsal frontoparietal regions (IPS and FEF), visual areas, as well as the supplementary motor area and the left motor cortex (figure 5A). For the parameter estimates in left and right visual cortex, IPS and FEF, 2 (side: left/right) x 2 (%validity: 90%/60%) ANOVAs were calculated. Significant main effects of side were observed in left and right visual cortex reflecting higher activity for contralateral than for ipsilateral attended targets. Both visual regions also showed a significant main effect of %validity with higher activity in the 90% than in the 60% condition. The left IPS showed a main effect of side with higher activity in right as compared to left trials. No other significant effects were found at this level of significance.
Figure 5.

(A) Results of the SPM analysis of valid trials (shown at p< .05 – corrected using an extent threshold of 100 voxels). (B) Results of the GLM analysis of invalid as compared to valid trials (shown at p < 0.05 – corrected using a height threshold of the p = 0.001 uncorrected).
Contrasting invalidly with validly cued targets revealed significant activation of bilateral inferior/middle frontal gyri, left and right IPS, as well as the right TPJ (see figure 5B). Cue (valid/invalid) x %validity (90%/60%) ANOVAs on subject-specific activations revealed that all areas showed significant cue x %validity interactions with higher differences between invalid and valid trials in the 90% condition. Moreover, %validity main effects were significant in all regions except the TPJ. An additional ANOVA included the factor target hemifield (left/right). We did not observe main effects of hemifield or interactions of hemifield with the other factors in any of the regions.
Neural data – DCM analyses
The mean coordinates of the ROIs for which BOLD time series were extracted for the individual subjects are shown in figure 6.
Figure 6.

Location of the mean coordinates (depicted with 8mm spheres) of the time series extraction of visual areas (green) and regions of the dorsal (blue) and ventral (orange) networks. ROIs in left and right visual cortex were located in V4/V3 according to a probabilistic cytoarchitectonic atlas (SPM Anatomy toolbox; Eickhoff et al., 2005).
To establish the most likely connectivity pattern between the left and right IPS and visual areas during orienting of attention, 4 initial DCMs were compared (see figure 2A). Exceedance probabilities derived from the Bayesian model comparison are provided in table 1. The optimal model (model 4) contained directed influences of left and right IPS on left and right visual cortex, respectively1. Subsequently, extensions of this optimal model with connections to left and right FEF were constructed (see figure 2B). These models tested for directed influences from FEF to IPS and vice versa, as well as for direct influences of FEF on visual cortex. The results of the Bayesian model selection are provided in table 1. The model with the highest model evidence is shown in figure 7 and included bilateral connections from IPS to FEF as well as interhemispheric connections between the FEF of both hemispheres. Differential modulation of connectivity by attending to the left versus right hemifield in this model is depicted in figure 7. A second model (model 20) showed a high exceedance probability when compared to the remaining dorsal models (see table 1). This second-best model contained the same connections as the winning model, but additionally included modulations of connections from FEF to visual cortex.
Table 1.
Exceedance probabilities following the Bayesian model comparison of IPS-visual cortex and FEF-IPS-visual cortex DCMs.
| Model | Exceedance Probability |
|---|---|
|
IPS – visual cortex DCMs
| |
| M1 | 0.02 |
| M2 | 0.01 |
| M3 | 0.04 |
| M4 | 0.93 |
|
| |
| FEF – IPS – visual cortex DCMs | |
|
| |
| M1 | 0.04 |
| M2 | 0.02 |
| M3 | 0.00 |
| M4 | 0.00 |
| M5 | 0.01 |
| M6 | 0.00 |
| M7 | 0.00 |
| M8 | 0.00 |
| M9 | 0.00 |
| M10 | 0.02 |
| M11 | 0.00 |
| M12 | 0.01 |
| M13 | 0.02 |
| M14 | 0.02 |
| M15 | 0.01 |
| M16 | 0.01 |
| M17 | 0.00 |
| M18 | 0.47 |
| M19 | 0.00 |
| M20 | 0.33 |
Figure 7.

DCM with the highest model evidence for connectivity between FEF, IPS and visual cortex – in relation to the direction of attentional orienting. Fixed connections and modulatory (bilinear) effects on connections are illustrated with dashed and solid arrows, respectively. Coupling parameters were positive for all fixed connections. Connections exhibiting significant (according to post hoc classical t-tests) bilinear or modulatory effects are highlighted in colour (red indicating significant negative modulatory effects and green indicating significant positive modulatory effects).
For the ventral network (or those regions identified by the invalid versus valid contrast, respectively), 8 competing DCMs were evaluated (see figure 3). The model with the highest model evidence (see table 2) is shown in figure 8.
Table 2.
Exceedance probabilities following the Bayesian model comparison of ventral network DCMs.
| Model | Exceedance Probability |
|---|---|
| M1 | 0.02 |
| M2 | 0.25 |
| M3 | 0.03 |
| M4 | 0.35 |
| M5 | 0.00 |
| M6 | 0.01 |
| M7 | 0.15 |
| M8 | 0.18 |
Figure 8.

DCM with the highest model evidence for the connectivity between the areas activated in the contrast of invalid versus valid trials; in relation to the effects of invalid cueing per se and invalid cueing in the context of high %validity. Fixed connections and effects on (bilinear) connections are illustrated with dashed and solid arrows, respectively. Again, coupling parameters were positive for all fixed connections. Connections exhibiting significant (according to post hoc classical t-tests) bilinear or modulatory effects are highlighted in colour (green indicating significant positive modulatory effects).
This winning model embodied connections from bilateral visual cortex to the right TPJ, and from the right TPJ to right IPS and IFG, which were modulated by invalidly cued targets and particularly by invalid targets in the context of high %validity. To additionally test for this significant impact of %validity (i.e. the unexpectedness of the invalidly cued target), we compared this model with a model without modulation by %validity. Bayesian model selection revealed that the model with modulation by probabilistic context (%validity) had more evidence than the model without (exceedance probability 0.70 vs. 0.30). Note that Bayesian model selection accounts for model complexity and penalizes models with more parameters to select the model with the best balance between accuracy and complexity (see, e.g., Penny et al. (2004) for a mathematical explanation).
To corroborate the right-hemispheric lateralization within the ventral network, the 8 original models were re-estimated with inclusion of fixed connections to and from the left TPJ. Ten additional symmetrical models were constructed by mirroring the modulatory effects from the right hemisphere. Bayesian model selection of model families revealed that right-lateralized models had considerably higher model evidence than symmetrical models (exceedance probability 0.997 vs. 0.003).
Discussion
The present study characterised effective connectivity within the dorsal and ventral networks during orienting and reorienting of attention to explore the functional organization of both attentional systems in the human brain. For the dorsal system, we observed that top-down connections from IPS to visual cortex were modulated by the direction of spatial attention. Moreover, model evidence was highest for a model with directed influences from bilateral IPS to FEF, and from right to left and left to right FEF, respectively. In the ventral system, invalid cueing enhanced bottom-up connections from visual areas to the right TPJ, as well as directed influences from right TPJ to right IPS and IFG, especially in the context of high %validity. Our findings provide new insights into the functional organization and specialization within both attentional networks – in particular, they highlight the context-sensitive nature of interregional coupling and the lateralisation of top-down and bottom-up attentional modulation during orientation and reorientation.
Dorsal attention network
Bilateral dorsal frontoparietal regions and visual areas were activated during valid trials (cf. Corbetta et al., 2000; Hopfinger et al., 2000). Despite bilateral sensory stimulation, activity in visual areas was higher for attended target stimuli in the contralateral hemifield. Activity in these regions was moreover higher with greater %validity of the cue, which may reflect a general baseline shift in blocks with high %validity. Besides visual areas, the left IPS showed a significant main effect of hemifield, with higher activity for attended targets in contralateral space. In contrast, responses in right IPS were spatially non-selective – with comparable activation in left- and right-sided trials. Recent work suggests that bilateral (topographic) parietal regions show stronger attention effects for the contralateral hemifield – and that non-topographic areas show an attentional enhancement regardless of the direction of attention (Szczepanski et al., 2010). Given that we did not employ a ROI-based approach, we cannot address this issue directly in our modelling. However, our DCM results showed that both left and right IPS independently exert top-down influence on left and right visual cortex, respectively. This finding of laterality-specific coupling of parietal and visual areas is in line with the results by Szczpanski et al. (2010), who observed that the different subregions – within the left and right IPS – show an attentional bias towards the contralateral hemifield.
Interestingly, the DCM with the highest model evidence did not contain an attentional modulation of direct top-down connections from left or right FEF to visual areas, although the model that included modulations of these connections had the next highest model evidence. While this result for the FEF might be related to our step-wise procedure – in which parietal-visual interactions were considered first – this finding is still striking, since evidence exists for direct anatomical connections between FEF and extrastriate cortex (Barone et al., 2000). Furthermore, TMS studies of the FEF have shown effects on visual cortex activity (Taylor et al., 2007; Ruff et al., 2006, 2008a, 2008b) and behavioural performance in spatial attention tasks (Hung et al., 2011; Grosbras and Paus, 2002). However, TMS studies cannot differentiate between direct (monosynaptic) or indirect (polysynaptic) TMS effects (mediated, e.g., via the IPS). Such indirect effects are conceivable, since a combined PET-TMS study has reported remote effects of FEF TMS on cerebral blood flow in superior parietal and occipitoparietal brain areas (Paus et al., 1997).
The winning dorsal model contained bilateral connections from IPS to FEF, as well as interhemispheric FEF connections, which were modulated by the direction of attention. However, the parameter estimates for the modulatory effect on some of these connections did not reach significance. Interestingly, connections from IPS to FEF showed high fixed connectivity (data not shown), which might reflect the strong anatomical connectivity between these areas (e.g. Umarova at al., 2010). This might imply that attentional signals from IPS broadcast to the FEF, irrespective of the current experimental context. Moreover, it should be noted that our DCMs tested for direction-specific modulation of connectivity to explain the lateralized ‘push-pull’ pattern in visual cortex. Consequently, connections enhanced by attentional orienting per se (independent of the direction of the cue) were not specifically represented in our models and the absent significant effect of left > right attention on the IPS->FEF connections (as well as on the left FEF to right FEF connection) might reflect directionally unspecific coupling. Here, future studies should compare spatial with neutral cues to test this hypothesis.
Our finding that the IPS->FEF connection is potentially more relevant than the FEF->IPS connection is at odds with previous findings from Bressler et al. (2008) who observed that Granger causality was higher for the FEF->IPS than for the IPS->FEF connection. These discrepancies could be attributed to differences in the experimental task (e.g. Bressler et al. (2008) used auditory spatial cues and considerably longer cue-target intervals). Data from an MEG study that investigated the time course of activity in different brain areas in response to visual spatial cues recently showed that the onset of early event-related activity to the cue is shorter in parietal areas than in the FEF (Simpson et al., 2011). Although we did not model the direct effects of the cue on visual connections to parietal and frontal areas, our model space contained models with cue input to the IPS and/or the FEF and the fact that the winning model included cue effects on the IPS is consistent with the latency data by Simpson and colleagues.
Ventral attention network
Contrasting invalid with valid trials revealed activation of ventral frontoparietal areas (bilateral IFG and right TPJ) as well as of bilateral IPS. In all areas, activity was particularly enhanced in the context of high %validity, when invalid targets are less expected. This replicates the results of a previous study showing that reorienting-related activity depends on probabilistic context with increased activity for high %validity (Vossel et al., 2006). Co-activation of ventral and dorsal regions in this contrast has been observed frequently in previous studies – see e.g. Corbetta and Shulman (2010) for a meta-analysis of 4 experiments – but the exact role of each of these regions (e.g. TPJ and IPS) for attentional reorienting remains to be established.
Our DCM results suggest that the input from visual areas to the right TPJ (rather than IPS) is enhanced by invalidly cued targets, particularly in the context of high %validity. This is in good accordance with a study by Sridharan et al. (2007), which showed that activation within the ventral network preceded activation of dorsal areas, after presentation of perceptually salient event boundaries in music. This and our finding might seem incongruent with electrophysiological studies suggesting that the latency of visual responses is presumably shorter for regions of the dorsal network (see also Corbetta et al., 2008 for a discussion of this issue). It should be noted, however, that our DCM results do not necessarily imply that the predefined connections (e.g., from visual areas to right TPJ) exist anatomically in terms of direct monosynaptic connections. Interestingly, a recent fMRI-DCM study – on the processing of contextual information and attentional control in the left hemisphere – reported that although visual input entered the FEF and the FEF showed directional influences on left TPJ, the winning DCM contained an excitatory pathway from TPJ to IFG back to FEF (DiQuattro et al., 2011). This and our finding emphasize the role of ventral areas in modulating attentional control signals in dorsal brain regions (see also below).
Invalid cueing moreover increased connectivity from right TPJ to right IPS, which may potentially reflect the signalling of violated top-down expectations to the dorsal network. The dorsal network may then shift attention to the actual location of the target and update its top-down predictions about the validity of the spatial cue. At first glance, one might argue that our findings do not converge with recent observations in patients with selective IPS lesions who exhibit problems in attentional reorienting, despite possessing intact ventral attentional systems (Gillebert et al., 2011). However, the connection from the right TPJ to the right IPS in our DCM suggests a crucial role for dorsal-ventral interactions during reorienting. Accordingly, in patients with lesions of the right IPS, reorienting signals from the TPJ might not be sufficiently processed and hence lead to a failure in the processing of invalidly cued targets. Further evidence for critical interactions of both systems comes from patients with neglect, where structural damage to the ventral system results in functional impairment of the dorsal system (Corbetta et al., 2005; He et al., 2007).
Connectivity between the right TPJ and IFG was also enhanced by invalid cueing in the high %validity condition in the present study. This finding fits well with the observation that the ventral frontal cortex is activated when reorienting is unexpected (Shulman et al., 2009) and may be involved more generally in the detection of irregular events (Vossel et al., 2011) or violations of explicit contingencies (Ristic et al., 2011).
Conclusion
Using DCM as a measure of effective connectivity within cortical networks, our study has characterised the context-sensitive and lateralised nature of distributed processing within the dorsal and ventral attentional network – suggesting critical roles for right IPS and right TPJ in the orienting and reorienting of visual spatial attention.
Acknowledgements
SV is supported by the Deutsche Forschungsgemeinschaft (DFG, Vo 1733/1-1). KJ is supported by the Wellcome Trust. We are grateful to our colleagues from the Wellcome Trust Centre for Neuroimaging and the Cognitive Neuroscience group for valuable support and discussions. In particular, we thank Oliver Haumann for assistance during scanning.
Footnotes
To validate our stepwise procedure, we additionally estimated all 80 models (i.e. the 20 full models with all 4 possible interhemispheric IPS connections). Bayesian model selection on these 4 different model families (Penny et al., 2010) confirmed the superiority of models without modulations of interhemispheric IPS connections by attention.
References
- Barone P, Batardiere A, Knoblauch K, Kennedy H. Laminar distribution of neurons in extrastriate areas projecting to visual areas V1 and V4 correlates with the hierarchical rank and indicates the operation of a distance rule. J Neurosci. 2000;20:3263–3281. doi: 10.1523/JNEUROSCI.20-09-03263.2000. [DOI] [PMC free article] [PubMed] [Google Scholar]
- Bressler SL, Tang W, Shulman GL, Corbetta M. Top-down control of human visual cortex by frontal and parietal cortex in anticipatory visual spatial attention. J Neurosci. 2008;28:10056–10061. doi: 10.1523/JNEUROSCI.1776-08.2008. [DOI] [PMC free article] [PubMed] [Google Scholar]
- Corbetta M, Kincade MJ, Lewis C, Snyder AZ, Sapir A. Neural basis and recovery of spatial attention deficits in spatial neglect. Nat Neurosci. 2005;8:1603–1610. doi: 10.1038/nn1574. [DOI] [PubMed] [Google Scholar]
- Corbetta M, Kincade JM, Ollinger JM, McAvoy MP, Shulman GL. Voluntary orienting is dissociated from target detection in human posterior parietal cortex. Nat Neurosci. 2000;3:292–297. doi: 10.1038/73009. [DOI] [PubMed] [Google Scholar]
- Corbetta M, Patel G, Shulman GL. The reorienting system of the human brain: from environment to theory of mind. Neuron. 2008;58:306–324. doi: 10.1016/j.neuron.2008.04.017. [DOI] [PMC free article] [PubMed] [Google Scholar]
- Corbetta M, Shulman GL. Control of goal-directed and stimulus-driven attention in the brain. Nat Rev Neurosci. 2002;3:201–215. doi: 10.1038/nrn755. [DOI] [PubMed] [Google Scholar]
- Corbetta M, Shulman GL. Spatial neglect and attention networks. Ann Rev Neurosci. 2010;34:569–599. doi: 10.1146/annurev-neuro-061010-113731. [DOI] [PMC free article] [PubMed] [Google Scholar]
- DiQuattro NE, Geng JJ. Contextual knowledge configures attentional control networks. J Neurosci. 2011;31:18026–18035. doi: 10.1523/JNEUROSCI.4040-11.2011. [DOI] [PMC free article] [PubMed] [Google Scholar]
- Driver J, Blankenburg F, Bestmann S, Ruff CC. New approaches to the study of human brain networks underlying spatial attention and related processes. Exp Brain Res. 2010;206:153–162. doi: 10.1007/s00221-010-2205-7. [DOI] [PMC free article] [PubMed] [Google Scholar]
- Eickhoff S, Stephan KE, Mohlberg H, Grefkes C, Fink GR, Amunts K, Zilles K. A new SPM toolbox for combining probabilistic cytoarchitectonic maps and functional imaging data. Neuroimage. 2005;25:1325–1335. doi: 10.1016/j.neuroimage.2004.12.034. [DOI] [PubMed] [Google Scholar]
- Friston KJ, Büchel C, Fink GR, Morris J, Rolls E, Dolan RJ. Psychophysiological and modulatory interactions in neuroimaging. Neuroimage. 1997;6:218–229. doi: 10.1006/nimg.1997.0291. [DOI] [PubMed] [Google Scholar]
- Friston KJ, Harrison L, Penny W. Dynamic causal modelling. Neuroimage. 2003;19:1273–1302. doi: 10.1016/s1053-8119(03)00202-7. [DOI] [PubMed] [Google Scholar]
- Friston KJ, Holmes AP, Worsley KJ, Poline J-P, Frith CD, Frackowiak RJS. Statistical parametric maps in functional imaging: a general linear approach. Hum Brain Mapp. 1995;2:189–210. [Google Scholar]
- Gillebert CR, Mantini D, Thijs V, Sunaert S, Dupont P, Vandenberghe R. Lesion evidence for the critical role of the intraparietal sulcus in spatial attention. Brain. 2011;134:1694–1709. doi: 10.1093/brain/awr085. [DOI] [PubMed] [Google Scholar]
- Gitelman DR, Nobre AC, Parrish TB, LaBar KS, Kim YH, Meyer JR, Mesulam M. A large-scale distributed network for covert spatial attention: further anatomical delineation based on stringent behavioural and cognitive controls. Brain. 1999;122:1093–1106. doi: 10.1093/brain/122.6.1093. [DOI] [PubMed] [Google Scholar]
- Grosbras MH, Paus T. Transcranial magnetic stimulation of the human frontal eye field: effects on visual perception and attention. J Cogn Neurosci. 2002;14:1109–1120. doi: 10.1162/089892902320474553. [DOI] [PubMed] [Google Scholar]
- Kinsbourne M. Mechanisms of unilateral neglect. In: Jeannerod M, editor. Neurophysiological and neuropsychological aspect of spatial neglect. Elsevier; Amsterdam: 2003. pp. 69–85. [Google Scholar]
- He BJ, Synder AZ, Vincent JL, Epstein A, Shulman GL, Corbetta M. Breakdown of functional connectivity in frontoparietal networks underlies behavioral deficits in neglect. Neuron. 2007;53:905–918. doi: 10.1016/j.neuron.2007.02.013. [DOI] [PubMed] [Google Scholar]
- Hopfinger JB, Buonocore MH, Mangun GR. The mechanisms of top-down attentional control. Nat Neurosci. 2000;3:284–291. doi: 10.1038/72999. [DOI] [PubMed] [Google Scholar]
- Hung J, Driver J, Walsh V. Visual selection and the human frontal eye fields: effects of frontal transcranial magnetic stimulation on partial report analyzed by Bundesen’s theory of visual attention. J Neurosci. 2011;31:15904–15913. doi: 10.1523/JNEUROSCI.2626-11.2011. [DOI] [PMC free article] [PubMed] [Google Scholar]
- Macaluso E, Frith C, Driver J. Supramodal effects of covert spatial orienting triggered by visual and tactile events. J Cogn Neurosci. 2002;14:389–401. doi: 10.1162/089892902317361912. [DOI] [PubMed] [Google Scholar]
- Mesulam MM. Spatial attention and neglect: parietal, frontal and cingulate contributions to the mental representation and attentional targeting of salient extrapersonal events. Philos T R Soc B. 1999;354:1325–1346. doi: 10.1098/rstb.1999.0482. [DOI] [PMC free article] [PubMed] [Google Scholar]
- Muggleton NG, Kalla R, Juan C-H, Walsh V. Dissociating the contributions of human frontal eye fields and posterior parietal cortex to visual search. J Neurophysiol. 2011;105:2891–2896. doi: 10.1152/jn.01149.2009. [DOI] [PMC free article] [PubMed] [Google Scholar]
- Oldfield RC. The assessment and analysis of handedness: the Edinburgh Inventory. Neuropsychologia. 1971;9:97–113. doi: 10.1016/0028-3932(71)90067-4. [DOI] [PubMed] [Google Scholar]
- Paus T, Jech R, Thompson CJ, Comeau R, Peters T, Evans AC. Transcranial magnetic stimulation during positron emission tomography: a new method for studying connectivity of the human cerebral cortex. J Neurosci. 1997;17:3178–3184. doi: 10.1523/JNEUROSCI.17-09-03178.1997. [DOI] [PMC free article] [PubMed] [Google Scholar]
- Penny WD, Stephan KE, Mechelli A, Friston KJ. Comparing dynamic causal models. Neuroimage. 2004;22:1157–1172. doi: 10.1016/j.neuroimage.2004.03.026. [DOI] [PubMed] [Google Scholar]
- Penny WD, Stephan kE, Daunizeau J, Rosa MJ, Friston KJ, Schofield TM, Leff AP. Comparing families of dynamic causal models. PLoS Computational Biology. 2010;6:e1000709. doi: 10.1371/journal.pcbi.1000709. [DOI] [PMC free article] [PubMed] [Google Scholar]
- Posner MI. Orienting of attention. Q J Exp Psychol. 1980;32:3–25. doi: 10.1080/00335558008248231. [DOI] [PubMed] [Google Scholar]
- Ristic J, Giesbrecht B. Electrophysiological evidence for spatiotemporal flexibility in the ventrolateral attention network. PLoS One. 2011;6:e24436. doi: 10.1371/journal.pone.0024436. [DOI] [PMC free article] [PubMed] [Google Scholar]
- Roebroeck A, Formisano E, Goebel R. Mapping directed influence over the brain using Granger causality and fMRI. Neuroimage. 2005;25:230–242. doi: 10.1016/j.neuroimage.2004.11.017. [DOI] [PubMed] [Google Scholar]
- Ruff CC, Bestmann S, Blankenburg F, Bjoertomt O, Josephs O, Weiskopf N, Deichmann R, Driver J. Distinct causal influences of parietal versus frontal areas on human visual cortex: evidence from concurrent TMS-fMRI. Cereb Cortex. 2008a;18:817–827. doi: 10.1093/cercor/bhm128. [DOI] [PMC free article] [PubMed] [Google Scholar]
- Ruff CC, Blankenburg F, Bjoertomt O, Bestmann S, Freeman E, Haynes JD, Rees G, Josephs O, Deichmann R, Driver J. Concurrent TMS-fMRI and psychophysics reveal frontal influences on human retinotopic visual cortex. Curr Biol. 2006;16:1479–1488. doi: 10.1016/j.cub.2006.06.057. [DOI] [PubMed] [Google Scholar]
- Ruff CC, Blankenburg F, Bjoertomt O, Bestmann S, Weiskopf N, Driver J. Hemispheric differences in frontal and parietal influences on human occipital cortex: direct confirmation with concurrent TMS-fMRI. J Cogn Neurosci. 2008b;21:1146–1161. doi: 10.1162/jocn.2009.21097. [DOI] [PMC free article] [PubMed] [Google Scholar]
- Shulman GL, Astafiev SV, Franke D, Pope DL, Synder AZ, McAvoy MP, Corbetta M. Interaction of stimulus-driven reorienting and expectation in ventral and dorsal frontoparietal and basal ganglia-cortical networks. J Neurosci. 2009;29:4392–4407. doi: 10.1523/JNEUROSCI.5609-08.2009. [DOI] [PMC free article] [PubMed] [Google Scholar]
- Shulman GL, McAvoy MP, Cowan MC, Astafiev SV, Tansy AP, d’Avossa G, Corbetta M. Quantitative analysis of attention and detection signals during visual search. J Neurophysiol. 2003;90:3384–3397. doi: 10.1152/jn.00343.2003. [DOI] [PubMed] [Google Scholar]
- Silvanto J, Lavie N, Walsh V. Stimulation of the human frontal eye fields modulates sensitivity of extrastriate visual cortex. J Neurophysiol. 2006;96:941–945. doi: 10.1152/jn.00015.2006. [DOI] [PubMed] [Google Scholar]
- Simpson GV, Weber DL, Dale CL, Pantazis D, Bressler SL, Leahy RM, Luks TL. Dynamic activation of frontal, parietal, and sensory regions underlying anticipatory visual spatial attention. J Neurosci. 2011;31:13880–13889. doi: 10.1523/JNEUROSCI.1519-10.2011. [DOI] [PMC free article] [PubMed] [Google Scholar]
- Sridharan D, Levitin DJ, Chafe CH, Berger J, Menon V. Neural dynamics of event segmentation in music: converging evidence for dissociable ventral and dorsal networks. Neuron. 2007;55:521–532. doi: 10.1016/j.neuron.2007.07.003. [DOI] [PubMed] [Google Scholar]
- Stephan KE, Marshall JC, Penny WD, Friston KJ, Fink GR. Interhemispheric integration of visual processing during task-driven lateralization. J Neurosci. 2007;27:3512–3522. doi: 10.1523/JNEUROSCI.4766-06.2007. [DOI] [PMC free article] [PubMed] [Google Scholar]
- Stephan KE, Penny WD, Daunizeau J, Moran RJ, Friston KJ. Bayesian model selection for group studies. Neuroimage. 2009;46:1004–1017. doi: 10.1016/j.neuroimage.2009.03.025. [DOI] [PMC free article] [PubMed] [Google Scholar]
- Szczepanski SM, Konen CS, Kastner S. Mechanisms of spatial attention control in frontal and parietal cortex. J Neurosci. 2010;30:148–160. doi: 10.1523/JNEUROSCI.3862-09.2010. [DOI] [PMC free article] [PubMed] [Google Scholar]
- Taylor PCJ, Nobre AC, Rushworth MFS. FEF TMS affects visual cortex activity. Cereb Cortex. 2007;17:391–399. doi: 10.1093/cercor/bhj156. [DOI] [PubMed] [Google Scholar]
- Thiel CM, Zilles K, Fink GR. Cerebral correlates of alerting, orienting and reorienting of visuospatial attention: an event-related fMRI study. Neuroimage. 2004;21:318–328. doi: 10.1016/j.neuroimage.2003.08.044. [DOI] [PubMed] [Google Scholar]
- Umarova RM, Daur D, Schnell S, Kaller CP, Vry M-S, Glauche V, Rijntjes M, Hennig J, Kiselev V, Weiller C. Structural connectivity for visuospatial attention: significance of ventral pathways. Cereb Cortex. 2010;20:121–129. doi: 10.1093/cercor/bhp086. [DOI] [PubMed] [Google Scholar]
- Vandenberghe R, Geeraerts S, Molenberghs P, Lafosse C, Vandenbulcke M, Peeters K, Peeters R, Van Hecke P, Orban GA. Attentional responses to unattended stimuli in human parietal cortex. Brain. 2005;128:2843–2857. doi: 10.1093/brain/awh522. [DOI] [PubMed] [Google Scholar]
- Vandenberghe R, Gillebert S. Parcellation of parietal cortex: convergence between lesion-symptom mapping and mapping of the intact functioning brain. Behav Brain Res. 2009;199:171–182. doi: 10.1016/j.bbr.2008.12.005. [DOI] [PubMed] [Google Scholar]
- Vossel S, Thiel CM, Fink GR. Cue validity modulates the neural correlates of covert endogenous orienting of attention in parietal and frontal cortex. Neuroimage. 2006;32:1257–1264. doi: 10.1016/j.neuroimage.2006.05.019. [DOI] [PubMed] [Google Scholar]
- Vossel S, Weidner R, Thiel CM, Fink GR. What is “odd” in Posner’s location-cueing paradigm? Neural responses to unexpected location and feature changes compared. J Cognitive Neurosci. 2009;21:30–41. doi: 10.1162/jocn.2009.21003. [DOI] [PubMed] [Google Scholar]
- Vossel S, Weidner R, Fink GR. Dynamic coding of events within the inferior frontal gyrus in a probabilistic selective attention task. J Cogn Neurosci. 2011;23:414–424. doi: 10.1162/jocn.2010.21441. [DOI] [PubMed] [Google Scholar]
- Vuilleumier P, Schwartz S, Verdon V, Maravita A, Hutton C, Husain M, Driver J. Abnormal attentional modulation of retinotopic cortex in parietal patients with spatial neglect. Current Biology. 2008;18:1525–1529. doi: 10.1016/j.cub.2008.08.072. [DOI] [PMC free article] [PubMed] [Google Scholar]