

Abstract
Ca2+ release events (Ca2+‘sparks’), which are believed to arise from the opening of a sarcoplasmic reticulum (SR) Ca2+ release channel or a small cluster of such channels that act as a release unit, have been measured in single, frog (Rana pipiens) skeletal muscle fibres.
Under conditions of extremely low rates of occurrence of Ca2+ sparks we observed, within individual identified triads, repetitive Ca2+ release events which occurred at a frequency more than 100-fold greater than the prevailing average event rate. Repetitive sparks were recorded during voltage-clamp test depolarizations after a brief (0.3–2 s) repriming interval in fibres held at 0 mV and in chronically depolarized, ‘notched’ fibres.
These repetitive events are likely to arise from the re-opening of the same SR Ca2+ release channel or release unit operating in a repetitive gating mode (‘rep-mode’), rather than from the random activation of multiple, independent channels or release units within a triad. A train of rep-mode events thus represents a series of Ca2+ sparks arising from a single location within the fibre. Rep-mode events are activated among different triads in a random manner after brief repriming. The frequency of repetitive events among all identified events during voltage-clamp depolarization to 0 mV after brief repriming was 3.9 ± 1.3%. The occurrence of repetitive events was not related to exposure of the fibre to laser illumination.
The events observed within a rep-mode train exhibited a relatively uniform amplitude. Analysis of intervals between identified events in triads exhibiting rep-mode trains indicated similar variations of fluorescence as in neighbouring, quiescent triads, suggesting there was not a significant number of small, unidentified events at the triads exhibiting rep-mode activity.
The distribution of rep-mode interspark intervals exhibited a paucity of events at short intervals, consistent with the need for recovery from inactivation before activation of the next event in a repetitive train. The mean interspark interval of repetitive sparks during voltage-clamp depolarizations was 88 ± 5 ms, and was independent of membrane potential.
The individual Ca2+ sparks within a rep-mode train were similar in average amplitude and spatiotemporal extent to singly occurring sparks, suggesting a common mechanism for termination of the channel opening(s) underlying both types of events. The average properties of the sparks did not vary during a train. The relative amplitude of a spark within a rep-mode was not correlated with its rise time.
Repetitive Ca2+ release events represent a mode of gating of SR Ca2+ release channels which may be significant during long depolarizations and which may be influenced by the biochemical state of the SR ryanodine receptor Ca2+ release channels.
Depolarization of a skeletal muscle fibre results in the release of calcium ions (Ca2+) from the sarcoplasmic reticulum (SR). The activation of transverse (t-) tubular membrane voltage sensors (dihydropyridine receptors, DhpR) causes the opening of Ca2+ release channels (ryanodine receptors, RyR) in the membrane of the adjacent, junctional SR, resulting in release of Ca2+ into the myoplasm and consequent contractile activation.
Recently, measurements of discrete Ca2+ release events, or Ca2+‘sparks’, have been described in skeletal muscle. These events are thought to arise from the opening of single RyR Ca2+ channels, or small clusters of such channels. Ca2+ sparks have been measured in voltage-clamped skeletal fibres during small depolarizations in fully polarized fibres (Tsugorka et al. 1995; Klein et al. 1996; Schneider & Klein, 1996), and during small and large depolarizations following brief (0.5-2 s) repriming intervals at -90 mV in fibres held at 0 mV (Lacampagne et al. 1996; Klein et al. 1997). Finally, spontaneous Ca2+ sparks having similar rise time, amplitude and spatial spread have also been recorded in polarized or depolarized fibres (Klein et al. 1996), albeit at a much lower frequency. The activation of these spontaneous events is modulated not by depolarization, but by the binding of myoplasmic ligands such as Ca2+ and Mg2+ to the RyRs (Klein et al. 1996; Lacampagne et al. 1998).
Calcium release during depolarization of skeletal muscle is steeply dependent on membrane voltage. However, the average properties (rise time, amplitude, spatiotemporal spread) of discrete Ca2+ sparks are voltage independent (Lacampagne et al. 1996), so depolarization does not appear to modulate the properties of individual events. Rather, depolarization modulates the pattern and frequency of occurrence of Ca2+ sparks over the voltage range of activation of calcium release, accounting for both the increase in release with increasing depolarization, and the time course of release during a maintained depolarization (Klein et al. 1997). Thus, much of the voltage dependence of calcium release can be accounted for by the pattern and frequency of occurrence of individual Ca2+ sparks with similar characteristics at all voltages.
The present article describes the properties of a repetitive mode of activation of Ca2+ sparks in skeletal muscle fibres, which is manifest as a brief train of several sparks activated by membrane depolarization or by ligand binding, even when the overall event rate in the fibre is extremely low. These repetitive events appear to arise from the repeated activation of a single SR Ca2+ release unit within a triad, and thus provide the opportunity for studying the gating properties of an individual Ca2+ release unit. This heretofore uncharacterized mode of gating of Ca2+ sparks in skeletal muscle may arise from direct modulation of SR RyR Ca2+ release channels, and may contribute to the slowly inactivating component of Ca2+ release during a prolonged depolarization.
METHODS
The procedures for isolation and mounting of single skeletal fibres, for measurements of Ca2+ sparks by confocal linescan imaging for voltage-clamp experiments (Klein et al. 1996), and for measurement of spontaneous sparks (Lacampagne et al. 1998) are the same as described previously. Briefly, frogs (Rana pipiens) were killed by decapitation and spinal cord destruction, following protocols approved by the University of Maryland Institutional Animal Care and Use Committee. Segments of single fibres from the ileofibularis muscle were isolated in a ‘relaxing’ solution containing (mM): 120 potassium glutamate, 2 MgCl2, 0.01 EGTA, 5 sodium tris-maleate, pH 7.0. For voltage repriming experiments, the fibre segment was mounted in a double Vaseline gap voltage-clamp chamber (Klein et al. 1996; Schneider & Klein, 1996) in relaxing solution. The regions of the fibre within the end-pools were permeabilized (0.01% w/v saponin in relaxing solution, 30 s), then exposed to an ‘internal’ solution containing (mM): 80 caesium glutamate or potassium glutamate, 5.5 MgCl2, 5 Na2ATP, 4.5 sodium tris-maleate, 13.2 caesium tris-maleate, 0.1 EGTA, 20 sodium creatine phosphate, 5 glucose, 1 dithiothreitol, 0.05 fluo-3 free acid, pH 7.0. The region of the fibre in the central pool, where the membrane potential was controlled by the voltage-clamp circuitry, and from which confocal linescan images were acquired during the voltage-clamp pulses, was exposed to an ‘external’ solution containing (mM): 125 TEA methanesulfonate, 5 Cs+-Hepes, 2 CaCl2, 3 × 10⁻⁴ TTX, pH 7.0. For measurement of spontaneous Ca2+ sparks, the fibre segment was transferred to a single-pool chamber (Lacampagne et al. 1998) containing relaxing solution, and mechanically clamped at both ends against the glass coverslip floor of the chamber. The fibre segment was exposed to internal solution (above) then ‘notched’ at two or three discrete locations (Lacampagne et al. 1998). For both series of experiments, the fibre segments were stretched to a sarcomere spacing of 3.2-3.8 μm. The temperature was 23°C.
The tissue chamber was placed on the stage of an Olympus IX-70 inverted microscope (with Olympus 60 × 1.4 NA oil-immersion objective lens) which was interfaced to a Bio-Rad (Hercules, CA, USA) MRC-600 laser-scanning confocal system operating in linescan (x vs. t) mode (2 ms per line). The tissue chambers were designed so as to reduce by as much as possible the distance between the coverslip and fibre, thus minimizing aberrations due to refractive index mismatch between the aqueous bath and the objective immersion medium (Hell et al. 1993). Furthermore, linescan measurements were always taken from regions of the fibre close to the coverslip. These practices, and the experimental restriction to conditions of low activation of Ca2+ sparks (see below), resulted in the greatest signal-to-noise ratio achieved on our apparatus to date. The calculation of ΔF/F from images of fluorescence (F)and the criteria for visual identification of discrete Ca2+ sparks and calculation of single-triad time course records of ΔF/F were as outlined previously (Lacampagne et al. 1996, 1998). The rise time of individual events was determined by interpolation between values obtained at 2 ms intervals and was equal to the time from the last crossing of 10% to the first crossing of 90% of the peak amplitude of the spark (Klein et al. 1997).
RESULTS
Repetitive Ca2+ sparks observed when the average spark frequency was extremely low
Figure 1 shows a confocal linescan image exhibiting several Ca2+ sparks activated during a test depolarization. The fibre was held at 0 mV then reprimed at -90 mV for 1 s, after which a test pulse to -40 mV was applied for 400 ms. The image shows the final 84 ms of the repriming period, the 400 ms test pulse to -40 mV, and 216 ms of a step back to -90 mV, before returning to the holding potential of 0 mV (not shown). Figure 1 shows that only six of the thirty-eight triads identified in this image exhibited spark activity, while the total number of identified Ca2+ sparks in the image was eleven. Of the six active triads in Fig. 1, five exhibited a single event during the depolarization, while the sixth exhibited six events. If the appearance of each Ca2+ spark corresponds to the activation of a different reprimed voltage sensor and its associated release channel(s) (i.e. 1 release unit) then the average number of different release units activated per triad was 0.29 (= 11 sparks/38 triads). Thus, on average, many fewer than one release unit were activated per triad during the depolarization in Fig. 1. Under such conditions of low average activity, it would appear to be highly unlikely that the six-event triad in Fig. 1 occurred by random activation of six independent release units at one triad.
Figure 1. Repetitive Ca2+ sparks within a single triad during a voltage-clamp depolarization.
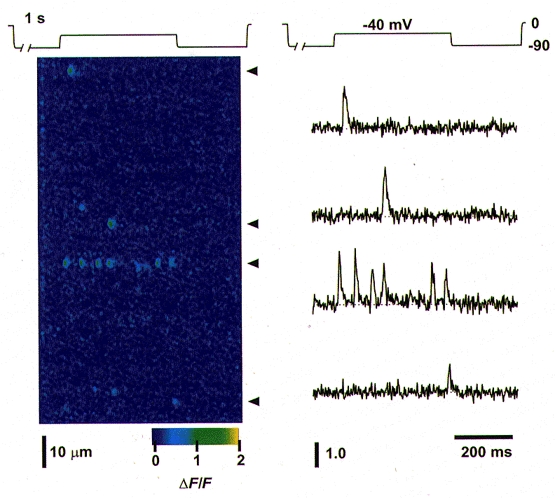
A fibre held at 0 mV was reprimed at -90 mV for 1 s, then stepped to -40 mV for 400 ms (test pulse), then returned to -90 mV before stepping back to the holding potential (see pulse protocol above image). Left, confocal linescan image (x vs. t, with x parallel to the fibre axis) showing Ca2+ sparks activated during the test pulse, displayed in pseudocolour as ΔF/F. Of the 38 triads within this image, only 6 triads exhibited spark activity during the depolarization, with 5 triads showing a single event, and the 6th triad showing 6 events. These 6 events probably arose from the repetitive activation of a single SR Ca2+ release unit (see text). A small elevation of fluorescence occurring between the 4th and 5th events of the 6-event triad was probably an out-of-focus event originating in another triad, and did not fulfill the criteria for identification as a spark. Right, single-triad time course records of ΔF/F, corresponding to the triads identified by arrowheads in the left panel. Note the similarity in the time course of the sparks within the single-event triads as compared with individual events in the multi-event triad. Fibre 012097c; sarcomere length, 3.8 μm.
The average number of events per triad during the 400 ms depolarization in the image of Fig. 1 and from the three other linescan images in the run (in which no triads exhibited multiple events; not shown) was 0.112, corresponding to an average event rate of 0.28 sarcomeres−1 s−1. Since there are roughly 100 to 200 voltage sensors within the confocal sampling volume, corresponding approximately to the volume of a 1 μm sphere centred at the Z-line in a frog skeletal muscle fibre (F. Protasi and C. Franzini-Armstrong, personal communication cited in Klein et al. 1997), the probability that a given voltage sensor and its associated release channels was activated during the depolarization in Fig. 1 and the three other images in the same run was very low. Under such conditions of low probability of activation of individual units within a relatively large pool, the Poisson equation can be used to test whether an observed pattern of events is consistent with random, independent activation of individual units (cf. Del Castillo & Katz, 1954). If the SR Ca2+ release units were equivalent, independent and activated in a stochastic manner, the Poisson equation predicts that the probability, PX, of observing an X-event triad is given by PX =mXe-m/X! (Katz, 1966), where m is the mean number of observed events per triad. From the data of Fig. 1 and from the three other images in the run, the value of m was 0.112, from which the Poisson equation predicts probabilities of 0.895, 0.10 and 0.006 for triads with 0, 1 and 2 events, respectively. These predicted probabilities agreed relatively well with the corresponding observed fractions of 0.928, 0.059 and 0.007 for triads exhibiting 0, 1 or 2 events.
The probability of observing a six-event triad predicted by the Poisson equation for the image in Fig. 1 and the three other images in the run was 2.4 × 10⁻⁷. This low probability makes it extremely unlikely that the six events observed in the most active triad in Fig. 1 arose from the random activation of six independent SR Ca2+ release units having the same probability of exhibiting an event as observed over all triads. Instead, it is more likely that the later opening events in the six-event triad corresponded to re-openings of a single SR Ca2+ release unit which was activated initially by voltage sensor activation during the depolarization. In that case, the mean number of different release units that were activated per triad would be only 0.079 in Fig. 1 and the three other images in the run. Using 0.079 for m, the Poisson equation predicts values of 0.924, 0.073 and 0.003 for the probabilities of 0, 1 or 2 event triads, even closer to those obtained for the prediction with m equal to 0.112 by including the six-event triad, strengthening the argument that the two events at a triad arose independently but the six events at one triad did not.
The very low levels of activity in the present repriming experiments permit the identification of repeated activity at a given triad as arising from the same activated release unit. In contrast, the pattern of activation by depolarization in a fully polarized fibre (Klein et al. 1996) or in a more completely reprimed fibre (Lacampagne et al. 1996; Klein et al. 1997), in which Ca2+ sparks were activated at a higher average frequency, does not ensure that multiple events per triad can be unambiguously assigned to the same release unit. In that case at least some of the multiple events at a given triad are likely to arise from the activation of multiple, independent release units per triad.
The right panel of Fig. 1 shows single-triad time course records of four triads exhibiting activity during the test depolarization, including the six-event triad. The individual events within the train of six events are generally similar in amplitude and time course to the single events occurring in other triads during the pulse. This panel also shows that the individual events were relatively large compared with the baseline noise, and that there is little evidence for the appearance of smaller events which might have gone undetected by our visual identification procedures. These two points are considered in more detail below.
The appearance of multi-event triads during depolarizations after brief repriming periods when the average activation of Ca2+ sparks was low suggests that this behaviour of Ca2+ sparks may represent a previously uncharacterized mode of gating of SR Ca2+ release channels in skeletal muscle. In the analysis that follows, the appearance of repetitive sparks at a given triad at a frequency much higher than the average frequency over the entire fibre as described in connection with Fig. 1 will be referred to as ‘rep-mode’. The occurrence of rep-mode during a depolarizing pulse will be operationally defined as a given triad exhibiting four or more events during a 500 ms test pulse or exhibiting a mean event rate > 8 s−1 for depolarizations lasting longer than 500 ms, with no more than 30% of all triads exhibiting any spark activity in the same linescan image.
Figure 2A-D shows a sequence of four successive linescan images during a voltage pulse protocol in which another fibre was held at 0 mV, reprimed at -90 mV for 300 ms and then stepped to 0 mV for 400 ms, before being repolarized back to -90 mV and then stepped back to the 0 mV holding potential (not shown) for 30 s before application of the next pulses. In this protocol, the large test pulse, to 0 mV, ensured a high probability that any reprimed voltage sensor would become activated during the depolarization (Klein et al. 1997). In Fig. 2A, the first pulse of the run, seven of thirty-seven triads (19%) exhibited at least one detectable event, with four triads giving one event, two triads two, and one triad three. Thus, rep-mode activity was not detected in this image. The next three images of the run (Fig. 2B-D) exhibited multi-event, rep-mode activity during the test pulse while the number of active triads remained low, with only 13-27% of triads active. In Fig. 2B a single triad, near the bottom of the image, exhibited rep-mode activity. In Fig. 2C, two different triads exhibited multi-event rep-mode activity, and in Fig. 2D a single triad exhibited rep-mode behaviour. Figure 2, and results from other fibres (not shown), demonstrates that in each linescan image a different triad showed repetitive spark activity. The appearance of rep-mode in different triads from pulse to pulse implies that either the prolonged depolarization between repriming episodes or some other factor operating over the time period of about 30 s, or both, eliminates the tendency for a given triad to exhibit rep-mode behaviour. In some cases, a given triad exhibited rep-mode behaviour in one repriming episode but single, non-rep-mode sparks in another, demonstrating a change in gating mode between trials within the same triad. Thus the occurrence of this activation mechanism is transient at the level of an individual triad, and thus is different from the ‘eager’ triads described by Blatter et al. (1996). The termination of the test pulse always terminated the rep-mode behaviour. This suggests that when this repetitive mode of activation of SR Ca2+ release channels is initiated by voltage sensor activation during depolarization, continued voltage sensor activation is required for continuation of the train of repetitive events. Finally, in Fig. 2 the rep-mode events were activated during test depolarizations to 0 mV, whereas in Fig. 1, the phenomenon was observed during a test depolarization to -40 mV, indicating that repetitive events can be activated over a wide voltage range during depolarization (see below).
Figure 2. Random occurrence of repetitive rep-mode sparks in triads during successive test depolarizations.
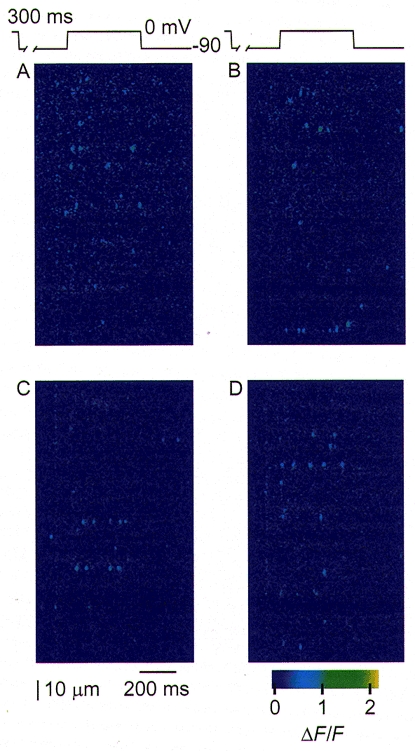
The fibre was reprimed at -90 mV for 300 ms, then given a 400 ms test depolarization to 0 mV, a step back to -90 mV (see pulse protocol above images) and a final return to 0 mV (not shown). A-D represent 4 applications of this protocol in successive linescan images acquired at the same location of the fibre, separated in time by 30 s. In A, no triads exhibited repetitive rep-mode sparks during the depolarization, but in B, 1 triad near the bottom of the image showed such a train of repetitive sparks. In C, 2 different triads exhibited rep-mode activity while in D, yet another triad showed repetitive spark activity. These results demonstrate that the tendency to exhibit repetitive rep-mode sparks is not a fixed property of any particular triad but that rep-mode is activated randomly among triads. Fibre 110596b; sarcomere length, 3.8 μm.
The relative frequency of rep-mode sparks was determined by counting the total number of repetitive events which conformed to the definition of rep-mode (above), and the total of all identified events. In six fibres which exhibited repetitive sparks, rep-mode events accounted for 3.9 ± 1.3% of all events during voltage-clamp depolarizations to 0 mV after brief repriming periods. Thus rep-mode occurs relatively rarely under the conditions employed here.
Rep-mode in chronically depolarized, ‘notched’ fibres
Our ability to distinguish rep-mode behaviour at an individual triad from random openings of SR Ca2+ release units at the average event rate throughout the fibre relies on a low average Ca2+ spark frequency. The lower the average spark rate, the less likely that multiple events in a given triad arise from random activation of independent release units within that triad at the average event rate observed over the entire fibre. The frequency of spontaneous Ca2+ sparks in notched fibres can be modulated by varying the free [Mg2+] of the internal solution (see Methods, and Lacampagne et al. 1998) such that the average event rate can be made arbitrarily low. Under such conditions of low average activity, we have been able to detect rep-mode behaviour in ‘spontaneous’, presumably ligand-activated events. Rep-mode was operationally defined in spontaneous spark experiments as the occurrence of at least four sparks at a frequency of > 8 s−1, with fewer than 30% of all triads exhibiting spark activity. Figure 3 shows a sequence of five successive images (Fig. 3A-E) from a notched fibre experiment in which a single triad exhibited considerable rep-mode behaviour in three of the five images of the run. In this case, spontaneous rep-mode trains recurred at the same triad. Thus the underlying mechanism causing rep-mode events was evidently active over many seconds. Other triads within these five images were largely inactive. The average event rate in all triads excluding the one active triad was extremely low, 0.05 sarcomeres−1 s−1. However, the average event rate within the active triad over the 5.1 s recording interval was 5.2 sarcomeres−1 s−1, more than 100-fold higher than the average rate of the other triads, and was even higher during the actual trains of activity in Fig. 3A-E. If the average event rate applied to the active triad as well, then the probability is extremely low that the twenty-four sparks detected in 5.1 s at a single triad as seen in Fig. 3 were due to random, independent events.
Figure 3. Spontaneous rep-mode spark activity in a chronically depolarized fibre.
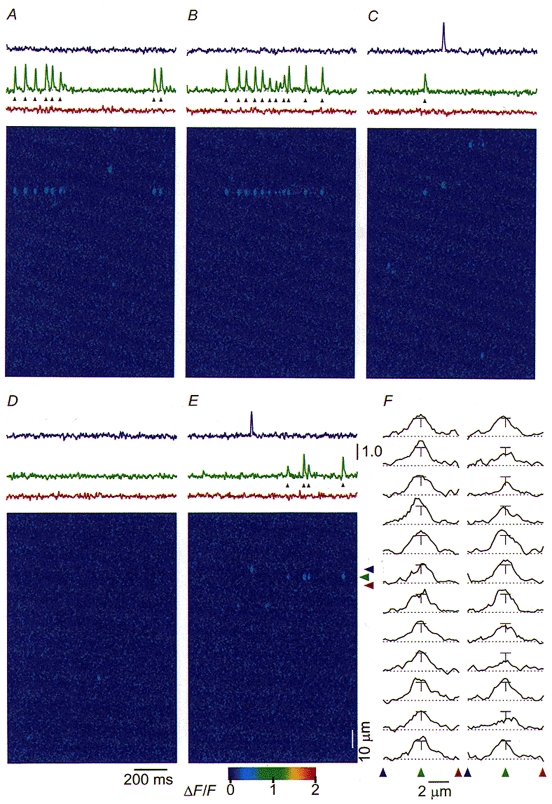
The images (A-E) represent 5 successive 1 s duration linescan images acquired from the same region of the fibre at 2 s intervals. A single triad (indicated by the green arrowhead) exhibited trains of spark activity in 3 of the 5 images, while the other triads in the image showed much lower average activity and no indication of repetitive events. The single-triad records of ΔF/F for the indicated triad (green arrowhead and record) and the two adjacent triads (red and blue arrowheads and records) are shown above the images. F shows the spatial profiles at the time of the peak of the 24 sparks identified in the active triad, spatially centred at the green arrowhead, demonstrating that most of the sparks are centred at the same spatial line within the images, and suggesting that each spark in the train arises from the same triad. The T-shaped bars on each plot are 0.5-1.0 units of ΔF/F vertically, and 1 μm horizontally. Each identified spark is indicated by a black arrowhead below the green traces above the images in A-E. The red, green and blue arrowheads to the side of the image and the scale bars in E also apply to A-D. Fibre 012097b; sarcomere length, 3.6 μm
The single-triad time courses of the active triad, and those of the two triads adjacent to the active one, during the five images of Fig. 3 are shown above the images. The timing of events in the record from the active triad is reminiscent of the timing of single ion channel openings in recordings exhibiting single opening and re-opening behaviour. Two points are relevant to the determination of event properties during this rep-mode train. (i) Since the average event rate in the notched fibre experiments is considerably lower than in a typical voltage-clamp repriming experiment, it is even less likely that the observed spontaneous, repetitive spark activity arises from the random activation of multiple SR Ca2+ release units having the same probability of activation as observed in triads exhibiting non-repetitive events. (ii) There is less elevation of background fluorescence due to events which occur outside the sampled fibre volume, resulting in an increased signal-to-noise ratio. This makes the detection of smaller sparks by a visual identification procedure more reliable.
Figure 3F shows plots of the spatial profiles of the twenty-four identified sparks in Fig. 3A-E, taken as the average of three spatial lines centred at the time of the peak of each spark. These sparks are indicated by black arrowheads in the single-triad time course records above the images. The plots show that the spatial centre of each spark occurs at nearly the same point within the image, as estimated from the location of the peak of the spatial profile. Thus, the sparks in the rep-mode train of Fig. 3A-E are centred at the same location along the scan line, and therefore arise from within the same triad. Due to limitations of the resolution of the confocal system, the spatial centres of sparks arising at different points along the t-tubule of a given triad would probably be indistinguishable in plots such as in Fig. 3F. Also, events originating from channels in junctional SR on opposite sides of the t-tubule would not be distinguishable by the confocal system.
Paucity of small events within rep-mode trains
If rep-mode activity corresponds to the re-opening of a single SR Ca2+ release unit within a triad (see below), events of different amplitude within a rep-mode train cannot arise from differences in the relative position of the origin of the events with respect to the location of the confocal scan-line (cf. Pratusevich & Balke, 1996). Rather, any observed variation of event amplitudes in Figs 1 and 3 within a rep-mode train probably arises from variations in the open time or Ca2+ efflux rate of the channel(s) underlying the sparks or in the number of channels contributing to a spark, but not to out-of-focus events. This provides a unique opportunity to examine relative amplitudes of groups of events in rep-mode trains in which differences in event amplitudes cannot be due to differences in event location relative to the scan line, but must instead reflect true differences in the amount of Ca2+ released by the channel or channels underlying the sparks.
An important consideration when identifying Ca2+ release events using our visual detection procedure (see Methods) is the possibility that small events, perhaps arising from relatively brief openings of the channel(s) underlying a spark, go undetected, resulting in an underestimation of the channel activity within a given triad. For example, a finite state channel activation scheme with constant transition rate constants predicts an open time distribution in the form of declining multiple exponential functions (Colquhoun & Hawkes, 1982). If such a generalized scheme applies to the SR Ca2+ release channels which give rise to Ca2+ sparks, then qualitatively, briefer openings should occur more frequently than longer ones and, therefore, smaller discrete Ca2+ release events should be more frequent than larger ones. These putative brief, frequent openings might not be identified by our detection procedure if the amplitude of the resulting Ca2+ sparks would be below the threshold criteria for identification. However, they would still contribute to the elevation of indicator-related fluorescence, and their occurrence can thus be assessed by considering the variance of fluctuations of indicator-related fluorescence (Shirokova & Rios, 1997).
Figure 4 shows an examination of this idea. The linescan image (Fig. 4A) shows the occurrence of spontaneous rep-mode sparks within an identified triad (shown by the arrowhead labelled 2), with no obvious spark activity in the other triads of the image. Figure 4B shows the time course of ΔF/F within the identified triad exhibiting rep-mode behaviour, and within the two adjacent triads (arrowheads labelled 1 and 3) that exhibited no identified events. This figure demonstrates that spark activity in any given triad is limited to that triad, and does not influence the estimation of activity in adjacent triads. Figure 4C shows the time-dependent variance of fluctuations of fluorescence, σ2(t), of the active triad and the inactive ones. The variance, σ2(t), was calculated as proportional to (F(t) - F‘(t))2, where F‘(t) is the average time course of fluorescence within the image. The occurrence of Ca2+ sparks gives rise to large transient increases in the σ2(t) of Fig. 4C, as expected (Shirokova & Rios, 1997). The regions of the record between identified sparks have a non-zero variance which is considerably less than the variance associated with sparks. Indeed, the variance of fluorescence fluctuations between identified events in the triad exhibiting spark activity is similar to the variance of the adjacent, inactive triads (Fig. 4C), suggesting that the frequency of putative undetected sparks giving rise to fluorescence fluctuations was similar in triads exhibiting identifiable repetitive activity and in triads ostensibly exhibiting no activity. If there were events in the active triad which were not identified by our visual selection procedure, we would expect the variance corresponding to these events to be significantly greater than the variance in quiescent triads, which was not observed. Similar observations were made in twelve other fibres exhibiting rep-mode behaviour by comparing the mean variance of fluorescence fluctuations in the time intervals between identified events in active triads with the mean variance of fluorescence in adjacent, inactive triads. Thus, it appears that there was no higher probability of occurrence of undetected events interspersed between detected rep-mode events than in entirely inactive triads, indicating that rep-mode activity was not associated with an increase in putative smaller, undetected events.
Figure 4. Estimation of the contribution of small events during a rep-mode train.
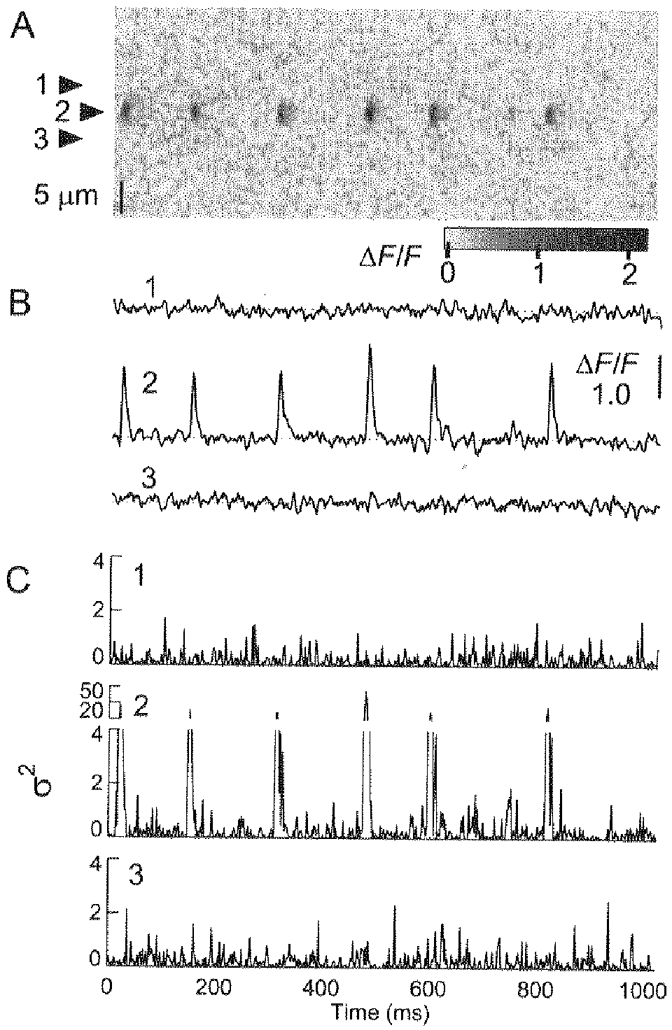
A, linescan image showing a single triad (arrowhead labelled 2) exhibiting a rep-mode train consisting of 6 sparks. B, single-triad time courses of ΔF/F exhibiting spark activity within the active triad, or no identified spark activity in 2 triads (arrowheads labelled 1 and 3 in A) adjacent to the active one. C, variance of fluorescence fluctuations (σ2) of the single-triad records presented in B, showing that the identified sparks resulted in a large increase of σ2. In contrast, the regions of record 2 between identified sparks had a value for σ2 which was similar to ostensibly inactive triads (1 and 3). Fibre 101196a; sarcomere length, 3.2 μm
An alternative approach to identifying discrete Ca2+ release events is to consider that any channel opening gives rise to a discrete elevation of fluorescence, whose amplitude is related to the conductance and open time of the release channel(s) and to the number of channels involved, so that any elevation of fluorescence above the baseline is due to channel activity. We therefore analysed single-triad ΔF/F records of the kind shown in Fig. 4B using a systematic objective iterative search for the local maximum change of fluorescence within the record, with the idea that such a local maximum of fluorescence could be due to a spark. In order to eliminate fluctuations due to random ‘shot’ noise, we considered the maximum ΔF/F to be given by the two successive points having the greatest mean ΔF/F within the record. These two points, together with three points (i.e. 6 ms) before and ten points (20 ms) after this local maximum, were then zeroed in the record to account for the rising and falling phases of the possible spark corresponding to the detected peak. The search was then repeated for the next maximum of ΔF/F, and the procedure was repeated until > 80% of the record was zeroed by the search and identification of local maxima. The zeroing of 14-point segments of the record minimized the possibility of larger sparks being counted twice.
Figure 5A shows histograms of the maximum values of ΔF/F determined as outlined above for the records of Fig. 4B. The maximum value histogram of the triad exhibiting identified events (Fig. 5A, upper histogram; values obtained from record 2 in Fig. 4B) shows a grouping of six points at values of ΔF/F between 1.5 and 2.5, corresponding to the six visually identified Ca2+ sparks themselves, and another grouping at ΔF/F values between zero and 0.4, corresponding to smaller local elevations of fluorescence. This latter grouping is similar in amplitude and distribution to the maximum-value histogram of the two neighbouring triads in which no Ca2+ sparks were identified (Fig. 5A, lower histogram; values obtained from records labelled 1 and 3 in Fig. 4B). The paucity of values of peak ΔF/F greater than 0.4 but less than the amplitude of identified events indicates that no local maximal values were found corresponding to intermediate elevations of fluorescence in the active triad in this fibre, even though these values are (i) well above the signal-to-noise level of the baseline, and (ii) expected to occur more frequently than larger events, given the predicted open time histogram of a generalized kinetic scheme for channel activation (above).
Figure 5. Amplitude histograms and sequential selection of local elevations of fluorescence and average rep-mode and non-rep-mode sparks in 1 fibre.
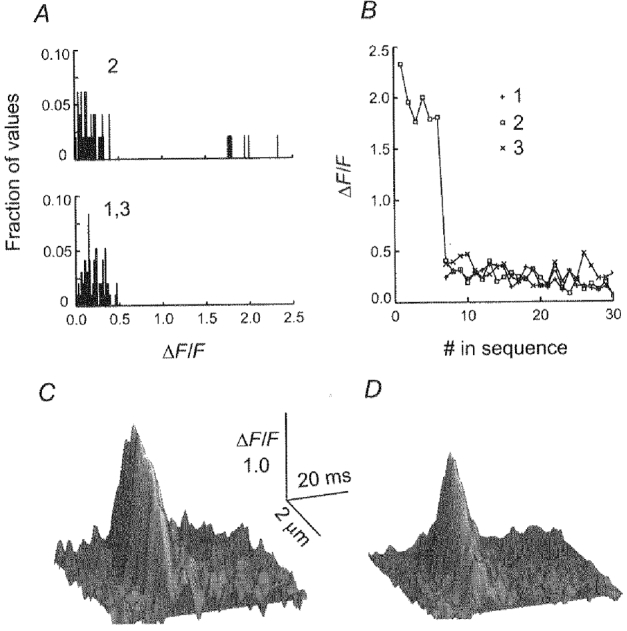
In A, histograms were constructed by locating the local maximum of fluorescence of single-triad ΔF/F records, zeroing a 14-point region containing this maximum, and then locating the next maximum and repeating the procedure, until > 80% of the record was zeroed (see text). This operation was performed on the 3 single-triad ΔF/F records in Fig. 4B, labelled 1-3. The upper histogram represents triad 2, while the lower histogram represents triads 1 and 3 in Fig. 4. Note that the 6 visually identified sparks in panel 2 of Fig. 4B were identified by the algorithm (represented as the 6 bars between ΔF/F values of 1.4 and 2.3). In contrast, the remaining local elevations within the record were distributed similarly to the histograms of the two adjacent triads (bottom histogram; panels 1 and 3 in Fig. 4) which showed ostensibly no spark activity. B, sequentially selected values of local maximum of fluorescence of single-triad ΔF/F records (above) for the triad exhibiting rep-mode activity (□) and for the two adjacent triads (+ and ×). Note that the selection sequence was based on the largest remaining average value to 2 adjacent points whereas the values plotted correspond to the maximum amplitude of individual points in the selected segment (see text for further details). Thus, the sequence of plotted amplitude values does not decline monotonically with the selection number. The sequence of values for the adjacent triads was shifted along the abscissa by 7 to correspond with the first amplitude value beyond the 6 identified sparks in the sequence for the rep-mode triad. C and D, surface plots of an average Ca2+ spark calculated by shifting and superimposing the 6 individual sparks shown in the rep-mode triad of Fig. 4A (C) or of 28 isolated sparks (D) in the same fibre. #, number.
The analysis procedure which gave rise to the data in Fig. 5A identified the two successive points having the maximum average value in the record, removed the segment containing these values and then iteratively repeated the process on the remainder of the record. The resulting sequence of ΔF/F values for the triad exhibiting rep-mode activity (Fig. 4B, record 2) is plotted in Fig. 5B (□) as a function of the number (#) of the iteration in which the value was determined in the selection sequence. The first six values in this graph give the amplitude values for the six Ca2+ sparks identified in the rep-mode train in Fig. 4. All subsequent values indicated by □ correspond to successively determined amplitude values that were not identified as being Ca2+ sparks by visual inspection. The two other sets of points (+ and ×) plotted in Fig. 5B are the sequentially determined amplitude values for the two triads (1 and 3 in Fig. 4) adjacent to the triad exhibiting the rep-mode train. These data show that after detection of the local fluorescence maxima corresponding to the visually identified sparks in the record, the remaining local maxima had amplitudes within the range of those from neighbouring triads in which there was no discernible spark activity. This fact is emphasized in Fig. 5B by shifting the data representing the inactive triads (+ and ×) along the abscissa by six units, corresponding to the number of identified sparks. It should be noted that the procedure for detection of local fluorescence maxima is entirely objective, and does not depend on selection criteria. The fact that the shifted data from the inactive triads matches the amplitude distribution of the fluorescence maxima from the active triad demonstrates that after the six identified events, there were no events of amplitude greater than the largest fluorescence maxima in the quiescent triads.
Figure 5C shows a surface plot of a Ca2+ spark constructed by averaging the six identified events within the active triad of Fig. 4A. Since there is no variation in the location of the origin of these events with respect to the confocal scan line (above), we take this average spark as our best estimate for the time course and spatial distribution of ΔF/F in events in a rep-mode train. Figure 5D presents a surface plot for twenty-one non-rep-mode events recorded in the same fibre and selected to be similar in amplitude to the events in the rep-mode train of Fig. 4A. Despite the possibly different mechanisms of activation, the rep-mode and non-repetitive sparks are very similar. The average values of the temporal full duration at half-maximum amplitude (FDHM) were 11.4 ± 0.2 and 11.2 ± 0.4 ms, the spatial full widths at half-maximal amplitude (FWHM) were 2.4 ± 0.1 and 2.3 ± 0.1 μm, and the 10-90% rise times were 6.5 ± 0.2 and 6.5 ± 0.2 ms for the rep-mode and non-rep-mode events, respectively, used to create Fig. 5C and D. Thus the individual sparks within a rep-mode train are, on average, similar in spatiotemporal extent to the non-repetitive sparks which we have characterized extensively in previous publications (Lacampagne et al. 1996, 1998; Klein et al. 1997).
Figure 6 extends the types of analysis in Fig. 5A and B to the analysis of the variation of fluorescence in all triads exhibiting rep-mode activity and in the immediately adjacent triads in a group of thirteen fibres. Figure 6A presents the histogram of amplitude values obtained from the ΔF/F records of each of the triads exhibiting rep-mode behaviour. The amplitude values corresponding to the relatively small fraction of visually identified Ca2+ sparks occur over a relatively wide range of larger amplitude values in Fig. 6A, whereas the non-spark amplitude values in these active triads are clustered near the origin in a much larger population in which no Ca2+ sparks were visually identified. Note that the broad distribution of amplitudes corresponding to identified events arises in part from differences in the origin of the rep-mode events with respect to the location of the confocal scan line in different triads exhibiting rep-mode activity. This difference is negligible amongst events within a given rep-mode train. In contrast to the two populations in the amplitude histogram for the triads exhibiting rep-mode activity, the amplitude histogram for the neighbouring triads (Fig. 6B, thick line) exhibits only the distribution located near the origin. When the selected Ca2+ sparks were removed from the histogram of the triads exhibiting rep-mode activity in Fig. 6A and the resulting histogram of the remaining non-spark amplitudes was normalized and superimposed (thin line) on that of the neighbouring triads exhibiting no rep-mode activity in Fig. 6B, the two distributions were found to be quite similar, indicating that over the entire group of rep-mode triads the population of selected maximum amplitude values not corresponding to identified Ca2+ sparks was similar to that in the neighbouring quiescent triads. Thus there does not appear to be a significant number of intermediate amplitude values not identified as sparks in the rep-mode triads compared to the adjacent triads.
Figure 6. Amplitude histograms and sequential detection of local fluorescence maxima in triads exhibiting rep-mode behaviour and in the adjacent triads.
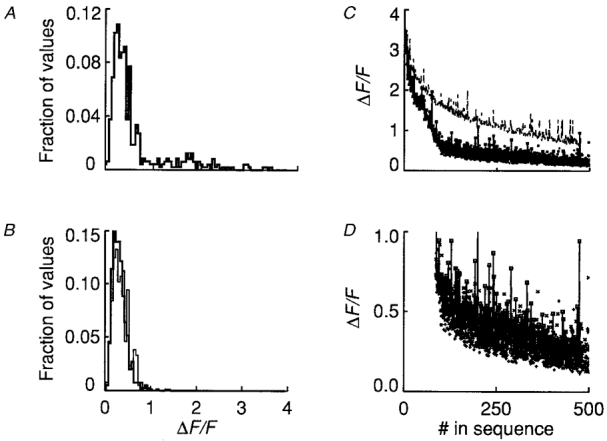
A, histograms were constructed by recording the local maximum of fluorescence of single-triad ΔF/F records as described for Fig. 5 on 16 triads (13 fibres) exhibiting rep-mode activity. The histogram was normalized to the total number of values from all triads. B, the same procedure was applied to the triads adjacent to the rep-mode triads in A (thick line). The thin line represents local fluorescence maxima exclusive of the 87 identified Ca2+ sparks of the distribution in A, normalized to its total. C, sequentially detected values of local fluorescence maxima in single-triad ΔF/F records obtained as described for Fig. 5 for the triads exhibiting rep-mode activity (squares connected by lines) and for the two adjacent quiescent triads (+ and ×). The sequence of values for the adjacent triads was shifted along the abscissa by 87, corresponding to the number of identified sparks in the sequence of rep-mode triads. The upper plot (dashed line) represents the result of a simulation of Ca2+ sparks arising from a hypothetical Ca2+ channel which exhibits a stochastic pattern of opening and closing. See text for details. D, sequential representation of all non-spark amplitude values for all triads in C are presented on an expanded ordinate scale (same symbols as in C). #, number.
Figure 6C extends the analysis of Fig. 5B to include results from sixteen runs in thirteen fibres. As in Fig. 5B, each local fluorescence maximal value is plotted (lower data set) as a function of the number (#) in the sequence of detection for all triads exhibiting rep-mode activity (□), and for the two neighbouring quiescent triads (× and +). As in Fig. 5B, the data for the neighbouring quiescent triads are shifted along the abscissa of Fig. 6C by the number of sparks (87) identified by our visual selection procedure in the rep-mode triads. The close agreement of the data representing local fluorescence maxima beyond the identified sparks in the rep-mode triads and in the adjacent, quiescent triads is shown on an expanded scale in Fig. 6D, and confirms that after accounting for local fluorescence maxima due to identified Ca2+ sparks, the rep-mode triads did not exhibit a much larger amount of amplitude fluctuation above the baseline than present in the adjacent quiescent triads. Thus two objective methods for estimating the contribution of putative smaller events not identified by our visual selection procedure both indicate that this contribution to rep-mode activity was minimal over the population of triads exhibiting rep-mode activity.
How would the data of Fig. 6C look if there were indeed smaller sparks which were generated by random brief channel openings but which were not identified by our visual selection procedures? The upper line in Fig. 6C is the result of a simulation of Ca2+ sparks arising from a hypothetical Ca2+ channel which exhibits a stochastic pattern of opening and closing. Openings of a two-state channel were simulated by generating exponentially distributed random numbers. Simulated Ca2+ sparks were generated by convolving the simulated channel record with the time course of the average spark in Fig. 5C. Thus brief channel openings gave rise to smaller amplitude Ca2+ sparks, and longer openings produced larger amplitude sparks. However, the relative number of smaller events was larger than the number of larger ones in accordance with the theoretical prediction of exponentially distributed channel open times in a discrete state kinetic scheme (Colquhoun & Hawkes, 1982). The simulated spark records were then analysed for sequential numerical selection of local maxima (above) in a manner identical to the experimentally recorded sparks. The result of the simulation (Fig. 6C) is that there is a continuum of local fluorescence maxima which, on the scale of the abscissa of Fig. 6C, never reaches the values corresponding to the quiescent triads (ca 0.5 ΔF/F). (Similar results were obtained if all simulated sparks had the same time course, but had amplitudes which were exponentially distributed.) This is in contrast to the sequential amplitude values observed in triads exhibiting rep-mode activity in Fig. 6C, where the data fall to the range of values corresponding to the quiescent triads rather quickly. Indeed, all values detected after accounting for the identified sparks in the experimental records for rep-mode triads are close to the values of quiescent triads.
Is rep-mode influenced by exposure to laser illumination?
We, and others (Hollingworth et al. 1997), have observed that prolonged exposure of fibres to laser illumination results in a localized increase in fluo-3 fluorescence, and occasionally in alterations in the frequency of Ca2+ sparks. The possibility that photodynamic damage to the fibre by laser illumination artifactually gives rise to the behaviour observed here is examined more fully in Fig. 7. Our typical experimental protocol involves the acquisition of four or five linescan images at the same location in the fibre before shifting the position of the scan line (see Lacampagne et al. 1998, for a more complete description). On our experimental apparatus, however, the duration of exposure to laser illumination required to produce such a localized increase in fluo-3 fluorescence is about two times greater than the time necessary to acquire five successive images (not shown). Nevertheless, if the behaviour designated here as rep-mode is caused by damage to the fibre, then it should occur more frequently in the later images of each run which have been subjected to the most exposure to laser illumination. Also, as the experiment proceeds, accumulating laser exposure might result in more frequent rep-mode behaviour in the images acquired later in the experiment than in earlier images. Figure 7A shows a histogram of the fractional number of times that rep-mode trains occurred within a given image of a run vs. the image number in the run of four successive images in which the rep-mode trains were observed. Results were accumulated from 17 fibres, including measurements of Ca2+ sparks from voltage-clamp repriming experiments and from spontaneous spark experiments with ‘notched’ fibres exhibiting repetitive openings during the experiment. The criterion for identifying a pattern of activity as rep-mode was as given above. Note that there is no obvious tendency for rep-mode to be observed in the later images of the sequence within the run. Figure 7B shows a histogram in which the number of observations of rep-mode is plotted against the run number within the experiment. Again, there is no significant tendency for rep-mode to occur later in the experiment, consistent with the idea that rep-mode does not result from accumulating fibre damage caused by exposure to laser illumination or run down. Finally, there was no significant correlation between the average (non-spark) indicator-related fluorescence and the frequency of occurrence of rep-mode behaviour (not shown).
Figure 7. Evaluation of the influence of laser illumination on the frequency of observations of rep-mode.
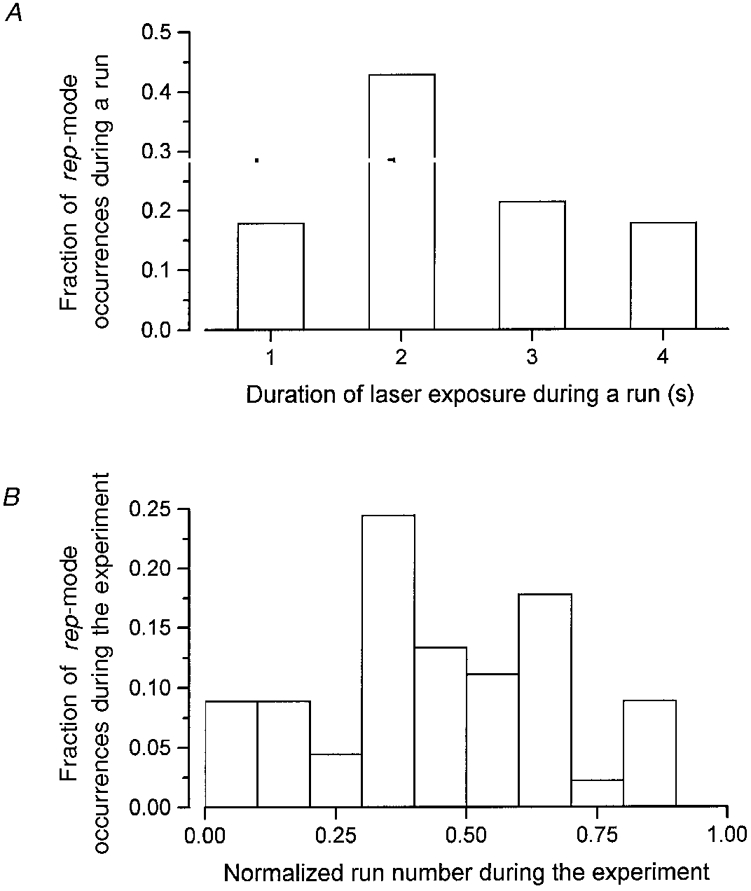
A, the relative frequency of occurrence of rep-mode is plotted as a function of the duration of exposure to laser illumination. Each run consisted of the acquisition of 4 successive images at the same scan-line location in the fibre, with each image representing 1 s of linescan recording. B, the relative frequency of occurrence of rep-mode during the course of the experiments. The run number within each experiment was normalized to the final image number. The data in A and B were taken from 17 fibres, including both voltage-clamp repriming and ‘notched’ fibre experiments.
Interspark intervals during rep-mode trains
A striking feature of a rep-mode train is the apparent regularity of the frequency of the sparks within the train. We measured the intervals between rep-mode sparks in individual triads which exhibited rep-mode behaviour. Figure 8 shows the voltage dependence of interspark intervals of rep-mode trains measured during the depolarizing test pulse in voltage-clamp repriming experiments (○), and for spontaneous, ligand-activated sparks measured in depolarized, notched fibres (▵). Each symbol represents the mean value within a run of four or five images for a given fibre. There is no significant voltage dependence of the interspark intervals during rep-mode trains activated during test depolarizations within the range of -60 to +40 mV, a range which encompasses the activation of Ca2+ release in skeletal fibres. Also, there is no difference in the measured intervals between voltage-clamped fibres stepped to a test pulse of 0 mV (○) and chronically fully depolarized, notched fibres (▵). These observations make it unlikely that repetitive sparks are due to repetitive activation of voltage sensors, as might occur if the activation scheme involved multiple states and permitted ‘flickering’ between the activated state(s) of the voltage sensors and previous, inactive ones. Rather, it seems more likely that activation of successive events in rep-mode trains resides in a property of the Ca2+ release channels themselves. This contention is further supported by the observation that the individual sparks within a rep-mode train are, on average, similar in amplitude and spatiotemporal spread to non-repetitive sparks (Fig. 5), suggesting that a common inactivation mechanism terminates the individual sparks for both rep-mode and non-repetitive events but that rep-mode release units reactivate after reversal of inactivation whereas non-repetitive units do not. The mean interspark interval was 98 ± 4 ms for all events in Fig. 8, 88 ± 5 ms for the voltage-activated events and 111 ± 5 ms for the ligand-activated events. Interestingly, these values are similar to the time constant of recovery from Ca2+ inactivation measured during large depolarizations in fully polarized fibres (100 ms in Schneider & Simon (1988) at 9°C; 50 ms in Jong et al. (1995) at 16°C), supporting the notion that successive rep-mode events occur as the inactivation produced by the preceding event is reversed with time.
Figure 8. Voltage dependence of interspark intervals.
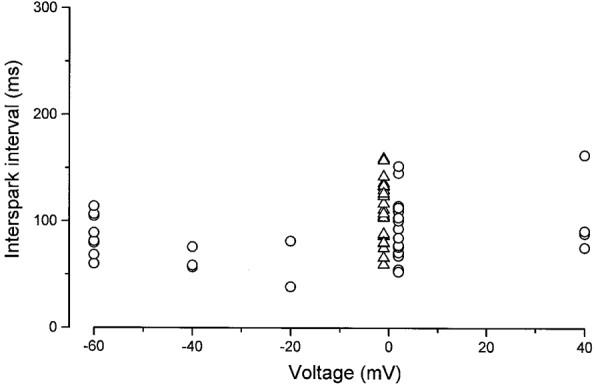
Intervals between individual events within rep-mode trains were determined during voltage-clamp depolarizations to different potentials after brief repriming (○, from 11 fibres), and in chronically depolarized, ‘notched’ fibres (▵, from 6 fibres). In the voltage-clamp experiments, the duration of the test depolarization ranged from 400-600 ms.
It should be noted that the analysis procedure for the data of Fig. 8 biases the estimation of mean interspark intervals to shorter intervals due to the sampling of sparks within images of finite acquisition time. This limitation also precluded an analysis of the distribution of interspark intervals in any single image since the number of rep-mode sparks was typically too few to establish the complete distribution. Nevertheless, the results provide information about the fastest rate processes for recovery from termination of one spark, and activation of a subsequent one in a train.
Since the interspark intervals of rep-mode trains were quite similar from experiment to experiment, and relatively voltage independent (Fig. 8), we combined the results of all voltage-clamp repriming experiments and all spontaneous, notched fibre experiments. Figure 9A shows a histogram of the distribution of interspark intervals in eleven fibres exhibiting rep-mode trains during test depolarizations after brief periods of repriming, while Fig. 9B shows the interspark intervals of rep-mode trains from six notched fibre experiments. The distributions exhibit a peak of interspark intervals between ca 40 and 70 ms, followed by a quasi-exponential decline at longer intervals. The voltage-clamp repriming results (Fig. 9A) exhibit relatively fewer intervals longer than 200 ms due to the shorter sampling time associated with the duration of the depolarizing test pulse used to activate Ca2+ sparks (400-600 ms), whereas in the notched fibre experiments (Fig. 9B), intervals were measured within the entire duration of each acquired image (1024 ms). Nevertheless, a single-exponential plus constant, fitted to the data in Fig. 9A and B starting at 75 ms, gave similar values for the time constant in two conditions, 47 and 53 ms, respectively.
Figure 9. Histograms of interspark intervals for voltage- (A) and ligand-activated (B) Ca2+ sparks within rep-mode trains.
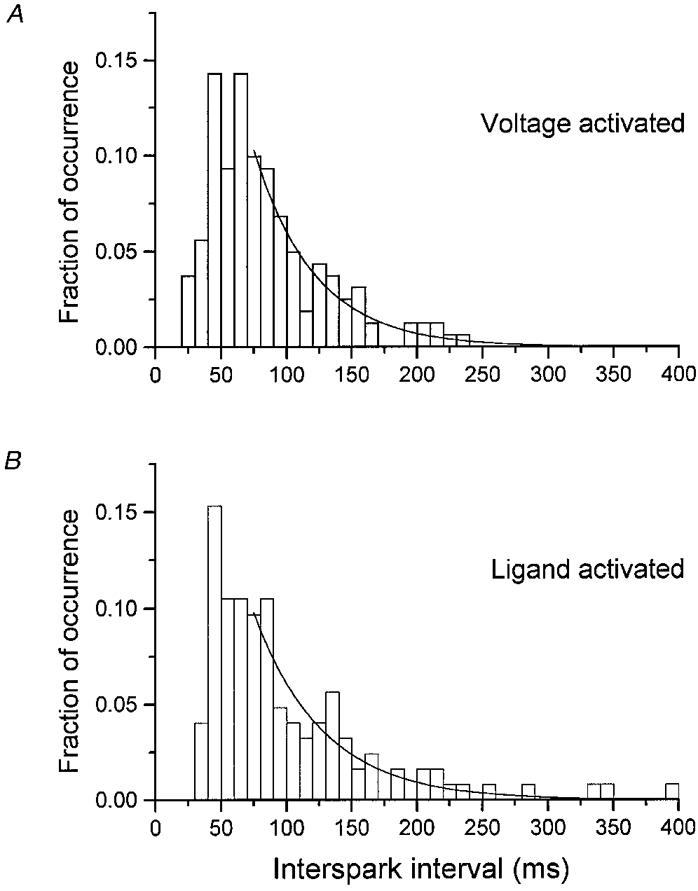
The data are grouped from 11 fibres (A) and 6 fibres (B). The lines represent fits of a single exponential function plus constant to the data, starting at 75 ms. The value of the time constant from the fit was 47 ms in A, 53 ms in B.
The presence of a peak in the interspark interval histograms of Fig. 9 suggests that there are relatively few instances where the interval between successive rep-mode Ca2+ sparks is briefer than ∼30 ms. We have estimated in our images a minimum detectable interspark interval of about 10 ms, using simulations (not shown) of two averaged sparks occurring at different temporal intervals within the same triad. The simulations employed a noise level comparable to the observed images, with spark amplitudes having a peak value of either 1.2 or 0.6 units of ΔF/F. Therefore, the paucity of measured intervals between 10 and 30 ms in Fig. 9 is probably not an artifact due to insufficient recording resolution, but instead indicates a true delay in the probability of occurrence of a spark after a preceding event. Parker & Wier (1997) described a similar finding in their study of trains of spontaneous Ca2+ sparks in cardiac myocytes, although the peak in their interspark interval distributions was closer to 200 ms. The existence of this non-zero delay in the occurrence of successive rep-mode events is an important observation since it rules out the possibility that rep-mode sparks arise from random activation of multiple, independent release units within a single triad, but instead supports the idea that successive rep-mode events arise from opening of a previously inactivated Ca2+ release channel after it becomes available to be re-activated following recovery from inactivation. The most likely interpretation is that successive rep-mode events represent the re-activation of a single Ca2+ release unit that became inactivated after previous activation (see Discussion).
Properties of individual sparks in rep-mode trains
Figure 10A and B shows the individual event amplitudes from the data of Fig. 9, for both voltage-activated and ligand-activated rep-mode trains, respectively. The abscissa value for each point represents the duration of a single interval between two successive sparks in a train, and the ordinate gives the amplitude of the later of the two sparks normalized to the mean amplitude of all rep-mode sparks within that train. Although there is considerable scatter in the data, there is no obvious correlation between the duration of the preceding interspark interval and the amplitude of the spark at the end of the interval, even when the intervals are as brief as 30 ms (Fig. 10A and B). Thus there is evidently no systematic tendency for smaller amplitude sparks to occur after the briefest interspark intervals. Consequently, the paucity of events at short intervals in Fig. 9 does not appear to be attributable to failure to detect events at short intervals due to their smaller amplitude.
Figure 10. Amplitude and rise time of Ca2+ sparks as a function of the duration of the preceding interspark interval.
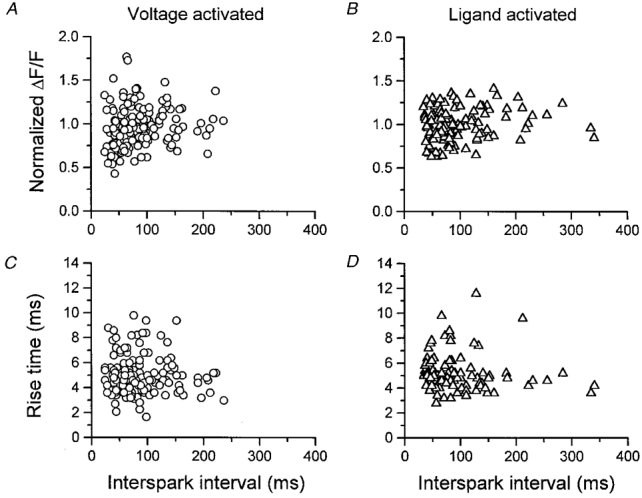
A and B show the amplitude of the 2nd spark in an interval between 2 sparks within a rep-mode train for voltage- (A) and ligand-activated (B) sparks. The amplitude is given as ΔF/F normalized to the average amplitude of all sparks in that rep-mode train. C and D, rise time of the 2nd spark in an interval between 2 sparks, for voltage- (C) and ligand-activated (D) sparks. Same fibres as in Fig. 9.
Figure 10C and D shows that the rise time of the second Ca2+ spark of each measured interspark interval is also independent of the duration of the interval, for both voltage-activated (C) and spontaneous (D) rep-mode sparks. The rise time represents an estimation of the effective open time of the channel(s) underlying each spark (Klein et al. 1997; Lacampagne et al. 1998, their Fig. 11). These observations rule out the possibility that a smaller Ca2+ channel conductance after shorter interspark intervals was compensated for by a longer mean open time, giving rise to the similarity of the observed normalized spark amplitudes at all interspark intervals (Fig. 10A and B).
Figure 11. Mean amplitude and rise time of voltage- and ligand-activated Ca2+ sparks as a function of time of occurrence during a rep-mode train.
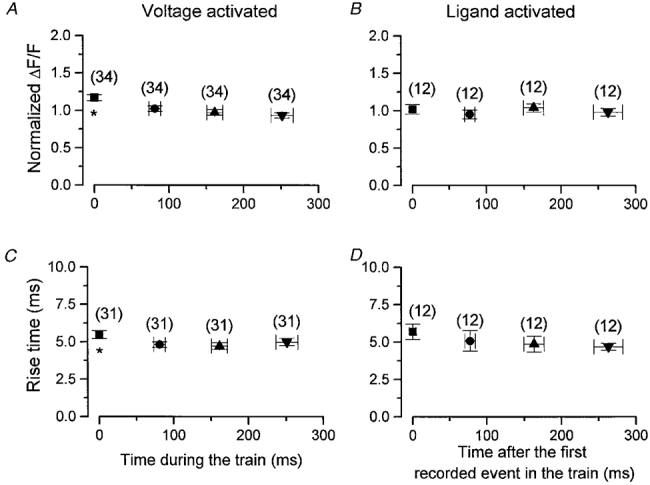
A and B, normalized amplitude of the nth spark within a train during a test depolarization plotted against the mean time of occurrence of the nth spark (n = 1, 2, 3 or 4) for voltage- (A) and ligand-activated (B) sparks. The first event within the train is taken to start at 0 ms. C and D, the rise time of the nth spark within a rep-mode train for voltage- (C) and ligand-activated (D) sparks. The points are the mean ±s.e.m. of 34 (A) or 31 (B) sparks from 17 fibres.
The properties of successive rep-mode sparks within a train are shown in Fig. 11. Figure 11A and B shows the mean normalized amplitude plotted as a function of the mean time of occurrence within the train for the first four voltage-activated and ligand-activated Ca2+ sparks, respectively, within a rep-mode train, while Fig. 11C and D shows the mean rise time vs. mean time of occurrence, respectively, in voltage- and ligand-activated trains. Both the amplitude and rise time of the voltage-activated events exhibit a small but statistically significant difference (P < 0.05) between the first spark and the three later sparks of the train, but no difference between the second to fourth sparks. In contrast, there was no statistically significant difference between the normalized amplitude and rise time between the first and second events in a ligand-activated train. These results reveal that there is a small decrease in the amplitude and rise time of events after the first spark in the voltage-activated train, but not in the ligand-activated train. However, it should be noted that we could unequivocally identify the initial spark during the depolarization as being the first spark of the subsequent train of rep-mode sparks, whereas no equivalent identification of the first spark of the train could be made for spontaneous rep-mode sparks, which might account for the difference. The interspark interval was not influenced by its position within the train.
Figure 12 examines the relationship between Ca2+ spark amplitude and rise time in rep-mode trains. The amplitude of each event in a train was normalized to the mean event amplitude in the train. The distributions for both voltage-activated (Fig. 12A) and ligand-activated events (Fig. 12B) were fitted by a linear relationship, ΔF/F =ax+b (superimposed lines), where x corresponds to the rise time and a and b were determined by linear regression. There is no correlation between normalized amplitude and event rise time for either voltage-activated (a = 0.009± 0.012, b = 0.96± 0.06) or ligand-activated events (a = -0.005 ± 0.011, b = 1.03± 0.06). A similar analysis was performed on the results of each of the individual rep-mode trains (not shown), which confirmed the absence of correlation between amplitude and rise time in individual rep-mode trains.
Figure 12. Relation between normalized amplitude and rise time of rep-mode Ca2+ sparks.
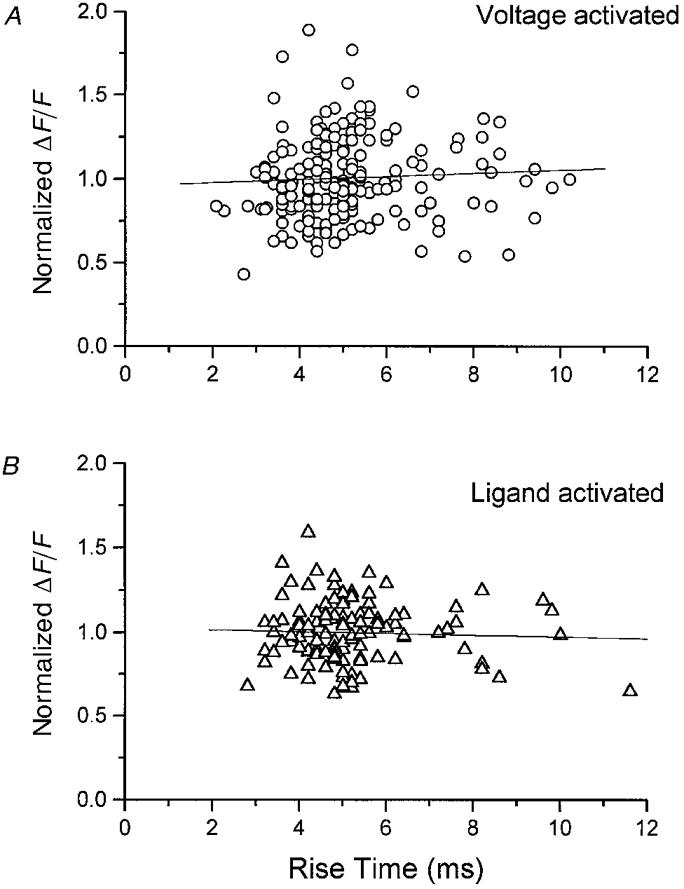
The amplitude of each event in a train was normalized to the mean event amplitude in the train. A, distribution of event amplitudes as a function of rise time for voltage-activated events. This graph includes all the rep-mode events obtained in 11 fibres at all the depolarizations using the repriming protocol (n = 195). B, distribution of event amplitudes as a function of rise time for the ligand-activated events (n = 122, 6 fibres). The lines result from a fit of a linear equation (ΔF/F =ax + b, see text for details). There was no correlation between Ca2+ spark amplitude and rise time in either of the experimental conditions.
DISCUSSION
This article describes a repetitive opening mode of SR Ca2+ release channels in skeletal muscle fibres as revealed by measurements of Ca2+ sparks. We have named this behaviour ‘rep-mode’ to distinguish it from the more common observation that Ca2+ sparks occur singly within active triads under conditions of very low overall activation. Rep-mode is represented under the conditions of our experiments as a sequence of four to ten sparks localized to a single, identified triad, occurring at a mean interspark period of ca 90 ms (Fig. 8). We have observed this pattern during test depolarizations of voltage-clamped, partially reprimed fibres (Figs 1 and 2), in chronically depolarized, notched fibres (ligand-activated sparks; Figs 3 and 4) and in fully polarized fibres during small test depolarizations (see below). This repetitive opening mode is distinguished from random openings of multiple, independent SR Ca2+ release channels (or clusters of such channels) at the same triad at the average event rate observed throughout the fibre by their occurrence under conditions in which the average Ca2+ spark frequency is very low. The voltage-clamp, repriming experiments described here in connection with Figs 1 and 2 used brief repriming intervals to activate, on average, fewer than one voltage sensor per triad (assuming each activated voltage sensor caused at least one Ca2+ spark). In the notched fibre experiments (e.g. Fig. 4), using a myoplasmic [Mg2+] in the internal solution of ca 0.65 mM resulted in a low average spark frequency by direct modulation of the release channels (Lacampagne et al. 1998). Thus the repetitive pattern of occurrence of Ca2+ sparks seems to be a property of the SR Ca2+ release channels themselves since it was observed both after activation by voltage sensors and during direct activation by myoplasmic ligands.
Parker & Wier (1997) reported a qualitatively similar finding with regard to the appearance of individual triads having much higher spark activity than the cell average, activated spontaneously in cardiac myocytes. They also observed that the mean amplitude of sparks within trains was not significantly different from those in triads exhibiting isolated sparks, and that the trains were observed relatively infrequently. However, they did not report on the existence of this phenomenon during depolarizations. Other examples of rep-mode trains have appeared in previous publications from our laboratory, although they were not commented upon specifically. For example, Figs 2 and 3 of Lacampagne et al. (1996) and Fig. 4 of Klein et al. (1997) show examples of individual triads with repetitive sparks occurring during test depolarizations after brief repriming intervals, when the overall spark rate was low. Figure 3D of Lacampagne et al. (1996) shows what appears to be a rep-mode train during a depolarization to -65 mV, in a fully polarized fibre maintained at a holding potential of -90 mV. Finally, Fig. 3 of Lacampagne et al. (1998), a plot of the number of sparks in all images of the experiment as a function of time during the experiment, shows an outlier value well above the mean, which is due to a rep-mode train which occurred in that image, as noted in their article (Lacampagne et al. 1998, p. 211).
Re-opening of the same release unit in rep-mode trains
We have attributed the occurrence of trains of sparks within a given triad to the repeated activation of a single Ca2+ release unit. This supposition arose from the observation of this phenomenon under conditions of extremely low average spark rate within the fibre, and from the assumption that the average spark rate applied to the active triad as well. Thus it is unlikely that multiple Ca2+ sparks within a single triad arise from the activation of different SR Ca2+ release units having the same probability of occurrence as observed throughout the fibre. An alternative possibility, that a given triad exhibits a spark rate much higher than the average rate, such that random, independent activation of Ca2+ release units at a locally higher rate accounts for the observed rep-mode train, can be tentatively eliminated by the following. The histogram of interspark intervals for both voltage-activated and spontaneous rep-mode sparks (Fig. 9) shows a peak between 40 and 70 ms, with relatively few values below 40 ms. If rep-mode events were due to the random activation of independent SR Ca2+ release units having a higher probability of becoming activated than the average probability over the entire fibre, we would expect the observed values of interspark intervals to be distributed exponentially (Colquhoun & Hawkes, 1982). Thus the small number of observed intervals greater than 10 ms and less than 40 ms are much fewer than expected on theoretical grounds if the successive events in a rep-mode train were generated by random activation of individual units within a population of independent release units, each having a high probability of activation. If successive events in a train arise from the re-opening of the same release unit, the paucity of brief intervals is readily explained by gating transitions, such as recovery from inactivation, occurring between successive openings of the same unit. The alternative possibility, that successive rep-mode events arise from the activation of different release units, would require that activation of the channel(s) composing one unit inhibits the activation of the channel(s) in the other units, in order to generate a paucity of brief interspark intervals (Fig. 9). Such inactivation of the other channel(s) must occur without their activation in order for the different group(s) of channel(s) to constitute different release units. The most likely candidate mediating such an inhibitory interaction would be Ca2+-dependent inactivation, but there is evidence that inactivation is strictly linked to activation (Pizarro et al. 1997).
Modal gating patterns have been described for single SR Ca2+ release channels in bilayers (Percival et al. 1994; Armisen et al. 1996; Copello et al. 1997). These observations took the form of an increase in the probability of observing channel bursting behaviour, an increase in the fraction of longer openings and a decrease in the mean channel closed times, respectively. According to the latter two reports, the repetitive activity constituted a small fraction of the total number of events: 11-12% of all openings in Ca2+ release channels from frog SR (Armisen et al. 1996), and 10% in rabbit skeletal muscle Ca2+ release channels (Copello et al. 1997). An increase in the probability of observing bursting behaviour might also account for the results described in the present article. However, in the present experiments we observed no difference in the average spatiotemporal properties of the individual Ca2+ sparks within a rep-mode train compared with non-repetitive sparks, and consequently no change in the estimated channel open times which gave rise to such sparks. It is also worth noting that the bilayer experiments were carried out in the absence of voltage sensors and employed elevated [Ca2+] to stimulate channel openings. As such, they are probably more comparable to the measurement of spontaneous sparks in notched fibres of this article than to the present voltage-activated events.
Mechanisms underlying rep-mode activity
We have suggested that the similarity of the average spatiotemporal properties of voltage-activated (Lacampagne et al. 1996) and spontaneous sparks (Lacampagne et al. 1998) could be due to a common inactivation mechanism, such as Ca2+-induced inactivation, after either mechanism of activation. Since the average spatiotemporal properties of individual sparks within a rep-mode train are similar to non-repetitive sparks, it is likely that the inactivation mechanism is similar for rep-mode events and for non-repetitive events as well. In general, the recorded amplitude of a Ca2+ spark would depend on the relative location of the spatial origin of the spark relative to the location of the scan line (Pratusevich & Balke, 1996; Jiang et al. 1998). However, if the events within a given rep-mode train are all generated by the opening of the same release unit, then differences in the spatial origin of the events cannot cause variation in the event amplitudes within the train. In this case any observed variation in event amplitude must reflect an actual variation in the amount of Ca2+ release during the event. Under these conditions we have observed that the distribution of event amplitudes within a train does not appear to exhibit the properties expected for stochastic single step closing of each release unit after it opens. The events observed within each train often exhibit a relatively uniform large amplitude, with a clear lack of smaller events which could have been detected above the relatively low noise level in the present images (cf. Figs 4-6) if they had occurred. Thus briefer openings, which would be expected to generate smaller amplitude events, appear not to have occurred during the rep-mode trains. Consequently, the closings of the channels or release units giving rise to rep-mode trains may not have followed a stochastic single step closing process. Instead, there appears to be one or more additional step(s) after opening but before closing. This would be consistent with the release unit closing by a multi-step, Ca2+-dependent inactivation mechanism as deduced from ‘macroscopic’ Ca2+ transients (Schneider & Simon, 1988; Jong et al. 1995).
A further deviation from expectations based on stochastic properties of single channels is the lack of correlation between the amplitude and rise time of individual sparks. In earlier publications we found that there was no correlation between spark amplitude and rise time for either voltage-activated (Klein et al. 1997) or ligand-activated sparks (Lacampagne et al. 1998). However, variation in amplitudes of individual non-rep-mode events in those studies could be due to differences in locations of spark origin relative to the scan line. In contrast, in the present study, the variability in the amplitude of the Ca2+ sparks measured within a given rep-mode train cannot be attributed to differences in location of the release unit since the events within a train all arise from the same release unit. Even under these conditions, neither voltage-activated nor ligand-activated events exhibited any correlation between amplitude and rise time (Fig. 12). In principle, the amplitude of a Ca2+ spark should be determined by the total amount of Ca2+ released in the event and the rise time of a spark should reflect the net duration (Lacampagne et al. 1999) of the Ca2+ release event generating the spark. Thus if the effective rate of Ca2+ efflux during release were constant from event to event, then the spark amplitude should be directly correlated with its rise time. The observed lack of correlation between spark amplitude and rise time therefore indicates that the net rate of Ca2+ release may not be constant between events in a rep-mode train. Instead, the net rate of Ca2+ release would have to be lower in the longer rise time events in order to produce a constant amplitude. Variations in effective release rates between events could be due to: (i) different numbers of channels being open throughout the rise time or differences in the frequencies of opening and closings of multiple channels exhibiting openings during the rising phase of the sparks as previously considered (Lacampagne et al. 1998; Fig. 11); (ii) variation in frequency of flickering of a single channel during the rise time, (iii) differences in conductance of one or multiple channels generating the Ca2+ release; or (iv) differences in driving force of SR Ca2+ efflux; or a combination of these possibilities.
The interval between sparks arising from the same release unit should be determined by a combination of the rates of processes underlying both recovery from inactivation and subsequent activation. Since the interspark intervals in rep-mode trains are independent of membrane voltage (Fig. 8), it seems reasonable that the interspark interval is determined primarily by the time for recovery from a voltage-independent inactivation process, and not by a voltage-dependent activation process per se. The interspark intervals are also similar for voltage-activated and spontaneous rep-mode trains. Thus it is likely that similar kinetic states and transitions are involved in generating both the rep-mode trains observed during depolarization and those occurring spontaneously.
A possible molecular basis for the appearance of rep-mode behaviour in a release unit could be the direct biochemical modification of some or all of its RyR Ca2+ release channels, such as might result from phosphorylation/dephosphorylation events or association/dissociation of RyR binding proteins such as FKBP12 (see for review, Melzer et al. 1995) or even a possible indirect modulation of RyR properties resulting from changes in calcium loading of individual triadic SR elements (Satoh et al. 1997). These, or some other biochemical modulation of the RyRs, could in turn favour a transient, increased likelihood of channel re-opening after inactivation. Thus the frequency of sparks within a rep-mode train might then be limited by the rate of recovery from inactivation, but once recovered, another spark would occur with higher probability than in unmodified units exhibiting single events. Such a biochemical modification might persist for several seconds (Fig. 3), and could act on release channels of different triads in a random fashion, thus accounting for the occurrence of rep-mode among different triads during successive repriming runs (Fig. 2). The absence of such a biochemical modification would presumably prevent the occurrence of repetitive sparks in the unmodified channels. It is worth noting that the putative modified RyR Ca2+ release channels do not become completely independent of the conformation of voltage sensors, since repolarization clearly terminates a rep-mode train activated during depolarization after repriming (Fig. 2). Thus, voltage sensor activation appears to play both an active role in initiating the first event in a rep-mode train, as well as a permissive role in allowing subsequent rep-mode events to occur as long as the voltage sensors remain activated and the putative biochemical modification of the RyRs persists. This would be in contrast to the effect of voltage sensor activation on release units lacking the putative biochemical modification, in which there would be a very low probability of recurrence of a voltage-activated event despite continuous activation of the voltage sensor.
The mechanism underlying reactivation of a release unit during a train of spontaneous rep-mode events is also uncertain. If the initial event in the ‘spontaneous’rep-mode train is activation by ligand (e.g. Ca2+) binding, then the putative biochemical modification would appear to ‘lock’ the modified release unit in a ligand-activated state after its initial activation so that repetitive events in a train would continue to occur as soon as the release unit recovered from the inactivation resulting from the preceding event. Termination of a spontaneous rep-mode train could then correspond either to reversal of the putative biochemical modification or to reversal of ligand activation.
Contribution of rep-mode activity to Ca2+ release
Finally, what is the contribution of rep-mode trains to the total Ca2+ release for large, maintained depolarizations in a fully polarized fibre? Since the mean interspark interval in a rep-mode train is ∼100 ms, it is expected that subsequent openings in the train would occur during the steady level of release, after the early peak, which has a half-width of 5-20 ms (Klein et al. 1990; Simon et al. 1991). We have indicated that rep-mode occurs relatively rarely under the conditions of extremely low availability of voltage sensors. While these conditions are well suited for measuring individual Ca2+ sparks and identifying rep-mode train, they may not be optimal for the occurrence of rep-mode activity. For example, rep-mode might result directly or indirectly from the elevation of myoplasmic Ca2+ associated with the release, such as might come about from a Ca2+-activated kinase, phosphatase or other Ca2+-modulated system. Therefore it is conceivable that rep-mode could occur more frequently during a large Ca2+ release than under the very low level of activation used here, and might thus contribute more substantially to the maintained component of Ca2+ release. This idea would be consistent with the observation that the ratio of the peak to the steady spark rate (Klein et al. 1997) may be about 2-fold larger than the ratio of the peak to steady rate of Ca2+ release corrected for calcium depletion (Klein et al. 1990; Simon et al. 1991) calculated from whole-fibre measurements of Ca2+ transients.
Acknowledgments
We thank Naima Carter and Mark Chang for technical assistance and Gabe Sinclair and Walt Knapic for customization of optical and mechanical apparatus. This work was supported by research grants from the NIH (R01-NS23346 to M. F. S. and R01-AR44197 to M. G. K.), and by funds from the University of Maryland School of Medicine and the University of Maryland Graduate School, Baltimore. A. L. was partially supported by le Conseil Regional du Centre, France, and by the Melzer Foundation.
References
- Armisen R, Sierralta J, Velez P, Naranjo D, Suarez-Isla BA. Modal gating in neuronal and skeletal muscle. American Journal of Physiology. 1996;271:C144–153. doi: 10.1152/ajpcell.1996.271.1.C144. [DOI] [PubMed] [Google Scholar]
- Blatter LA, Tsugorka A, Shirokova N, Rios E. Eager triads in skeletal muscle: Heterogeneous distribution of voltage-elicited Ca2+ release revealed by confocal microscopy. Biophysical Journal. 1996;70:A235. Abstract. [Google Scholar]
- Colquhoun D, Hawkes AG. On the stochastic properties of bursts of single ion channel openings and of clusters of bursts. Philosophical Transactions of the Royal Society B. 1982;300:1–59. doi: 10.1098/rstb.1982.0156. [DOI] [PubMed] [Google Scholar]
- Copello JA, Barg S, Onoue H, Fleischer S. Heterogeneity of Ca2+ gating of skeletal muscle and cardiac ryanodine receptors. Biophysical Journal. 1997;73:141–156. doi: 10.1016/S0006-3495(97)78055-X. [DOI] [PMC free article] [PubMed] [Google Scholar]
- van Castillo J, Katz B. Quantal components of the end-plate potential. The Journal of Physiology. 1954;124:560–573. doi: 10.1113/jphysiol.1954.sp005129. [DOI] [PMC free article] [PubMed] [Google Scholar]
- Hell SW, Reiner G, Cremer C, Stelzer EHK. Aberrations in confocal fluorescence microscopy induced by mismatches in refractive index. Journal of Microscopy. 1993;169:391–405. [Google Scholar]
- Hollingworth S, Baylor SM, Peachey LD, Zhao M. Triadic calcium release signals in intact frog skeletal muscle fibres studied with confocal microscopy. Biophysical Journal. 1997;72:A46. Abstract. [Google Scholar]
- Jiang YH, Klein MG, Schneider MF. Numerical simulation of Ca2+‘sparks’ in skeletal muscle. Biophysical Journal. 1998;74:A269. doi: 10.1016/s0006-3495(99)77072-4. Abstract. [DOI] [PMC free article] [PubMed] [Google Scholar]
- Jong D-S, Pape PC, Baylor SM, Chandler WK. Calcium inactivation of calcium release in frog cut muscle fibres that contain millimolar EGTA or Fura-2. Journal of General Physiology. 1995;106:337–388. doi: 10.1085/jgp.106.2.337. 10.1085/jgp.106.2.337. [DOI] [PMC free article] [PubMed] [Google Scholar]
- Katz B. Nerve, Muscle and Synapse. NY, USA: McGraw-Hill; 1966. chap. 9. [Google Scholar]
- Klein MG, Cheng H, Santana LF, Jiang Y-H, Lederer WJ, Schneider MF. Two mechanisms of quantized calcium release in skeletal muscle. Nature. 1996;379:455–458. doi: 10.1038/379455a0. 10.1038/379455a0. [DOI] [PubMed] [Google Scholar]
- Klein MG, Lacampagne A, Schneider MF. Voltage dependence of the pattern and frequency of discrete Ca2+ release events after brief repriming in frog skeletal muscle. Proceedings of the National Academy of Sciences of the USA. 1997;94:11061–11066. doi: 10.1073/pnas.94.20.11061. 10.1073/pnas.94.20.11061. [DOI] [PMC free article] [PubMed] [Google Scholar]
- Klein MG, Simon BJ, Schneider MF. Effects of caffeine on calcium release from the sarcoplasmic reticulum in frog skeletal muscle fibres. The Journal of Physiology. 1990;425:599–626. doi: 10.1113/jphysiol.1990.sp018120. [DOI] [PMC free article] [PubMed] [Google Scholar]
- Lacampagne A, Klein MG, Schneider MF. Modulation of the frequency of calcium release events (Ca2+ sparks) by myoplasmic [Mg2+] in frog skeletal muscle. Journal of General Physiology. 1998;111:207–224. doi: 10.1085/jgp.111.2.207. 10.1085/jgp.111.2.207. [DOI] [PMC free article] [PubMed] [Google Scholar]
- Lacampagne A, Lederer WJ, Schneider MF, Klein MG. Repriming and activation alter the frequency of stereotyped discrete Ca2+ release events in frog skeletal muscle. The Journal of Physiology. 1996;497:581–588. doi: 10.1113/jphysiol.1996.sp021791. [DOI] [PMC free article] [PubMed] [Google Scholar]
- Lacampagne A, Ward CW, Klein MG, Schneider MF. Time course of individual voltage-activated Ca2+ sparks in frog skeletal muscle recorded at high time resolution. Journal of General Physiology. 1999;113:187–198. doi: 10.1085/jgp.113.2.187. 10.1085/jgp.113.2.187. [DOI] [PMC free article] [PubMed] [Google Scholar]
- Melzer W, Herrmann-Frank A, Lüttgau HC. The role of calcium ions in excitation-contraction coupling of skeletal muscle fibres. Biochimica et Biophysica Acta. 1995;1241:59–116. doi: 10.1016/0304-4157(94)00014-5. [DOI] [PubMed] [Google Scholar]
- Parker I, Wier WG. Variability in frequency and characteristics of Ca2+ sparks at different release sites in rat ventricular myocytes. The Journal of Physiology. 1997;505:337–344. doi: 10.1111/j.1469-7793.1997.337bb.x. [DOI] [PMC free article] [PubMed] [Google Scholar]
- Percival AL, William AJ, Kenyon JL, Grinsell MM, Airey JA, Sutko JL. Chicken skeletal muscle ryanodine receptor isoforms: ion channel properties. Biophysical Journal. 1994;67:1834–1850. doi: 10.1016/S0006-3495(94)80665-4. [DOI] [PMC free article] [PubMed] [Google Scholar]
- Pizarro G, Shirokova N, Tsugorka A, Rios E. Quantal calcium release operated by membrane voltage in frog skeletal muscle. The Journal of Physiology. 1997;501:289–303. doi: 10.1111/j.1469-7793.1997.289bn.x. [DOI] [PMC free article] [PubMed] [Google Scholar]
- Pratusevich VR, Balke CW. Factors shaping the confocal image of the calcium spark in cardiac muscle cells. Biophysical Journal. 1996;71:2942–2957. doi: 10.1016/S0006-3495(96)79525-5. [DOI] [PMC free article] [PubMed] [Google Scholar]
- Satoh H, Blatter LA, Bers DM. Effects of [Ca2+]i, SR Ca2+ load, and rest on Ca2+ spark frequency in ventricular myocytes. American Journal of Physiology. 1997;272:H657–668. doi: 10.1152/ajpheart.1997.272.2.H657. [DOI] [PubMed] [Google Scholar]
- Schneider MF, Klein MG. Sarcomeric calcium sparks activated by fibre depolarization and by cytosolic Ca2+ in skeletal muscle. Cell Calcium. 1996;20:123–128. doi: 10.1016/s0143-4160(96)90101-3. 10.1016/S0143-4160(96)90101-3. [DOI] [PubMed] [Google Scholar]
- Schneider MF, Simon BJ. Inactivation of calcium release from the sarcoplasmic reticulum in frog skeletal muscle. The Journal of Physiology. 1988;405:727–745. doi: 10.1113/jphysiol.1988.sp017358. [DOI] [PMC free article] [PubMed] [Google Scholar]
- Shirokova N, Rios E. Small event Ca2+ release, a probable precursor of Ca2+ sparks in frog skeletal muscle. The Journal of Physiology. 1997;502:3–11. doi: 10.1111/j.1469-7793.1997.003bl.x. [DOI] [PMC free article] [PubMed] [Google Scholar]
- Simon BJ, Klein MG, Schneider MF. Calcium dependence of inactivation of calcium release from the sarcoplasmic reticulum in skeletal muscle. Journal of General Physiology. 1991;97:437–471. doi: 10.1085/jgp.97.3.437. 10.1085/jgp.97.3.437. [DOI] [PMC free article] [PubMed] [Google Scholar]
- Tsugorka A, Rios E, Blatter LA. Imaging elementary events of calcium release in skeletal muscle cells. Science. 1995;269:1723–1726. doi: 10.1126/science.7569901. [DOI] [PubMed] [Google Scholar]