

Abstract
This study examined whether reduced [ATP], raised [Mg2+] and the presence of the metabolites AMP and inosine monophosphate (IMP) affected depolarization-induced Ca2+ release from the sarcoplasmic reticulum (SR) in mechanically skinned skeletal muscle fibres of the rat. The amount of Ca2+ released was determined from the extent of SR Ca2+ depletion following a depolarization in the specified conditions with 2 mm free EGTA present to chelate released Ca2+.
In the presence of 8 mm total ATP and 1 mm free Mg2+, most of the SR Ca2+ could be released by a single (2–3 s) depolarization. Paired comparisons in the same fibres showed that raising the [Mg2+] from 1 to 3 mm reduced the total amount of Ca2+ released by a single depolarization by ∼40%. At 1 mm Mg2+, lowering the [ATP] to 0.5 mm did not cause a detectable change in the total amount of Ca2+ released, but when the release rate was reduced by the presence of 3 mm Mg2+, lowering the [ATP] to 0.5 mm resulted in a further (∼20%) reduction in the total amount of Ca2+ released.
At 1 mm Mg2+ and 0.5 mm ATP, neither the presence of 3 mm AMP alone nor 3 mm AMP plus 3 mm IMP caused a significant change in total Ca2+ release. Furthermore, at 1 mm Mg2+, the combined effect of lowering the [ATP] from 8 to 0.5 mm and simultaneously adding 3 mm AMP and 3 mm IMP did not significantly alter total Ca2+ release. However, when Ca2+ release was already reduced by the presence of 3 mm Mg2+ and 0.5 mm ATP (to ∼50%), addition of 3 mm AMP and 3 mm IMP significantly reduced the amount of Ca2+ released a further 2-fold.
These results show that depolarization-induced Ca2+ release in mammalian muscle fibres is modulated by the concentration of ATP and its metabolic products, as well as by the free [Mg2+]. Consequently, the (reversible) reduction in Ca2+ release occurring in a muscle fibre after prolonged exercise could result not only from raised [Mg2+] but also from a severe reduction in [ATP] locally near the Ca2+ release channels, with the accompanying build-up of AMP and IMP further exacerbating this effect.
In skeletal muscle, action potentials activate voltage sensors in the transverse tubular (T-) system, which open the Ca2+ release channels in the adjacent sarcoplasmic reticulum (SR), leading to a rise in cytoplasmic [Ca2+] and force development by the contractile apparatus (Melzer et al. 1995). Experiments with SR vesicles and single Ca2+ release channels indicate that channel activity is modulated by cytoplasmic Ca2+, Mg2+, ATP, pH and other factors (Meissner, 1984; Meissner et al. 1986,1997; Laver et al. 1997). However, voltage sensor activation of the Ca2+ release channels is not always affected by cytoplasmic factors in the same way as is direct activation of isolated release channels. For example, depolarization-induced Ca2+ release in mechanically skinned fibres, which utilizes the normal voltage sensor control mechanism (Lamb & Stephenson, 1990), is largely unaffected by a reduction in cytoplasmic pH to μ6.0 (Lamb et al. 1992; Lamb & Stephenson, 1994), whereas activation of Ca2+ release in SR vesicles by Ca2+ and ATP analogues is very strongly inhibited at such pH levels (Meissner, 1984). Here, we investigate whether depolarization-induced Ca2+ release in mammalian fibres is modulated by cytoplasmic [ATP] and whether this could contribute to the development of muscle fatigue.
After prolonged stimulation of a muscle fibre, force production declines due both to effects on the contractile apparatus and to a reduction in Ca2+ release from the SR (Allen et al. 1995). The force response normally fully recovers within 30 min, except if the stimulation regime is extreme, when it can induce muscle fatigue lasting over many hours to days (often called ‘low-frequency fatigue’) possibly because of irreversible Ca2+-induced changes in protein interactions or triad structure (Lamb et al. 1995; Chin et al. 1997). The reversible reduction in Ca2+ release seen with less extreme stimulation appears likely to be due to reversible metabolic changes within the muscle fibre, though the exact causes are not clear (Fitts, 1994; Allen et al. 1995). With prolonged activity, the large supply of phosphocreatine becomes exhausted and the average concentration of ATP in the cytoplasm can fall to μ50-25 % of the resting level of μ7 mm, with the ATP being converted first to ADP, then to AMP and ultimately mostly to IMP, with the [IMP] reaching as much as 3–5 mm (Hood & Parent, 1991; Nagesser et al. 1992, 1993; Fitts, 1994; Allen et al. 1995). The free [Mg2+] in the cytoplasm also rises, because most of the ATP in a resting fibre has Mg2+ bound to it and the breakdown products have a far lower affinity for Mg2+. Mag-fura-2 measurements indicate a 2-fold increase in free [Mg2+] (from μ0.8 to μ1.6 mm) in mouse fibres fatigued to μ50 % of resting force (Westerblad & Allen, 1992). This rise in [Mg2+] seems likely to be a factor in reducing Ca2+ release, because a rise from μ1 to 10 mm has been shown to cause almost complete block of depolarization-induced Ca2+ release in both amphibian and mammalian skinned muscle fibres (Lamb & Stephenson, 1991,1994). Furthermore, Westerblad & Allen (1992) found that raising the [Mg2+] to μ2.9 mm in rested, intact mammalian fibres (by injection of MgCl2) depressed tetanic force by 50 %. However, because fatigued fibres showed this level of force depression at a lower [Mg2+], Westerblad & Allen (1992) concluded that the rise in [Mg2+] could not alone account for the depression of tetanic force in fatigued fibres, and they suggested that the additional depression of force might be due to the reduction in [ATP] that occurs in tandem with the rise in [Mg2+]. Following this, Allen et al. (1997a) showed that photolytic liberation of caged ATP indeed partially restored Ca2+ release and force production in fatigued murine fibres. However, they also subsequently found that liberation of caged ADP and caged phosphate had a similar effect (Allen et al. 1997b), leaving it unclear as to whether or not Ca2+ release in fatigued fibres is restored by raising the [ATP].
Thus, there is currently no evidence about whether cytoplasmic [ATP] affects depolarization-induced Ca2+ release in mammalian fibres, and further, whether low [ATP] could contribute to the fatigue process. In toad skeletal muscle fibres, lowering the [ATP] to 0.5 mm reduces depolarization-induced Ca2+ release substantially (Owen et al. 1996; and see comparable reduction in caffeine-induced Ca2+ release in frog fibres in Duke & Steele, 1998). Nevertheless, it cannot be presumed that mammalian muscle is affected similarly, because amphibian fibres have two types of Ca2+ release channels (α and β) rather than one as in mammalian muscle (Ogawa, 1994), and Ca2+-induced Ca2+ release is reportedly of major importance in amphibian fibres but not in mammalian fibres (Shirokova et al. 1998). Here, we used an assay of SR Ca2+ depeletion to show that (a) depolarization-induced Ca2+ release in mammalian skinned fibres is indeed inhibited at low [ATP], at least when in combination with raised [Mg2+], and (b) this inhibition is exacerbated by the presence of the metabolites AMP and IMP. These results indicate that local depletion of ATP could well contribute, together with raised [Mg2+], to the reduction in Ca2+ release occurring in muscle fatigue.
METHODS
Skinned fibre preparation
Segments of extensor digitorum longus (EDL) muscle fibres from rat were mechanically skinned as described previously (Lamb & Stephenson, 1994). Briefly, Long-Evans hooded rats (Rattus norvegicus) aged 14-20 weeks were anaesthetized by halothane inhalation (2 % v/v) and killed by asphyxiation in accordance with the guidelines of the La Trobe University Animal Ethics Committee. Both EDL muscles were removed and placed in paraffin oil, and kept cool on ice. A segment of a single muscle fibre was dissected free and skinned with microforceps. The skinned fibre segment (diameter, 35-50 μm) was mounted on a force transducer (AME875, SensoNor, Horten, Norway), and stretched to 120 % of its resting length. The fibre was then placed into a 2 ml Perspex bath containing a potassium 1,6-diaminohexane-N,N,N′,N′-tetraacetic acid (K-HDTA) solution (see below) and allowed to equilibrate for 2 min before being stimulated by rapidly lowering the bath and replacing it with a bath containing a different solution. All experiments were performed at room temperature (23 ± 2°C).
Solutions
All chemicals were obtained from Sigma unless stated otherwise. The standard K-HDTA solution consisted of (mm): K+, 126; Na+, 37; HDTA2- (Fluka, Buchs, Switzerland), 50; total ATP, 8.0; phosphocreatine, 10.0; total Mg2+, 8.55; Hepes, 90; NaN3, 1.0; and total EGTA, 0.025; with pCa (i.e. -log10[Ca2+]) 7.0 and pH 7.10 ± 0.01. This solution had a free [Mg2+] of 1 mm and an osmolality of 295 ± 5 mosmol kg−1. The T-system of a skinned fibre could be depolarized by replacing the K-HDTA solution with a Na-HDTA solution in which all K+ was replaced with equimolar Na+ but which was otherwise identical. Corresponding K+ and Na+ solutions were also made with 3 mm Mg2+ and 8 mm ATP, and with 0.5 mm total ATP and 1 or 3 mm free Mg2+. The 0.5 mm ATP solutions were similar to those with 8 mm ATP, but with the phosphocreatine concentration increased from 10 to 17.5 mm (i.e. with the total concentration of ATP and phosphocreatine maintained at 18 mm), with the total concentrations of Na+ and K+ unchanged. The total [Mg2+] for each solution (added as MgO) was calculated using apparent Mg2+ affinity constants: 6.9 × 10³ M−1 for ATP, 8 M−1 for HDTA and 15 M−1 for phosphocreatine (Stephenson & Williams, 1981; Fink et al. 1986); these amounts were 12.2, 2.1 and 5.4 mm for the 8 mm ATP-3 mm Mg2+, 0.5 mm ATP-1 mm Mg2+ and 0.5 mm ATP-3 mm Mg2+ solutions, respectively. Solutions with AMP and IMP had 0.5 mm total ATP, with the phosphocreatine reduced isosmotically with addition of AMP and IMP (i.e. 14.5 or 11.5 mm phosphocreatine) and the total [Na+] and [K+] unchanged. The total [Mg2+] was accordingly increased to keep the free [Mg2+] at 1 or 3 mm, based on an apparent Mg2+ affinity constant of 85 M−1 for AMP (Martel & Smith, 1974) and the same value assumed for IMP, the total added being 2.27, 2.47 and 6.36 mm for the 1 mm Mg2+-3 mm AMP, 1 mm Mg2+-3 mm AMP-3 mm IMP, and 3 mm Mg2+-3 mm AMP-3 mm IMP solutions, respectively. The above solutions had 0.025 mm total EGTA and pCa 6.9–7.0 or, where specified, 2 mm total EGTA and pCa > 8.5. Free [Ca2+] was measured with a Ca2+-sensitive electrode (Orion, Cambridge, MA, USA) for solutions with pCa < 7.3. Maximum Ca2+-activated force was determined by exposing a fibre to a solution similar to the standard K-HDTA (8 mm ATP) solution but with all HDTA (50 mm) replaced with Ca-EGTA (pCa 4.5), and 8.15 mm total Mg2+ to maintain the free [Mg2+] at 1 mm (Stephenson & Williams, 1981). The 30 mm caffeine-low [Mg2+] solution used to deplete the SR of Ca2+ (see below) was similar to the standard Na-HDTA (8 mm ATP) solution, but with 2.15 mm total Mg2+ to give a free [Mg2+] of 0.05 mm.
Depolarization-induced responses and assay of amount of Ca2+ released
Following the 2 min equilibration period in the standard K-HDTA solution after skinning, a fibre was repeatedly depolarized by Na+ substitution at 45 s intervals, with the response typically growing over the first two or three depolarizations and reaching a stable level with subsequent depolarizations. When investigating the effect of a particular condition on the depolarization-induced force response (e.g. Fig. 1), all solutions were weakly Ca2+ buffered (0.025 mm total EGTA) at pCa μ7.0 and the fibre was always equilibrated for 45 s under the new conditions (e.g. 3 mm Mg2+) before the first depolarization. When assaying the amount of Ca2+ released under a particular test condition (e.g. Fig. 2), a fibre was first equilibrated for 30 s under those conditions (e.g. 0.5 mm ATP, 3 mm Mg2+) with the [Ca2+] weakly buffered at pCa μ7.0 with 0.025 mm EGTA, then moved to a similar solution with 2 mm EGTA (pCa > 8.5) for 15 s (no depolarization - ‘Ca2+ leak’ measure) or to the same solution for 13 s followed by a 2 s depolarization in the corresponding Na+ solution with 2 mm EGTA (‘depolarization’ measure). The fibre was then equilibrated back in the standard K-HDTA solution (8 mm ATP, 1 mm Mg2+, pCa 7.0, 0.025 mm EGTA) for 45 s (washing successively in two identical solutions) before being depolarized with the matching, standard Na-HDTA solution in order to ascertain the amount of Ca2+ still remaining in the SR. The fibre was then reloaded with Ca2+ and depolarized again until the response recovered to within 10 % of the original control response, and the entire procedure was repeated with/without a depolarization for a second set of test conditions (e.g. 8 mm ATP, 3 mm Mg2+).
Figure 1. Effect of raised [Mg2+] and low [ATP] on depolarization-induced force responses in rat skinned skeletal muscle fibres.
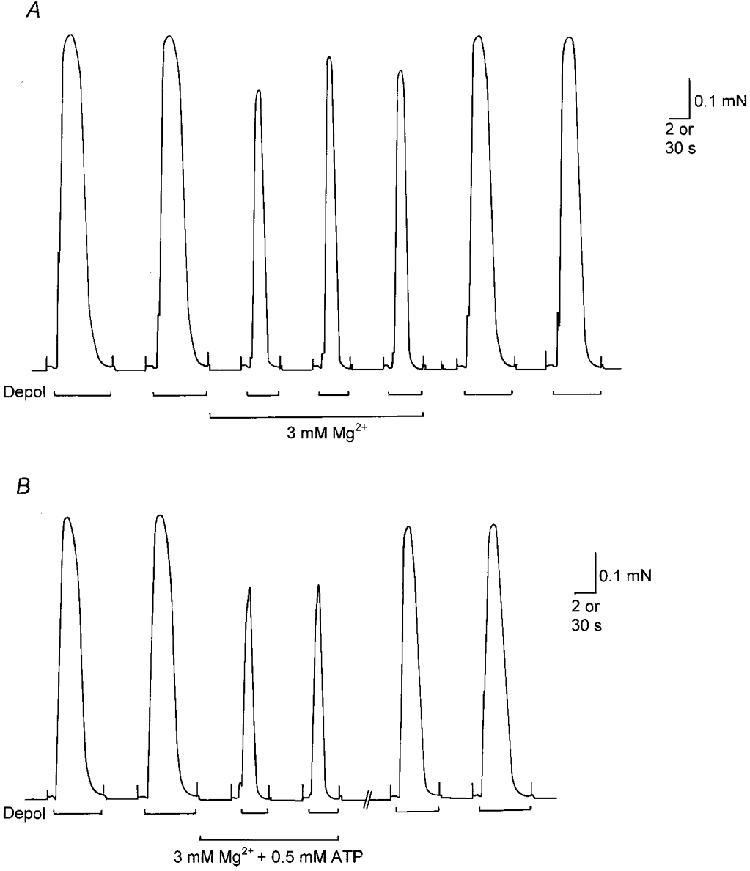
A, in the presence of 1 mm free Mg2+ and 8 mm total ATP, depolarizing the T-system of an EDL fibre by Na+ substitution (Depol) elicited rapid Ca2+ release and a large force response. Raising the [Mg2+] to 3 mm reduced the size and duration of the depolarization-induced force response. B, effect of 3 mm Mg2+ and 0.5 mm ATP in another EDL fibre. In both A and B for all solutions, pCa 6.9–7.0, 0.025 mm total EGTA. Time scale, 2 s during depolarizations and 30 s between.
Figure 2. Assay of the amount of Ca2+ released by depolarization at 8 and 0.5 mm ATP in the presence of 3 mm Mg2+.
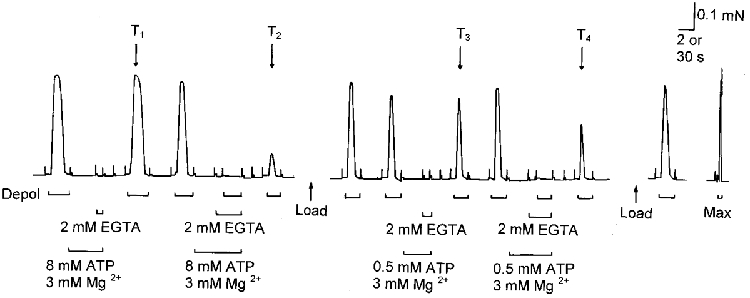
The skinned EDL fibre was depolarized under standard conditions (see below) both before and after each of four different treatments (exposure to 3 mm Mg2+-2 mm EGTA, with 8 or 0.5 mm ATP, and with or without depolarization), and the effect of each treatment was gauged by the change in the size of the following test response under standard conditions (marked T1 to T4). Firstly, the response to depolarization was ascertained before and after exposing the fibre to a solution containing 8 mm ATP, 3 mm Mg2+ and 2 mm EGTA (pCa > 8) for 15 s without any depolarization (‘leakage’ in 8 mm ATP-3 mm Mg2+), and there was little change in the response (T1). Secondly, the fibre was exposed to the same solution and depolarized during the last 2 s (depolarization in 8 mm ATP-3 mm Mg2+), resulting in a substantial reduction in the subsequent test response (T2). Thirdly, the SR was reloaded with Ca2+ until the response was similar to the preceding control level and then the fibre was exposed to a solution with 0.5 mm ATP, 3 mm Mg2+ and 2 mm EGTA (pCa > 8) without any depolarization (‘leakage’ in 0.5 mm ATP-3 mm Mg2+), causing little change in the subsequent test response (T3). Finally, the fibre was exposed to the same 0.5 mm ATP solution and depolarized (depolarization in 0.5 mm ATP-3 mm Mg2+), resulting in a moderate reduction in the subsequent response (T4). In each case, the fibre was pre-equilibrated at the given [ATP] and [Mg2+] (at pCa ≈7.0) for 30 s before exposure to the corresponding 2 mm EGTA solution. Maximum Ca2+-activated force was determined by exposure to a solution with 50 mm Ca-EGTA (pCa 4.5) (Max). Time scale, 2 s during depolarizations and 30 s elsewhere. Standard conditions were used (1 mm Mg2+, 8 mm ATP, 0.025 mm EGTA, pCa ≈7.0) except where indicated.
The fraction of the SR Ca2+ released with and without depolarization could be estimated from the relationships between SR Ca2+ content and (a) the peak size and (b) the area (i.e. time integral) of the force response relative to the preceding control response in the same fibre; these relationships were determined previously for skinned EDL fibres of the rat using a fibre-lysing technique and depolarizing under virtually identical conditions to those used here (Owen et al. 1997). As shown in Fig. 7 of that study, because of the relative steepness of the relationships, small decreases in Ca2+ content were indicated more accurately by the reduction in the peak of the response rather than by the reduction in the area of the response, with the actual percentage loss of total releasable Ca2+ being μ2.0 times the decrease in peak force for forces between 90 and 100 % of the control level. On the other hand, when most of the releasable Ca2+ had been lost from the SR, the extent of the loss was more accurately quantified from the area rather than the peak of the force response, with the percentage of releasable Ca2+ remaining in the SR being μ1.7 times the relative area of the response for relative areas from 0 to μ25 %. For intermediate sized responses, the percentage loss of releasable Ca2+ was determined from both the relative peak and the area of the force response using the best-fit relationships given in Fig.7 of Owen et al. (1997).
Caffeine-induced Ca2+ release experiments
The solutions used for the caffeine-induced Ca2+ release experiments were all made with Na-HDTA solutions to ensure that the T-system was kept depolarized at all times and hence the voltage sensors inactivated. The Ca2+ content of the SR was assayed (e.g. Fig. 4) by first pre-equilibrating the skinned fibre in the Na-HDTA solution with 0.5 mm EGTA (pCa 8) for 10 s, and then triggering rapid Ca2+ release in the 30 mm caffeine-low [Mg2+] solution with 0.5 mm EGTA (pCa 8) (see Bakker et al. 1996). It was necessary to have 0.5 mm EGTA present in the 30 mm caffeine solution to rapidly chelate the released Ca2+, in order that the resulting force response could be related to the amount of Ca2+ released. The area of the force response upon first depleting the SR was indicative of the level of SR Ca2+ present endogenously. The fibre was left in the caffeine solution for 2 min to ensure complete Ca2+ depletion (Fryer & Stephenson, 1996), washed for 20 s in another Na-HDTA solution with 0.5 mm EGTA (pCa 8) and then reloaded for set times (e.g. 30 or 40 s) in a similar solution with 1 mm total EGTA at pCa 6.7. The fibre was then either immediately depleted again with the above procedure (pre-equilibration and 30 mm caffeine-low [Mg2+]) or was first equilibrated in a solution with a particular [ATP] and [Mg2+] (pCa 7.0, 0.025 mm EGTA) for 20 s, exposed to the same solution with 7 or 15 mm caffeine for 15 s, and then totally depleted of Ca2+.
Figure 4. Caffeine-induced Ca2+ release is suppressed by high [Mg2+] and low [ATP].
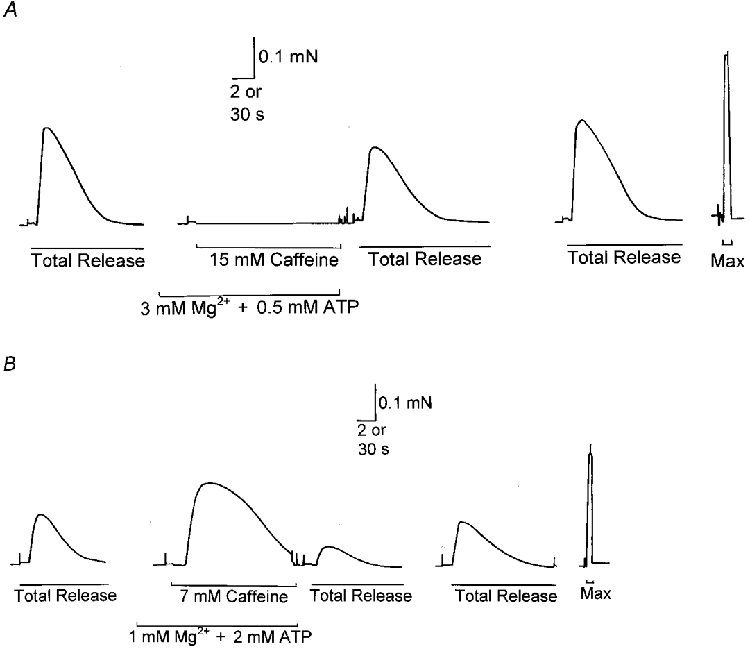
A, the SR of an EDL fibre was depleted of all of its Ca2+ by exposing the fibre to 30 mm caffeine-low [Mg2+] solution (pCa 8, 0.5 mm EGTA, 8 mm ATP; see Methods) (Total Release), with the area (i.e. time integral) of the force response being indicative of the total amount of Ca2+ released (see Results). After reloading the SR to the original level (35 s load at pCa 6.7, 1 mm EGTA), the fibre was equilibrated in 3 mm Mg2+-0.5 mm ATP (pCa ≈7.0, 0.025 mm EGTA) and gave no response whatsoever during a 15 s exposure to 15 mm caffeine. The SR was then fully depleted of Ca2+ again (second Total Release) and the somewhat reduced force response indicated that some Ca2+ had in fact been lost from the SR during exposure to the 15 mm caffeine solution. Finally, the SR was reloaded again and the initial control procedure repeated (third Total Release). B, in contrast, when a different EDL fibre was equilibrated with 1 mm Mg2+ and 2 mm ATP present in the solution, exposure to only 7 mm caffeine induced a large force response and a considerable loss of Ca2+ from the SR (see reduction in the following Total Release). The fibre was reloaded for 30 s between stimuli, as in A. Time scale, 2 s throughout, except during washout period preceding second Total Release in both A and B where it is 30 s.
Contractile apparatus experiments
The Ca2+ sensitivity of the contractile apparatus was examined after first destroying all membranous compartments by treating the fibre with 2 % Triton X-100 (in K-HDTA solution with 0.5 mm EGTA) for 5 min and then extensively washing out the Triton. The fibre was then bathed in a sequence of K-HDTA solutions with 8 mm ATP and 1 mm Mg2+ (see above) buffered with 3 mm Ca-EGTA/EGTA over a range of free [Ca2+] (pCa > 8 to < 5.0). The fibre was then exposed to similar sequences of solutions at other [ATP] and [Mg2+], bracketing sequences under one condition with those under another to ensure accurate paired comparison. The force produced by the fibre at each pCa under a given condition was expressed as a percentage of the corresponding maximum Ca2+-activated force and plotted against pCa. The scientific analysis program GraphPad Prism (GraphPad Software Inc., San Diego, CA, USA) was used to fit Hill curves to the force-pCa data obtained under each condition.
Force traces and analysis of results
In all traces showing depolarization-induced force responses, unless indicated otherwise the skinned muscle fibre was bathed in the standard K-HDTA solution (8 mm ATP, 1 mm Mg2+, pCa μ7.0, 0.025 mm EGTA) and depolarized in the corresponding Na+ solution. In the text, the mean values are shown ±s.e.m. and statistical probability (P) was determined with Student's t test (one-tailed, paired or unpaired, as appropriate) and considered significant if P < 0.05.
RESULTS
Effect of raised [Mg2+] and low [ATP] on depolarization-induced responses
As described previously (Lamb & Stephenson, 1994; Lamb et al. 1995), depolarizing the sealed T-system of a mechanically skinned EDL fibre, by replacing the high [K+] bathing solution with a matched Na+-based solution, elicits rapid Ca2+ release and a near-maximal force response when the bathing solutions contain 8 mm total ATP and 1 mm free Mg2+ (e.g. Fig. 1A). These solutions have only 0.025 mm total EGTA present (pCa μ7.0) and > 90 % of the released Ca2+ is resequestered by the SR rather than being lost from the fibre (Lamb & Stephenson, 1990). The Ca2+-buffering conditions were chosen such that the fibre slowly took up Ca2+ from the bathing solution over the 45 s period between successive depolarizations to compensate for the small net loss during a depolarization. In order to investigate whether lowered [ATP] and raised [Mg2+] affect the amount of Ca2+ released by depolarization, we first examined their effects on the size of the depolarization-induced force response. This provided information about the net effect of the changes on the contractile apparatus and depolarization-induced Ca2+ release, and importantly also showed that it was possible to use a particular method (see below) to assay the amount of Ca2+ released independently of any effects on the contractile apparatus.
Each fibre was first equilibrated for 45 s under the new conditions before being depolarized. When the free [Mg2+] was raised from 1 to 3 mm, with the total [ATP] unchanged at 8 mm (e.g. Fig. 1A), the peak of the depolarization-induced force response was reduced to 85 ± 2.4 % (n = 6) of the bracketing control responses (obtained under the standard conditions of 1 mm Mg2+ and 8 mm ATP), and the response also became significantly briefer (half-width, 54 ± 2.2 % of bracketing controls). Matching experiments in which the contractile apparatus was directly activated by Ca2+ (see Methods) showed that Ca2+ sensitivity was substantially reduced in the presence of 3 mm Mg2+ (pCa giving 50 % maximum force (pCa50): 6.11 ± 0.01 in 1 mm Mg2+, n = 4; change in pCa50 in 3 mm Mg2+: −0.21 ± 0.02, P < 0.05)] with the maximum Ca2+-activated force little changed (101 ± 0.1 % in 3 mm Mg2+), which is similar to previous findings (Donaldson & Kerrick, 1975). Thus, it is unclear whether depolarization-induced Ca2+ release was reduced in the presence of 3 mm Mg2+, because it is possible that most or perhaps all of the reduction in force might have been due to the reduced Ca2+ sensitivity of the contractile apparatus. Nevertheless, it is still apparent that (a) the 45 s equilibration time in 3 mm Mg2+ was sufficient to induce full effect, and (b) the changes were fully reversed by returning to 1 mm Mg2+.
When the total [ATP] was decreased from 8 to 0.5 mm, with the [Mg2+] unchanged at 1 mm, the peak of the depolarization-induced force response was not significantly changed (94 ± 3.5 %, n = 4), but the response was considerably prolonged (half-width, 354 ± 68 %), due to large decreases in both the rate of rise and the rate of decline of the response (10-90 % rise-time: 1.3 ± 0.3 s and 90-10 % fall-time: 3.5 ± 0.2 s, which were 3.1 ± 0.6 and 3.6 ± 0.4 times the respective values at 8 mm ATP). These force changes are very similar to those found in toad fibres at the same [ATP] (Owen et al. 1996), and in the case of the toad fibres additional experiments showed the total amount of Ca2+ released was reduced by more than 50 %. Here, the large decrease in the rate of rise of force at 0.5 mm ATP also suggests that the Ca2+ release rate was lower at 0.5 mm ATP than at 8 mm ATP. The combined effect of decreasing the [ATP] from 8 to 0.5 mm and raising the [Mg2+] from 1 to 3 mm was to reduce the peak and half-width of the force response to 74 ± 7.5 and 48 ± 3.8 % of the respective bracketing control values (n = 7) (e.g. Fig. 1B). Matched experiments on the contractile apparatus properties (see Methods) showed that in the presence of 3 mm Mg2+, maximum Ca2+-activated force was substantially higher (107 ± 1.4 %, n = 4, P < 0.05)] in 0.5 mm ATP than in 8 mm ATP, similar to previous findings with 1 mm Mg2+ (Godt & Nosek, 1989). When this increase is taken into account, even ignoring the fact that the Ca2+ sensitivity was also increased at 0.5 mm ATP (change in pCa50: 0.12 ± 0.01, P < 0.05)], the normalized depolarization-induced force responses in 3 mm Mg2+ at 0.5 mm ATP were significantly smaller than those at 8 mm ATP (i.e. 69 ± 7.0 %versus 85 ± 2.4 % (see above), P < 0.05)]. This indicates that, in the presence of 3 mm Mg2+, less Ca2+ was released by a depolarization in 0.5 mm ATP than in 8 mm ATP. This was verified in the following experiments with a different method of assaying the amount of Ca2+ released.
Assay of amount of Ca2+ released by depolarization
In the above experiments, it was difficult to assess the amount of Ca2+ released by depolarization under particular conditions because of the accompanying changes in the properties of the contractile apparatus. Nevertheless, those experiments do show that the effects are established within the 45 s equilibration period and are fully reversible upon washout. Consequently, we were able to ascertain the amount of depolarization-induced Ca2+ release under each condition by releasing the Ca2+ in the presence of the Ca2+ chelator EGTA, and then using the size of the subsequent response to depolarization under standard conditions to determine how much Ca2+ had been lost from the SR (e.g. Fig. 2).
Because of the considerable variability between fibres in the amount of Ca2+ released by a single (2–3 s) depolarization, it was necessary to make paired comparisons of the amount of Ca2+ released under the different conditions in each fibre. Furthermore, as the amount of Ca2+ released was to be determined by depolarizing the fibre in the presence of high [EGTA]-low free [Ca2+], it was also necessary to determine how much Ca2+ was lost when simply exposing the fibre to the same EGTA solution without any depolarization (Ca2+ leak). This is because it was theoretically possible that a fibre might lose more Ca2+ during the equilibration period under one condition than under the other condition, but yet depolarization still release a similar amount of Ca2+ under the two conditions. If this occurred, there would be a difference in the final amount of Ca2+ in the SR, even though depolarization was similarly effective at inducing release under the two conditions. Thus, in order to enable paired comparison of the amount of Ca2+ released by depolarization under two different conditions, a total of four different treatments had to be examined in every fibre (i.e. with and without depolarization, under each of the two conditions), as illustrated in Fig. 2. After a fibre had been depleted of some or most of its releasable Ca2+ by depolarization, the SR had to be reloaded until the force response was restored to within μ10 % of the original level. Hence, to complete the full protocol in each fibre, it was necessary to elicit many similar depolarization-induced responses. This was achieved in the majority of fibres examined, with the response typically becoming briefer over the first few responses before stabilizing, and the peak force dropping by about 10-15 % over the course of the experiment. For each pair of conditions examined, the order of the two treatments was reversed in alternate fibres, thereby eliminating any bias due to the order of presentation of the treatments. Furthermore, as shown in Fig. 3, in cases where it was possible to examine the same treatment more than once in the same fibre, similar responses were generally obtained irrespective of the order of presentation; Fig. 3 is representative of the data found in 19 out of 25 fibres examined, with the other six cases showing poorer reproducibility, presumably reflecting either variability in the responses or eventual fibre run down. In cases where values with and without depolarization were obtained for only one condition, no paired comparison could be made, but the data could still be used to make non-paired comparisons across all of the different treatments (see Table 2).
Figure 3. Repeated treatments in the same fibre.
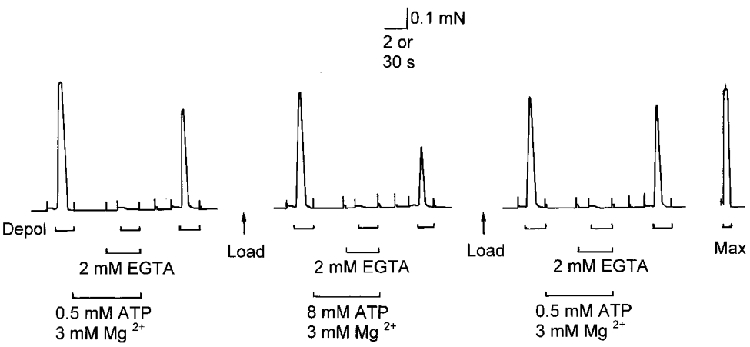
The amount of Ca2+ released by a depolarization in the presence of 0.5 mm ATP-3 mm Mg2+ was assayed both before and after testing with 8 mm ATP-3 mm Mg2+, and similar responses were obtained. Time scale, 2 s during depolarizations and 30 s elsewhere. Standard conditions were used (1 mm Mg2+, 8 mm ATP, 0.025 mm EGTA, pCa ≈7.0) except where indicated.
Table 2. Unpaired data of Ca2+ leak and depolarization-induced Ca2+ release obtained over all experiments.
| A | B | C | D | E | F | G | |
|---|---|---|---|---|---|---|---|
| [Mg2+] (mm) | 1 | 1 | 3 | 3 | 1 | 1 | 3 |
| [ATP] (mm) | 8 | 0.5 | 8 | 0.5 | 0.5 | 0.5 | 0.5 |
| [AMP] (mm) | — | — | — | — | 3 | 3 | 3 |
| [IMP] (mm) | — | — | — | — | — | 3 | 3 |
| (n = 21) | (n = 33) | (n = 24) | (n = 36) | (n = 13) | (n = 13) | (n = 11) | |
| Reduction in peak force with Ca2+ leakage alone (%) | 6.3 ± 1.3 | 4.2 ± 1.1 | 5.5 ± 1.1 | 6.9 ± 1.0 | 4.1 ± 1.4 | 4.8 ± 1.4 | 9.8 ± 2.2 |
| Ca2+ released by depolarization | |||||||
| Difference in peak forces (%) | 66.2 ± 3.3 | 65.9 ± 3.6 | 65.9 ± 3.9 | 47.8 ± 3.7 | 69.1 ± 5.2 | 51.5 ± 4.3 | 16.3 ± 4.6 |
| Ca2+ content decrease (%) | 66.2 ± 3.8 | 66.7 ± 4.0 | 67.3 ± 4.2 | 47.3 ± 3.9 | 69.1 ± 5.4 | 55.7 ± 5.0 | 17.5 ± 5.7 |
Ca2+ leakage was relatively small under all conditions, despite the slight increase in column G. The Ca2+ content decrease found upon depolarization (with Ca2+ leakage discounted) was significantly lower (P < 0.05)] in 3 mm Mg2+–0.5 mm ATP (column D) than in lower [Mg2+] and/or higher [ATP] (i.e. columns A, B and C), and was further lowered by addition of 3 mm AMP and 3 mm IMP (column D versus column G, P < 0.05)]. At 1 mm Mg2+–0.5 mm ATP, the Ca2+ content decrease was not significantly lowered by adding either 3 mm AMP alone (column B versus column E) or 3 mm AMP plus 3 mm IMP (column B versus column F).
Effect of low [ATP] and high [Mg2+] on depolarization-induced Ca2+ release
It was found that the rate of Ca2+ leakage from the SR during exposure (without depolarization) to the 2 mm EGTA-low [Ca2+] solution was quite low irrespective of the [ATP] and [Mg2+] present. This was concluded because, after such exposure, the size of the subsequent depolarization-induced response under control conditions was only reduced by a small amount in every case, with mean reductions ranging from 4.2 ± 1.1 to 6.9 ± 1.0 % of the control response in the same fibre before exposure (see top row, columns A-D of non-paired data in Table 2). In addition, there was no systematic difference in the mean values when lowering the [ATP] from 8 to 0.5 mm at constant [Mg2+], or raising [Mg2+] from 1 to 3 mm at constant [ATP] (see Table 2). Furthermore, when the Ca2+ leakage was examined by paired comparison in the same fibres, there was no significant difference for any of the three combinations examined (0.5 versus 8 mm ATP at both 1 and 3 mm Mg2+, and 1 versus 3 mm Mg2+ at 8 mm ATP) (see Table 1). Thus, there appeared to be little difference in the amount of Ca2+ leaking out of the SR during the periods of equilibration and EGTA exposure for the different [ATP] and [Mg2+] conditions used. Based on previous experiments in which a fibre-lysing technique was used to establish the relationship between the size of the depolarization-induced response and the amount of releasable Ca2+ in the SR of comparable EDL fibres (Owen et al. 1997), the μ4-7 % reduction in the peak size of the depolarization-induced response can be directly equated with an μ8-14 % loss in the amount of releasable Ca2+ (see Methods).
Table 1. Ca2+ leak and depolarization-induced Ca2+ release obtained by paired comparison as shown in Fig. 2.
| 8 mm ATP (n = 5) | 1 mm Mg2+ (n = 10) | 3 mm Mg2+ (n = 12) | ||||
|---|---|---|---|---|---|---|
| 1 mm Mg2+ | 3 mm Mg2+ | 8 mm ATP | 0.5 mm ATP | 8 mm ATP | 0.5 mm ATP | |
| Reduction in peak force ith Ca2+ leakage alone (%) | 3.5 ± 1.6 | 7.7 ± 1.9 | 5.4 ± 1.7 | 5.7 ± 2.3 | 4.3 ± 1.6 | 5.5 ± 1.4 |
| Ca2+ released by depolarization | ||||||
| Difference in peak forces (%) | 69.4 ± 4.3 | 47.8 ± 5.9* | 72.5 ± 5.4 | 71.4 ± 6.9 | 69.9 ± 5.9 | 60.0 ± 5.0* |
| Ca2+ content decrease (%) | 73.0 ± 4.7 | 43.6 ± 5.9* | 68.7 ± 7.8 | 72.8 ± 7.8 | 74.3 ± 5.9 | 58.8 ± 6.3* |
| 1 mm Mg2+, 0.5 mm ATP (n = 11) | 1 mm Mg2+,0.5 mm ATP (n = 7) | 1 mm Mg2+ (n = 5) | 3 mm Mg2+, 0.5 mm ATP (n = 10) | |||||
|---|---|---|---|---|---|---|---|---|
| — | +AMP | — | +AMP/IMP | 8 mm ATP | 0.5 mm ATP +AMP/IMP | — | +AMP/IMP | |
| Reduction in peak force with Ca2+ leakage alone (%) | 2.0 ± 1.1 | 2.8 ± 1.3 | 1.6 ± 1.2 | 5.7 ± 2.2* | 8.8 ± 2.4 | 4.4 ± 2.2 | 7.1 ± 1.8 | 10.7 ± 2.4 |
| Ca2+ released by depolarization | ||||||||
| Difference in peak forces (%) | 74.1 ± 7.7 | 73.5 ± 5.1 | 53.4 ± 6.3 | 52.8 ± 6.5 | 51.9 ± 4.6 | 48.4 ± 7.1 | 31.9 ± 5.4 | 16.8 ± 5.1 |
| Ca2+ content decrease (%) | 76.9 ± 8.5 | 74.6 ± 4.4 | 56.3 ± 6.8 | 50.8 ± 7.9 | 61.3 ± 1.6 | 60.7 ± 6.6 | 34.6 ± 4.4 | 16.1 ± 6.0* |
Significantly lower (or higher) than paired value at P < 0.05.
When an EDL fibre was given one depolarization (μ2-3 s) in the EGTA-low [Ca2+] solution with 8 mm ATP and 1 mm Mg2+ present, the subsequent depolarization-induced response under control conditions was greatly reduced compared with the preceding control response, in terms of both its peak size and its area (i.e. time integral) (mean peak size: 27.5 ± 3.1 %, range: 3–55 %, n = 21; mean ‘area’ 12.6 ± 1.8 %). Using the relationship between response size and SR Ca2+ content found previously in EDL fibres (Owen et al. 1997), these measures indicated that only μ22 % of the releasable Ca2+ remained in the SR following the depolarization. Thus, one depolarization under the standard conditions of 8 mm ATP and 1 mm Mg2+ released the great majority of the Ca2+ in the SR.
Paired comparisons, like that illustrated in Fig. 2, showed that at 8 mm ATP, depolarization released μ40 % less Ca2+ from the SR in 3 mm Mg2+ than in 1 mm Mg2+ (Table 1). In addition to showing the relative decrease in the response size after Ca2+ leakage (i.e. with no depolarization; top rows), Tables 1 and 2 also give two different measures of the amount of Ca2+ released by a depolarization (middle and bottom rows): (a) as the difference in the peaks of the responses with and without a depolarization (e.g. peak of T1 minus peak of T2 in Fig. 2), and (b) as the difference in the calculated SR Ca2+ content with and without a depolarization. This latter measure used the relationships between SR Ca2+ content and the peak and area of the force response found by Owen et al. (1997) (see Methods), and gave quantitatively similar values to the measure based on the difference in peak response. The close similarity is to some extent coincidental, because it results from the fact that reduction in the peak response after leakage alone (i.e. 4–10 %) underestimates the loss of SR Ca2+ by approximately 2-fold, but this is roughly compensated for by the fact that the peak size of the response after a depolarization in low [Ca2+]-EGTA overestimates the amount of Ca2+ remaining in the SR by a comparable amount (e.g. μ20-30 % for peak size versusμ12-17 % for Ca2+ remaining). This is in fact quite useful, because it means that the extent of the Ca2+ loss in EDL fibres can be gauged quite accurately simply from the change in the peak size of the force response. It is also important to note that these measures of Ca2+ release are independent of any differences in Ca2+ leakage occurring under the different conditions, because this was already assessed and taken into account for each individual fibre before calculating the mean Ca2+ release.
Effect of low [ATP] and high [Mg2+] on caffeine-induced Ca2+ release
We further found that this potent inhibitory effect of low [ATP]-high [Mg2+] also occurred when directly activating the Ca2+ release channels with caffeine. Fibres were rapidly and fully depleted of releasable Ca2+ by exposure to a solution with 30 mm caffeine, 0.05 mm Mg2+ and 0.5 mm EGTA (pCa 8; see Methods) (Fryer & Stephenson, 1996), and could then be reloaded and depleted again with highly reproducible results (e.g. Fig. 4). The area (i.e. time integral) of the resulting force response was indicative of the amount of releasable Ca2+ in the SR because it increased approximately linearly with loading time (not shown; see Bakker et al. 1996). On each cycle the SR was loaded under standard conditions to the same level (approximately the level present endogenously; see Methods), and then the fibre was equilibrated for 20 s at the desired [ATP] and [Mg2+] (pCa 7.0, 0.025 mm EGTA) and stimulated by substituting a similar solution containing 7 or 15 mm caffeine. None of the three fibres equilibrated in 3 mm Mg2+-0.5 mm ATP gave any force response whatsoever over a 15 s exposure to 15 mm caffeine (e.g. Fig. 4A), and when the SR was fully depleted again soon afterwards using the standard 30 mm caffeine-low [Mg2+] solution, the size of the force response indicated that the amount of releasable Ca2+ was only reduced by 21 ± 1 % of that found with bracketing control responses performed without the 15 mm caffeine test. In contrast, when other fibres were similarly loaded and equilibrated in 1 mm Mg2+ and 2 mm ATP, exposure to only 7 mm caffeine induced a large force response in every case (66.2 ± 7.8 % of maximum Ca2+-activated force, n = 5, 15 s exposure), and when subsequently fully depleted the size of the force response indicated that the SR contained only 50.4 ± 7.5 % of the original Ca2+ content (e.g. Fig. 4B). Thus, the ability of caffeine to induce Ca2+ release from the SR is also substantially inhibited in the presence of 0.5 mm ATP and 3 mm Mg2+.
Effects of AMP and IMP on Ca2+ release
Experiments on Ca2+-induced and caffeine-induced Ca2+ release in SR vesicles indicate that the metabolites of ATP could either help or hinder Ca2+ release, depending on the [ATP] (see Discussion), so it was of interest to determine whether the inhibitory effect of low [ATP] on depolarization-induced Ca2+ release observed here was reversed, unaffected or exacerbated by the presence of the metabolites AMP and IMP. Paired comparison showed that neither 3 mm AMP alone, nor 3 mm AMP plus 3 mm IMP caused any significant change in the amount of Ca2+ released by a depolarization in the presence of 0.5 mm ATP and 1 mm Mg2+ (Table 1). (The amount of Ca2+ leakage was found to be significantly greater under the latter conditions, but the absolute difference was very small, and may be of little importance even if real, and in any case had no effect on the release estimate because of the protocol used - see above.) Furthermore, the combination of reducing the [ATP] from 8 to 0.5 mm and simultaneously adding 3 mm AMP and 3 mm IMP had no effect on the amount of Ca2+ released by a depolarization (Table 1). However, addition of AMP and IMP did cause a significant, almost 2-fold, reduction in Ca2+ release when the amount of release was already reduced by the presence of 3 mm Mg2+ and 0.5 mm ATP (Table 1). The combined inhibitory effect of having the metabolites together with 0.5 mm ATP and 3 mm Mg2+ is also apparent in the non-paired total data (Table 2), where the mean amount of Ca2+ released by a depolarization was only 26 % of that released in 1 mm Mg2+ and 8 mm ATP in the absence of the metabolites (i.e. 17.5 ± 5.7 versus 66.2 ± 3.8 % of the total releasable Ca2+ originally present in the SR).
DISCUSSION
Effects of lowered [ATP] and raised [Mg2+]
This study shows that at 8 mm ATP raising the [Mg2+] from 1 to 3 mm causes a significant (μ40 %) decrease in the total amount of Ca2+ released by depolarization in rat EDL fibres. This suggests that the 50 % reduction in tetanic force found in mouse fibres when raising the [Mg2+] to 2.9 mm by injection of MgCl2 (Westerblad & Allen, 1992) was largely the result of reduced Ca2+ release. Although decreasing the total [ATP] from 8 to 0.5 mm did not cause a significant change in the total amount of Ca2+ released at 1 mm Mg2+, it did cause a significant reduction (μ20 %) at 3 mm Mg2+ (Table 1). The combined inhibitory effect of reducing the [ATP] to 0.5 mm and raising the [Mg2+] to 3 mm was even apparent in the non-paired data (Table 2), despite the considerable variation between fibres in the amount of Ca2+ released by a depolarization.
It is important to stress here that the assay used in this study quantifies the total amount of Ca2+ released by a depolarization, not the Ca2+ release rate, and it is quite likely that the initial Ca2+ release rate was inhibited considerably more than was the total release. When voltage-clamped fibres are depolarized the rate of Ca2+ release is initially high and then declines considerably over a period of hundreds of milliseconds (Shirokova et al. 1998), due to a combination of Ca2+ inactivation of release, depletion of SR Ca2+ gradient and, with longer stimuli, voltage sensor inactivation (Lamb & Stephenson, 1990). In the experiments here, only μ20 % of the total releasable Ca2+ remained in the SR after one depolarization in EGTA at 1 mm Mg2+ and 8 mm ATP. (This remaining Ca2+ is releasable by depolarizing once or twice more or by applying 30 mm caffeine-low [Mg2+] - see Owen et al. 1997.) Furthermore, some of this Ca2+ had in fact probably been taken up by the SR during the 45 s equilibration period under standard conditions before the test depolarization, even though this Ca2+ uptake was intentionally minimized by using a solution that was only weakly buffered (0.025 mm EGTA) at pCa μ7.0 to rinse out the EGTA. Thus, it is clear that the great majority of Ca2+ in the SR was released during a (2–3 s) depolarization in 1 mm Mg2+ and 8 mm ATP, and it is likely that the initial rate of release was much higher than the average level over the whole stimulus. So, given the inherent variability in stimuli and responses, only a very substantial decrease in the initial rate of Ca2+ release would produce a detectable reduction in the total amount of Ca2+ released by a depolarization. Consequently, the reduction in total Ca2+ release found here under various conditions almost certainly considerably underestimates the extent to which the initial Ca2+ release rate was inhibited. This would readily explain why lowering the [ATP] to 0.5 mm did not cause a detectable reduction in Ca2+ release unless it was done when the Ca2+ release rate was already considerably reduced by the presence of 3 mm Mg2+. Specifically, a substantial reduction in the initial Ca2+ release rate would possibly have little effect on the total release at 1 mm Mg2+ as the net release rate might still be high enough to release most of the Ca2+ over the 2–3 s depolarization, but when the rate of Ca2+ release was reduced by the presence of 3 mm Mg2+, a further reduction in the release rate due to the low [ATP] might then cause a noticeable reduction in the total amount of Ca2+ released.
Despite such limitations of the assaying procedure, it is apparent that the cytoplasmic [ATP] does indeed modulate depolarization-induced Ca2+ release in mammalian skeletal muscle fibres, at least in the presence of 3 mm Mg2+. This is the first demonstration of such modulation in mammalian fibres. It is further apparent that the inhibition of Ca2+ release occurring with a decrease in [ATP] from 8 to 0.5 mm is considerably less than that caused by raising the [Mg2+] from 1 to 3 mm, because only the latter caused a significant decrease in the amount of Ca2+ released when applied alone (Table 1). When these two factors were applied together, they caused an even greater reduction in depolarization-induced Ca2+ release than either did alone (Tables 1 and 2), and this may be relevant to the basis of muscle fatigue (see below). This inhibition of Ca2+ release in mammalian muscle fibres at lowered [ATP] and raised [Mg2+] is broadly similar to that found in toad muscle fibres (Owen et al. 1996), which is interesting given the differences in the types of Ca2+ release channels present and the putative role of Ca2+-induced Ca2+ release in the coupling mechanisms in the two cases (see Introduction). Nevertheless, at 1 mm Mg2+, lowering the [ATP] from 8 to 0.5 mm caused a 50 % reduction in Ca2+ release in toad fibres but caused no detectable change in the rat fibres studied here. This might indicate that one (or both) of the Ca2+ release channel isoforms in toad muscle fibres has a lower affinity for ATP than the isoform in rat fibres. Alternatively, the difference may simply indicate that the assay is less able to detect a relative reduction in Ca2+ release rate in rat fibres compared with toad fibres, perhaps because of differences in the absolute rate of release or its inactivation characteristics.
It was further found here that caffeine-induced Ca2+ release in rat fibres was also considerably inhibited at 3 mm Mg2+ and 0.5 mm ATP (see Results and Fig. 4), showing that, like voltage sensor activation, direct activation of the Ca2+ release channels is inhibited by the combination of raised [Mg2+] and lowered [ATP]. These results on direct activation of the Ca2+ release channel are consistent with the findings of Meissner et al. (1986) showing that ATP increases Ca2+ release from isolated SR vesicles of mammalian skeletal muscle, with half-maximal effect at μ1 mm. This latter study also found almost complete block of Ca2+- and ATP-activated Ca2+ release at μ2 mm free Mg2+, and ‘depolarization-induced’ Ca2+ release in isolated SR triads was similarly blocked if the [Mg2+] was raised to μ1.5 mm (Anderson & Meissner, 1995; Yano et al. 1995). Clearly, these latter studies overestimate the inhibitory effect of Mg2+ on normal voltage sensor-controlled Ca2+ release in mammalian muscle, because there is evidently very substantial fast Ca2+ release in both skinned fibres (Fig. 1A) and intact fibres (Westerblad & Allen, 1992) even at 3 mm Mg2+. This difference probably indicates that the Ca2+ release channels in the triad preparations are not as well coupled to the voltage sensors as they are in intact and skinned fibres, and consequently that much of the Ca2+ release is instead triggered by Ca2+-induced Ca2+ release and hence is more easily inhibited by raised [Mg2+].
Effects of AMP and IMP on Ca2+ release
ADP, AMP and the related purine, inosine triphosphate (ITP), have all been shown to augment Ca2+-induced Ca2+ release in isolated SR vesicles in the absence of ATP. These compounds are far less effective than ATP at inducing Ca2+ release, and evidently compete with ATP for the same site on the Ca2+ release channel (Meissner, 1984; Meissner et al. 1986). Consequently, if the [ATP] were very low, it is possible that ATP metabolites such as AMP and IMP might increase the amount of Ca2+ released, but if the [ATP] were somewhat higher, the same concentration of metabolites might reduce Ca2+ release because they compete with the ATP for the stimulatory site but are only weakly effective when occupying that site. Indeed, it has been found that caffeine-induced Ca2+ release in frog fibres is reduced by decreasing the [ATP] from 5 to 0.1 mm, and that this can be partially reversed by addition of 4.9 mm ADP or AMP, but if the same amount of the less effective agonist adenosine is added instead, it further reduces rather than restores Ca2+ release (Duke & Steele, 1998). Thus, it was of interest to see how ATP metabolites affect depolarization-induced Ca2+ release at low [ATP]. We previously found that the reduction in depolarization-induced Ca2+ release occurring in toad fibres at 3 mm Mg2+ and 0.5 mm ATP was not altered by addition of 1.5 mm AMP (Owen et al. 1996). Here, in mammalian fibres, we found no detectable effect of adding either 3 mm AMP or 3 mm AMP plus 3 mm IMP on the amount of Ca2+ released in 0.5 mm ATP and 1 mm Mg2+, but found an appreciable inhibition of release when adding AMP and IMP if the release rate was already considerably reduced by the combined presence of 3 mm Mg2+ and 0.5 mm ATP (Tables 1 and 2). Because these metabolites did not have a significant effect on Ca2+ release at 1 mm Mg2+, we conclude that on their own they cause relatively less inhibition than that produced by raising the [Mg2+] to 3 mm. Importantly, the presence of these metabolites does not restore Ca2+ release at 0.5 mm[ATP], but instead further exacerbates the inhibition, presumably because the metabolites compete with the ATP for the stimulatory binding site on the Ca2+ release channel. Figure 5 shows the additive effects of (a) raising the [Mg2+] from 1 to 3 mm, (b) lowering the [ATP] from 8 to 0.5 mm, and (c) adding 3 mm AMP and 3 mm IMP, based on the paired comparisons for the individual treatments shown in Table 1. This analysis suggests a 4-fold reduction in the total amount of Ca2+ released under such circumstances, and comparison of the non-paired data obtained over all experiments (Table 2) indicates a similar reduction.
Figure 5. Relative amount of Ca2+ released with cumulative addition of various factors.
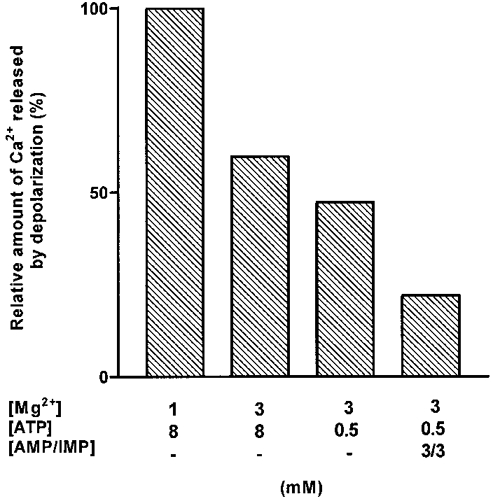
The bars indicate the amount of Ca2+ released by a depolarization relative to that with 1 mm Mg2+ and 8 mm ATP, for progressively changing from 1 to 3 mm Mg2+ (at 8 mm ATP) and from 8 to 0.5 mm ATP (at 3 mm Mg2+), and finally adding 3 mm AMP and 3 mm IMP (at 0.5 mm ATP-3 mm Mg2+). The relative sizes of adjacent bars are derived from the Ca2+ content decreases in Table 1 and simply indicate the relative change in Ca2+ release found by paired comparison of the indicated conditions (i.e. relative changes, left to right: 59.7, 79.1 and 46.5 % - see Table 1). The total reduction in Ca2+ release found by the cumulative combination of all three factors (decrease to 22.0 %) is very similar to that seen directly in the total (non-paired) data in Table 2 (i.e. Ca2+ release in 0.5 mm ATP-3 mm Mg2+ with 3 mm IMP and 3 mm AMP is 26.4 % of that in 8 mm ATP-1 mm Mg2+).
Muscle fatigue
The data presented here, together with those of Westerblad & Allen (1992), suggest that the build-up in the [Mg2+] in a muscle fibre after prolonged stimulation is likely to be responsible for an appreciable part of the observed reduction in Ca2+ release occurring in fatigue. The rise in [Mg2+] also indicates that there must have been a reduction in the [ATP], and such a reduction has been observed directly during fatigue in other studies (see Introduction). It has been argued that the reduced Ca2+ release seen in fatigue is unlikely to be caused by a reduction in cytoplasmic [ATP] (Stienen et al. 1993; Fitts, 1994). In the present study, a reduction in Ca2+ release was found when the [ATP] was decreased to 0.5 mm (at 3 mm Mg2+), which is considerably lower than the lowest level reached in the cytoplasm as a whole (μ2 mm) (Nagesser et al. 1992; Fitts, 1994), and consequently it might be said that the observed reduction in Ca2+ release is of little physiological relevance. However, when a fibre has been fatigued to such an extreme level, virtually all of the store of phosphocreatine has been exhausted and the [ATP] is very poorly buffered. Furthermore, the exhaustion of the phosphocreatine supply indicates that the rate of usage of ATP must have considerably outweighed the synthesis of ATP by all alternative pathways, which at that late stage are all that remain to keep the [ATP] up. Thus, at any local regions within the fibre where the ATP is used at a higher rate than it is locally resynthesized, the [ATP] must be lower than that present on average in the cytoplasm. Consequently, as there are many ATPases in the T-system and SR terminal cisternae membranes, it is quite possible that the [ATP] within the triad junction drops to in the order of 0.5 mm even though there is 2 mm or more ATP in the bulk of the cytoplasm. If this occurs, it will add to the inhibitory effect of the raised [Mg2+] on depolarization-induced Ca2+ release, and the build-up of AMP and IMP that would also occur in parallel locally would further exacerbate, rather than relieve, the inhibition.
In conclusion, we show here that depolarization-induced Ca2+ release in mammalian skeletal muscle fibres is modulated by the [ATP] in the cytoplasm, at least in the case where [Mg2+] is raised, demonstrating the importance to the physiological coupling mechanism of ATP binding to the release channel. We further suggest that in extremely fatigued fibres a severe decrease in the [ATP] locally near the Ca2+ release channels might well augment the inhibitory effect of raised [Mg2+].
Acknowledgments
We thank Professor D. G. Stephenson for helpful comments and the National Health & Medical Research Council of Australia for financial support.
References
- Allen DG, Lännergren J, Westerblad H. Muscle cell function during prolonged activity: cellular mechanisms of fatigue. Experimental Physiology. 1995;80:497–527. doi: 10.1113/expphysiol.1995.sp003864. [DOI] [PubMed] [Google Scholar]
- Allen DG, Lännergren J, Westerblad H. The role of ATP in the regulation of intracellular Ca2+ release in single fibres of mouse skeletal muscle. The Journal of Physiology. 1997a;498:587–600. doi: 10.1113/jphysiol.1997.sp021885. [DOI] [PMC free article] [PubMed] [Google Scholar]
- Allen DG, Lännergren J, Westerblad H. Caged compounds affect calcium release in intact mouse skeletal muscle fibres. Proceedings of the Australian Physiological and Pharmacological Society. 1997b;28:15P. [Google Scholar]
- Anderson K, Meissner G. T-tubule depolarization-induced SR Ca2+ release is controlled by dihydropyridine receptor- and Ca2+-dependent mechanisms in cell homogenates from rabbit skeletal muscle. Journal of General Physiology. 1995;105:363–383. doi: 10.1085/jgp.105.3.363. [DOI] [PMC free article] [PubMed] [Google Scholar]
- Bakker AJ, Lamb GD, Stephenson DG. The effect of 2,5-di-(tert-butyl)-1,4-hydroquinone on force responses and the contractile apparatus in mechanically skinned muscle fibres of the rat and toad. Journal of Muscle Research and Cell Motility. 1996;17:55–67. doi: 10.1007/BF00140324. [DOI] [PubMed] [Google Scholar]
- Chin ER, Balnave CD, Allen DG. Role of intracellular calcium and metabolites in low-frequency fatigue of mouse skeletal muscle. American Journal of Physiology. 1997;272:C550–559. doi: 10.1152/ajpcell.1997.272.2.C550. [DOI] [PubMed] [Google Scholar]
- Donaldson SKB, Kerrick WGL. Characterization of the effects of Mg2+ on Ca2+- and Sr2+-activated tension generation of skinned muscle fibres. Journal of General Physiology. 1975;66:427–444. doi: 10.1085/jgp.66.4.427. [DOI] [PMC free article] [PubMed] [Google Scholar]
- Duke AM, Steele DS. Effects of caffeine and adenine nucleotides on Ca2+ release by the sarcoplasmic reticulum in saponin-permeabilized frog skeletal muscle fibres. The Journal of Physiology. 1998;513:43–53. doi: 10.1111/j.1469-7793.1998.043by.x. [DOI] [PMC free article] [PubMed] [Google Scholar]
- Fink RHA, Stephenson DG, Williams DA. Potassium and ionic strength effects on the isometric force of skinned twitch muscle fibres of the rat and toad. The Journal of Physiology. 1986;370:317–337. doi: 10.1113/jphysiol.1986.sp015937. [DOI] [PMC free article] [PubMed] [Google Scholar]
- Fitts RH. Cellular mechanisms of muscle fatigue. Physiological Reviews. 1994;74:49–94. doi: 10.1152/physrev.1994.74.1.49. [DOI] [PubMed] [Google Scholar]
- Fryer MW, Stephenson DG. Total and sarcoplasmic reticulum calcium contents of skinned fibres from rat skeletal muscle. The Journal of Physiology. 1996;493:357–370. doi: 10.1113/jphysiol.1996.sp021388. [DOI] [PMC free article] [PubMed] [Google Scholar]
- Godt RE, Nosek TM. Changes of intracellular milieu with fatigue of hypoxia depress contraction of skinned rabbit skeletal and cardiac muscle. The Journal of Physiology. 1989;412:155–180. doi: 10.1113/jphysiol.1989.sp017609. [DOI] [PMC free article] [PubMed] [Google Scholar]
- Hood DA, Parent G. Metabolic and contractile responses of rat fast-twitch muscle to 10-Hz stimulation. American Journal of Physiology. 1991;260:C832–840. doi: 10.1152/ajpcell.1991.260.4.C832. [DOI] [PubMed] [Google Scholar]
- Lamb GD, Junankar PR, Stephenson DG. Raised intracellular [Ca2+] abolishes excitation-contraction coupling in skeletal muscle fibres of rat and toad. The Journal of Physiology. 1995;489:349–362. doi: 10.1113/jphysiol.1995.sp021056. [DOI] [PMC free article] [PubMed] [Google Scholar]
- Lamb GD, Recupero E, Stephenson DG. Effect of myoplasmic pH on excitation-contraction coupling in skeletal muscle fibres of the toad. The Journal of Physiology. 1992;448:211–224. doi: 10.1113/jphysiol.1992.sp019037. [DOI] [PMC free article] [PubMed] [Google Scholar]
- Lamb GD, Stephenson DG. Calcium release in skinned muscle fibres of the toad by transverse tubule depolarization or by direct stimulation. The Journal of Physiology. 1990;423:495–517. doi: 10.1113/jphysiol.1990.sp018036. [DOI] [PMC free article] [PubMed] [Google Scholar]
- Lamb GD, Stephenson DG. Effect of Mg2+ on the control of Ca2+ release in skeletal muscle fibres of the toad. The Journal of Physiology. 1991;434:507–528. doi: 10.1113/jphysiol.1991.sp018483. [DOI] [PMC free article] [PubMed] [Google Scholar]
- Lamb GD, Stephenson DG. Effects of intracellular pH and [Mg2+] on excitation-contraction coupling in skeletal muscle fibres of the rat. The Journal of Physiology. 1994;478:331–339. doi: 10.1113/jphysiol.1994.sp020253. [DOI] [PMC free article] [PubMed] [Google Scholar]
- Laver DR, Owen VJ, Junankar PR, Taske NL, Dulhunty AF, Lamb GD. Reduced inhibitory effect of Mg2+ on ryanodyine receptor-Ca2+ release channels in malignant hyperthermia. Biophysical Journal. 1997;73:1913–1924. doi: 10.1016/S0006-3495(97)78222-5. [DOI] [PMC free article] [PubMed] [Google Scholar]
- Martell AE, Smith RM. Critical Stability Constants. Vol. 6. New York: Plenum Press; 1974. [Google Scholar]
- Meissner G. Adenine nucleotide stimulation of Ca2+-induced Ca2+ release in sarcoplasmic reticulum. Journal of Biological Chemistry. 1984;259:2365–2374. [PubMed] [Google Scholar]
- Meissner G, Darling E, Eveleth J. Kinetics of rapid Ca2+ release by sarcoplasmic reticulum. Effects of Ca2+, Mg2+, and adenine nucleotides. Biochemistry. 1986;25:236–244. doi: 10.1021/bi00349a033. [DOI] [PubMed] [Google Scholar]
- Meissner G, Rios R, Tripathy A, Pasek DA. Regulation of skeletal muscle Ca2+ release channel (ryanodine receptor) by Ca2+ and monovalent cations and anions. Journal of Biological Chemistry. 1997;272:1628–1638. doi: 10.1074/jbc.272.3.1628. [DOI] [PubMed] [Google Scholar]
- Melzer W, Herrmann-Frank A, Lüttgau HC. The role of Ca2+ ions in excitation-contraction coupling of skeletal muscle fibres. Biochimica et Biophysica Acta. 1995;1241:59–116. doi: 10.1016/0304-4157(94)00014-5. [DOI] [PubMed] [Google Scholar]
- Nagesser AS, Van der Laarse WJ, Elzinga G. Metabolic changes with fatigue in different types of single muscle fibres of Xenopus laevis. The Journal of Physiology. 1992;448:511–523. doi: 10.1113/jphysiol.1992.sp019054. [DOI] [PMC free article] [PubMed] [Google Scholar]
- Nagesser AS, Van der Laarse WJ, Elzinga G. ATP formation and ATP hydrolysis during fatiguing, intermittent stimulation of different types of single muscle fibres from Xenopus laevis. Journal of Muscle Research and Cell Motility. 1993;14:608–618. doi: 10.1007/BF00141558. [DOI] [PubMed] [Google Scholar]
- Ogawa Y. Role of ryanodine receptors. Critical Reviews in Biochemistry and Molecular Biology. 1994;29:229–274. doi: 10.3109/10409239409083482. [DOI] [PubMed] [Google Scholar]
- Owen VJ, Lamb GD, Stephenson DG. Effect of low [ATP] on depolarization-induced Ca2+ release in skeletal muscle fibres of the toad. The Journal of Physiology. 1996;493:309–315. doi: 10.1113/jphysiol.1996.sp021385. [DOI] [PMC free article] [PubMed] [Google Scholar]
- Owen VJ, Lamb GD, Stephenson DG, Fryer MW. Relationship between depolarization-induced force responses and Ca2+ content in skeletal muscle fibres of rat and toad. The Journal of Physiology. 1997;498:571–586. doi: 10.1113/jphysiol.1997.sp021884. [DOI] [PMC free article] [PubMed] [Google Scholar]
- Shirokova N, Garcia J, Rios E. Local calcium release in mammalian skeletal muscle. The Journal of Physiology. 1998;512:377–384. doi: 10.1111/j.1469-7793.1998.377be.x. [DOI] [PMC free article] [PubMed] [Google Scholar]
- Stephenson DG, Williams DA. Calcium-activated force responses in fast- and slow-twitch skinned muscle fibres of the rat at different temperatures. The Journal of Physiology. 1981;317:281–302. doi: 10.1113/jphysiol.1981.sp013825. [DOI] [PMC free article] [PubMed] [Google Scholar]
- Stienen GJM, van Graas IA, Elzinga G. Uptake and caffeine-induced release of calcium in fast muscle fibres of Xenopus laevis: effects of MgATP and Pi. American Journal of Physiology. 1993;265:C650–657. doi: 10.1152/ajpcell.1993.265.3.C650. [DOI] [PubMed] [Google Scholar]
- Westerblad H, Allen DG. Myoplasmic free Mg2+ concentration during repetitive stimulation of single fibres from mouse skeletal muscle. The Journal of Physiology. 1992;453:413–434. doi: 10.1113/jphysiol.1992.sp019236. [DOI] [PMC free article] [PubMed] [Google Scholar]
- Yano M, El-Hayek R, Ikemoto N. Conformational changes in the junctional foot protein/Ca2+ release channel mediate depolarization-induced Ca2+ release from sarcoplasmic reticulum. Journal of Biological Chemistry. 1995;270:3017–3021. doi: 10.1074/jbc.270.7.3017. [DOI] [PubMed] [Google Scholar]