

Abstract
Parasol retinal ganglion cells are more sensitive to luminance contrast and respond more transiently at all levels of adaptation than midget ganglion cells. This may be due, in part, to differences between bipolar cells that provide their input, and the goal of these experiments was to study these differences. Midget bipolar cells are known to be presynaptic to midget ganglion cells. To identify the bipolar cells presynaptic to parasol cells, these ganglion cells were intracellularly injected with Neurobiotin, cone bipolar cells were immunolabeled, and the double-labeled material was analyzed. In the electron microscope, we found that DB3 diffuse bipolar cells labeled by using antiserum to calbindin D-28k were presynaptic to OFF parasol cells. In the confocal microscope, DB3 bipolars costratified with OFF parasol cell dendrites and made significantly more appositions with them than expected due to chance. Flat midget bipolar cells were labeled with antiserum to recoverin. Although they made a few appositions with parasol cells, the number was no greater than would be expected when two sets of processes have overlapping distributions in the inner plexiform layer. DB2 diffuse bipolar cells were labeled with antibodies to excitatory amino acid transporter 2, and they also made appositions with OFF parasol cells. These results suggest that DB2 bipolar cells are also presynaptic to OFF parasol ganglion cells, but midget bipolar cells are not. We estimate that midperipheral OFF parasol cells receive ≈500 synapses from 50 DB3 bipolar cells that, in turn, receive input from 250 cones.
Indexing terms: confocal microscopy, electron microscopy, calbindin, primate
Parasol cells are one of the major types of primate retinal ganglion cells (Polyak, 1941). They are also called M cells because they project to the magnocellular layers of the lateral geniculate nucleus (LGN) (Leventhal et al., 1981; Perry et al., 1984). Using intracellular recording and dye injection, Dacey and Lee (1994) showed that parasol cells with dendrites ramifying in the outer half of the inner plexiform layer (IPL) give OFF responses to light, and parasol cells with dendrites ramifying in the inner half of the IPL give ON responses to light. Peripheral parasol cells receive ≈20% of their input from bipolar cells, but it is uncertain which types of bipolar cells these are (Jacoby et al., 1996). The goal of this study was to identify the presynaptic bipolar cells.
Three types of bipolar cells have axon terminals that might provide input to parasol cell dendrites: DB2 and DB3 diffuse cone bipolar cells and flat midget bipolar cells (FMB; Boycott and Wässle, 1991). From electron microscopic serial reconstruction studies, midget bipolar cells in the human and macaque parafovea were known to provide input to a single midget ganglion cell and not to other ganglion cells (Kolb and Dekorver, 1991; Calkins et al., 1994). However, it was uncertain whether midget bipolar cells contact other types of ganglion cells in the peripheral retina.
To determine which bipolar cells were likely to provide input to peripheral OFF parasol cells, the appositions between intracellularly injected parasol cells and bipolar cells labeled by immunofluorescence were studied by using a confocal microscope. Type DB2 bipolar cells were labeled with antibodies to human excitatory amino acid transporter 2 (hEAAT2), and DB3 cells were labeled with anti-calbindin (CaBP; Martin and Grünert, 1992). FMB cells were labeled with anti-recoverin (Milam et al., 1993; Wiechmann and Hammarback, 1993; Grünert et al., 1994; Wässle et al., 1994). Immunofluorescence results suggested that DB3 axon terminals made extensive appositions with OFF parasol cells. A double-label electron microscopic (EM) experiment showed unequivocally that DB3 bipolar cells were presynaptic to OFF parasol ganglion cells. DB2 bipolar cells appeared to make appositions with OFF parasol cells, but FMB cells axons did not make any more appositions with OFF parasol cells than would be expected due to chance.
MATERIALS AND METHODS
Macaque (Macaca mulatta) eyes were enucleated within 10 minutes after the animal had been overdosed with sodium pentobarbital (50–100 mg/kg IV) by other investigators at the conclusion of experiments that did not involve the eyes. Animal protocols were approved by the University of Texas Health Science Center Animal Care and Use Committee. The eyes were transported to the laboratory in glass jars packed in ice for ≈15 minutes and then hemisected. They were put into oxygenated Ames medium (Sigma, St. Louis, MO) at room temperature, and the vitreous humor was removed with fine forceps. The procedure for intracellular injection was the same as described previously (Jacoby et al., 1996). Briefly, the retinas were treated with acridine orange (4 minutes, 10 μM), mounted ganglion cell side up on a fixed-stage, upright microscope, and continuously superfused with Ames medium containing 95% oxygen /5% carbon dioxide. Microelectrodes made from thin-walled borosilicate glass (50–100 MΩ) were filled with 2.5% Lucifer yellow (Molecular Probes, Eugene, OR) and 5% Neurobiotin (Vector Laboratories, Burlingame, CA) in 20 mM 3-[N-morpholino] propanesulfonic acid (MOPS; Sigma), pH 7.6. Large ganglion cell somata were injected first with Lucifer Yellow using negative current pulses (2 Hz, 5–10 nA) until they were confirmed to be parasol cells, and then they were filled with Neurobiotin by switching the polarity of the injecting current to positive for 3–6 minutes. After a patch of parasol cells had been successfully injected, the tissue was fixed for either light or electron microscopy.
Light microscopy
Tissue for light microscopy was fixed overnight in 2% paraformaldehyde in 0.1M phosphate buffer, pH 7.4. The injected cells were visualized by incubating the tissue for 1–2 days in 1:200 indocarbocyanine (Cy3)-streptavidin (Jackson Immunoresearch Laboratories, West Grove, PA) in phosphate-buffered saline (PBS), pH 7.4, with 0.3% Triton X-100. After all the stained cells were verified as parasol cells, the retinas were either processed for immunofluorescence as flat mounts or sectioned at 90 μm with a tissue chopper (Brinkmann, Westbury, NY). The tissue was incubated from 5 to 14 days in primary antisera diluted in PBS with 0.1% sodium azide (PBSA) and 0.3% Triton X-100. Monoclonal antibodies to the calcium-binding protein calbindin D-28k (Sigma), rabbit anti-recoverin (Wiechmann, 1996; Yan and Wiechmann, 1997), and rabbit anti-human excitatory amino acid transporter-2 (hEAAT2; Arriza et al., 1994) were used at 1:1,000. Secondary antibodies made in goat or donkey and conjugated to either fluorescein isothiocyanate (FITC) or indodicarbocyanine (Cy5; Jackson Immunoresearch Laboratories) were used at a dilution of 1:100 in PBSA for 2 days. For the triple-labeling experiment, the primary antibodies (recoverin, hEAAT2, and calbindin) were applied separately, each followed by the appropriate fluorophore-conjugated secondary antibody (Cy3, Cy5, and FITC). Rabbit anti-recoverin was applied first followed by Cy3-donkey anti-rabbit immunoglobulin IgG. After the tissues were rinsed for 2 days to remove as much unbound antibody as possible, rabbit anti-hEAAT2 was applied followed by Cy5-donkey anti-rabbit IgG. Mouse anti-calbindin was applied last followed by FITC-donkey anti-mouse IgG. After the retinas were rinsed, they were mounted on slides, ganglion cell side up in 3:1 glycerol-PBSA with 0.01% paraphenylenediamine (Sigma). Controls were performed by processing tissue as described above but without primary antibodies. No selective labeling was observed.
We examined the retinas in a confocal laser-scanning microscope (Zeiss, Thornwood, NY) with a krypton-argon laser. Excitation was at 488 nm for FITC, 568 nm for Cy3, and 647 nm for Cy5. The emission filters were 515–540 nm for FITC, 590–610 nm for Cy3, and 670–810 nm for Cy5. At the magnifications used, the different wavelengths were aligned within 1 μm. Linear measurements on the images and interactive analysis of the image stacks was performed by using Zeiss LSM software. Photoshop 3.0 (Adobe Systems, Mountain View, CA) was used to process the confocal images. For statistical analysis of data from confocal images, a one-way analysis of variance (ANOVA) with a random effect model was used to compare the mean difference between original and controls. The computation was performed by SAS version 6.12 software (Cary, NC).
Electron microscopy
Retinas for electron microscopy were fixed and processed as described in the previous article (Jacoby and Marshak, 2000). The Neurobiotin in the injected cells was visualized by using avidin-biotin-peroxidase and diamino-benzidine (DAB) with hydrogen peroxide. Retinas were then rinsed and incubated for 7–10 days in 1:1,500 mono-clonal mouse anti-calbindin D-28K (Sigma) in PBS with 0.3% sodium azide, rinsed in PBS, and then incubated for 2 days in 1:100 biotinylated horse anti-mouse IgG (Vector Laboratories) in PBS. Avidin-biotin-peroxidase (1:100) and DAB as described above, were used to visualize the calbindin immunoreactivity. Double-labeled tissue was then treated with osmium tetroxide (1% in PB, 60 minutes) and embedded in Epon as whole mounts on slides, ganglion cell side up. The injected cell was cut out and reembedded for ultrathin sectioning as described previously (Jacoby and Marshak, 2000).
EAAT2 antibody generation
Antibodies were generated to the C-terminal 85 amino acid residues of hEAAT2 by using a glutathione-S-transferase (GST) fusion protein strategy. The complementary deoxyribonucleic acid (cDNA) sequence encoding this region, (KSELDTIDSQHRVEDIEMTKTQSIYDDMKNH-RESNQCVYAAHNSNQCVYAAHNSVIVDECKVTLAAN-GKSADCSVEEEPWKREK) was subcloned into the pGEX-KT vector (Amersham Pharmacia Biotech, Uppsala, Sweden) and verified by DNA sequencing on an ABI 373 automated sequencer. The fusion protein was purified by affinity chromatography on glutathione agarose beads and used to generate polyclonal antibodies in rabbits (Hazelton Research Products, Denver, PA). The reactivity of the antiserum was characterized on Western blots. The fusion protein antigen was also used to confirm the specificity of the antiserum in blocking experiments.
Tissue preparation for Western blotting
Macaque retinas or rat cortical tissues (3-week-old, Sprague-Dawley) were dissected, quick frozen in liquid nitrogen, and stored at −80°C. Frozen tissue was crushed on dry ice, diluted 1:10 w/v in ice-cold buffer containing 2% sodium dodecyl sulfate (SDS), 60 mM Tris, pH 6.8, 100 mM dithiothreitol (DTT), 1 mM ethylenediaminetetraacetic acid (EDTA), pH 8.0, and solubilized by douncing 50 times. A cocktail of protease inhibitors (Complete protease inhibitors; Boehringer Mannheim, Indianapolis, IN) was included in the homogenization buffer (1 tablet per 10 ml). The homogenate was incubated at 100°C for 4 minutes, processed four times each through 20- and 26-gauge needles, spun at 10,000 × g at 4°C, and the supernatant was frozen at −20°C.
Oocyte membrane preparation
Oocytes were injected with 50 nl of either hEAAT2 RNA or water and assayed for transport activity 48–72 hours after injection. hEAAT2-expressing oocytes, voltage clamped at −60 mV, elicited a current of 90 nA when assayed with 300 μM glutamate. Oocytes were homogenized by pipetting in an ice-cold lysis buffer containing 7.5 mM sodium phosphate, 1 mM EDTA, 20 μg/ml phenyl-methylsulfonyl fluoride (PMSF), 1 μg/ml leupeptin, 1 μg/ml aprotinin, and 1 μg/ml pepstatin. Homogenized oocytes were spun 750 × g at 4°C for 5 minutes, and the supernatant was removed to a new tube and then spun at 16,000 × g after which the supernatant was discarded (Preston et al., 1993). The pellet was then solubilized in the same lysis buffer containing 2% SDS and denatured at 100°C for 3 minutes. Oocyte membrane homogenates were stored at −20°C for up to 3 months.
Western blotting
Protein homogenates denatured at 100°C for 3 minutes in SDS-polyacrylamide gel electrophoresis (PAGE) loading buffer containing 100mM DTT were fractionated on an 8% gel under denaturing conditions then transferred to Immobilon P (Millipore, Bedford, MA) for 16 hours at 38 mA in a 10% MeOH transfer buffer. Membranes were blocked with 5% powdered milk, 2% BSA, 150 mM NaCl, 10 mM Tris, pH 7.4, and then incubated with anti-hEAAT2 (1: 5,000) or preincubated overnight with either GST (0.7 μg/ml) or GST-hEAAT2 (0.7 μg/ml). Blots were then processed as described in Eliasof et al. (1998).
RESULTS
Western blotting analyses confirmed the specificity of the hEAAT2 antibody used in these studies; hEAAT2 RNA-injected oocytes expressed a 73 kDa protein species that was not detected by the serum in control water-injected oocytes. Binding of anti-hEAAT2 was blocked by preabsorption with the fusion protein (data not shown). A similar protein of ≈73 kDa is observed in rat cortex, consistent with results from previous studies using antibodies to GLT-1, the rat homolog of hEAAT2, in rat brain (Lehre et al., 1995; Rothstein et al., 1994; Danbolt et al., 1992), and in rat retina (Rauen et al., 1996). In monkey retina two bands were observed, one at ≈73 kDa and a second at ≈37 kDa (Fig. 1); both bands were abolished by preabsorption of the serum with the fusion protein. The lower molecular weight band at 37 kDa was also present in human retina and appears to represent a proteolytic fragment of hEAAT2 (data not shown). Others also have identified a major 73 kDa protein species and a second lower molecular weight band at 37 kDa in rat cortex using a different C-terminally directed antibody against GLT-1 (Lehre et al., 1995).
Fig. 1.

Western blot of tissue homogenates showing the proteins recognized by the anti-hEAAT2 serum. The blot shows protein extracts prepared from water-injected oocytes (lane 1) and hEAAT2-expressing oocytes (lane 2), 1.5 oocytes/lane; rat cortex (0.3 μg protein) (lane 3); monkey retina (6 μg protein) (lanes 4 and 5). The samples from monkey retina were stained with anti-hEAAT2 preincubated with either GST (lane 4) or GST-hEAAT2 (lane 5). hEAAT2 RNA-injected cells express a 73 kDA protein species that reacts with the antiserum. Although monkey retina shows two bands of ≈73 kDa and ≈37 kDa, both bands are effectively competed by preincubation with the hEAAT2-GST fusion protein.
DB3 diffuse cone bipolar cells were labeled with antibodies to calbindin D28k (CaBP) in macaque retinas. They have characteristic, varicose axon terminals consisting of axonal swellings separated by narrow connecting regions. Figure 2 shows a camera lucida drawing of DB3 axons from a whole mount immunolabeled for calbindin. The descending axons coming from the cell bodies (black dots) typically branched two to three times (average, 2.4) before any varicosities occurred, and each subsequently branched one or two more times. The second- and third-order branches almost always occurred at varicosities (arrows). Like Boycott and Wässle (1991), we found that many DB3 axons appeared to contact neighboring axons, and this made it difficult to distinguish individual axon terminals. On closer examination, however, there were always points on the labeled axon terminals where two varicosities were apposed without any narrow connecting region between them. These appositions typically occurred between the tips of the axon terminals or between a tip and the side of a neighboring varicosity (arrowheads). These were considered the boundaries between neighboring cells, because in the preceding article (Jacoby and Marshak, 2000), they were found to be sites of gap junctions between DB3 cells. With use of this criterion, each DB3 cell contacted 1–4 neighboring cells (average, 2.4) by way of 1–7 (average, 3.4) such appositions, giving an average of 1.4 appositions between neighboring cells. There were 19–52 (average, 33 ± 4.7) varicosities per DB3 cell (n = 13) in this area of retina. The eccentricity of this area was estimated from the density of cones; there were 123 cones in a square area 200μm on a side or a cone density of 3,075/mm2, which corresponds to an eccentricity of 11–12 mm (Packer et al., 1989).
Fig. 2.

Camera lucida drawing of DB3 bipolar cell axons from a whole-mounted macaque retina. Individual DB3 axons terminals were difficult to distinguish, because neighboring axons often contacted each other (arrowheads). These are probably sites of gap junctions between DB3 cells. Second- and third-order axonal branch points typically occurred at varicosities (arrows). Scale bar = 100 μm.
Despite the frequent appositions between neighboring DB3 axon terminals, there was little overlap between individual terminals, a finding suggesting that the axons have distinct territories, like other mammalian bipolar cells (Cohen and Sterling, 1990; Boycott and Wässle, 1991; Mills and Massey, 1992; Massey and Mills, 1996). The tiling pattern was not completely homogeneous, however. There were irregular gaps in the matrix that were larger than the spaces between other types of bipolar cell axons in primates. Other bipolar cell axons are thought to tile the retina in a space-filling manner (Boycott and Wässle, 1991). Calbindin-IR bipolar cells and a population of wide-field bipolar cells in the rabbit retina, however, exhibit occasional gaps in the axonal matrix similar to those of DB3 axons (Jeon and Masland, 1995; Massey and Mills, 1996). Both of these types of rabbit bipolar cells also have axons that contact neighboring terminals, but unlike DB3 cells, they ramify in the inner IPL or ON sublamina. To estimate the coverage of DB3 axons, axonal areas were measured and multiplied by the local DB3 cell density. The average DB3 axonal area in Figure 2 was 2,129 ± 460 μm2, and the density was 360 cells/mm2, giving a coverage factor of 0.77.
Double-label EM
Double-label experiments were performed to determine whether DB3 axons and OFF parasol cell dendrites were in the same layer of the macaque IPL, as suggested by Boycott and Wässle (1991) and Martin and Grünert (1992). Parasol cells were intracellularly injected, and vertical sections containing labeled parasol cell dendrites were labeled with anti-CaBP. The DB3 axons ramified in a narrow stratum of the IPL at a depth of 30–45%, taking 0% to be the outer edge and 100% the inner edge of the IPL. We found that the beaded axons of DB3 cells traveled in the same narrow stratum of the IPL as dendrites from Neurobiotin-filled OFF parasol cells, and there were extensive appositions between them, as in marmoset retina (Ghosh et al., 1997).
To determine whether peripheral OFF parasol ganglion cells receive synapses from DB3 bipolar cells, we analyzed double-labeled material in the electron microscope. Figure 3 shows a lightly labeled CaBP-IR DB3 axon presynaptic to two, more darkly labeled OFF parasol cell dendrites at two different ribbons (arrowheads); this arrangement was seen twice in our survey of this material. The parasol cell was more densely labeled than the DB3 axons, presumably because it was iontophoretically filled with Neurobiotin and reacted twice with DAB. Even though lightly labeled, the CaBP-IR axons could be distinguished from unlabeled bipolar cells because of the reaction product around the synaptic vesicles and synaptic ribbons. This is illustrated at a higher magnification in Figure 4 where another DB3 axon terminal is making a ribbon synapse onto a parasol cell dendrite. For comparison, an unlabeled bipolar cell can be seen making a ribbon synapse in the upper right corner of Figure 4. The double-labeled material was not analyzed quantitatively, but it is our impression that synapses occur at nearly every apposition between labeled DB3 and OFF parasol cells.
Fig. 3.

A DB3 bipolar cell axon (DB) is presynaptic to two OFF parasol ganglion cell dendrites (G) at ribbon synapses (arrowheads). The DB3 axons were labeled with anti-CaBP, and the parasol cell was filled with Neurobiotin. Scale bar = 0.5 μm.
Fig. 4.

A DB3 bipolar cell (DB) makes a synapse (arrowhead) onto an OFF parasol ganglion cell dendrite (G). The HRP reaction product in the CaBP-IR DB3 axon creates a “fuzzy” appearance around synaptic vesicles. Note the unlabeled bipolar cell ribbon synapse in the upper right corner. Scale bar = 0.5 μm.
Appositions between DB3 bipolar cells and parasol cells
Double-label electron microscopy provides direct evidence of synapses between immunolabeled DB3 bipolar cells and injected OFF parasol cells, but the technique is very time-consuming and technically difficult. It would be advantageous, therefore, to be able to estimate the probability that two sets of processes form synapses using light microscopy. The method we chose was to count the number of appositions, or regions where the processes are adjacent to one another, and compare this with the expected number of randomly occurring appositions between costratified processes. In the retina (Jacoby and Marshak, 2000) and elsewhere in the nervous system, approximately half of the appositions were found to be sites of synaptic contact (Mann et al., 1997). Therefore, we assumed that processes that made more appositions with parasol cells than expected by chance were likely to be presynaptic and that processes that made no more appositions than expected by chance were not likely to be presynaptic. We tested this method first on DB3-OFF parasol cell appositions. Both sets of processes ran in a plane tangential to the retinal surface, making quantitative analysis of their spatial relationship difficult using vertical sections (Fig. 5). Therefore, flat-mounted material was used for the remaining experiments.
Fig. 5.

In this double-labeled vertical section, CaBP-IR DB3 axons (green) ramify narrowly in the same layer of the IPL as dendrites from a filled OFF parasol cell (red, upper band). The lower red band contains dendrites from a neighboring ON parasol cell that was also filled. Also shown are a labeled DB3 cell body (upper right) and a filled parasol cell body (lower right). Scale bar = 10 μm.
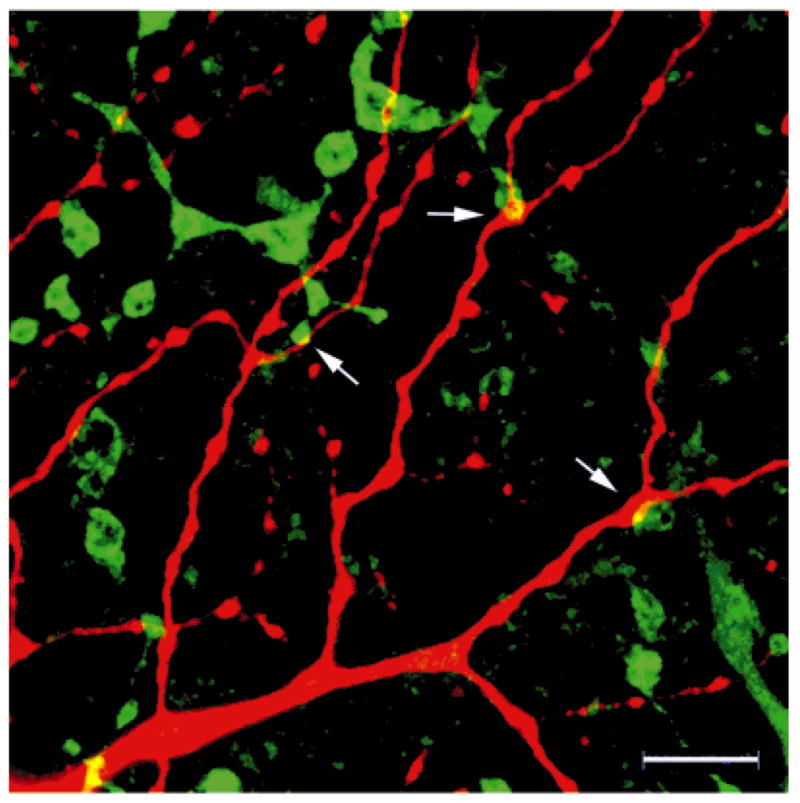
When the two sets of processes are densely distributed, like DB3 axons and parasol cell dendrites, a certain number of appositions are expected to occur by chance, whether there are synapses between the adjacent processes or not. It is essential to distinguish these random appositions from selective appositions, which are likely to be sites of synapses. To determine whether there were more appositions between a given pair of processes than would be expected because of chance, we used a method adapted from Vardi et al. (1989) and Massey et al. (1996) to compare the number of appositions in images, such as Figure 6, with rotated control images of the same area (Jacoby et al., 1996). Figure 6 represents a reconstructed stack of optical sections through the distal half of the IPL containing parasol cell dendrites (red) and DB3 axons (green). Virtually all the ribbon synapses from DB3 cells occur in the varicosities, or axonal swellings, where the diameter of the axon is >0.4 μm according to our EM analysis (Jacoby and Marshak, 2000). It is not known where synapses are localized along parasol cell dendrites, however, and therefore, appositions (arrows) were counted whenever a DB3 axonal varicosity was adjacent to any part of the parasol dendrite. Appositions were not counted solely from reconstructed images, such as Figure 6, because apparent appositions between two processes in the x-y plane may, in fact, be separated along the z-axis and artifactually superimposed. Instead, appositions were counted interactively by scanning through the stacks of serial, optical sections. Appositions were only counted if the two processes were in the same or in adjacent sections. Because the z-axis resolution of the confocal microscope was typically 0.6 μm and the step size between sections was usually 0.4 μm, two processes in adjacent sections could be separated by as much as 1 μm. With use of these criteria, all of the apparent appositions illustrated in Figure 6 were counted. Control images were created by rotating one of the two fluorescence signals relative to the other in the x-y axis. Figure 7 shows an example of a control image in which the Neurobiotin-Cy3 channel (red) has been rotated 90° relative to the CaBP-IR-Cy5 channel (green), which is in the same orientation as Figure 6. The arrows point out random appositions between the two processes. Appositions were counted in control images after 90, 120, and 180° of rotation for each area. The control images had 37% fewer appositions, on average, than the original images (Table 1). Therefore, DB3 axons make significantly more appositions with OFF parasol cells than would be expected from chance (one-wayANOVA, P < 0.001).
Fig. 6.

There were extensive appositions (arrows) between OFF parasol ganglion cell dendrites (red) and DB3 bipolar cell axons (green). This confocal micrograph represents a reconstructed stack of optical sections from the distal half of the IPL. Scale bar = 10 μm.
Fig. 7.
In this control image for Figure 6, the OFF parasol cell dendrites (red channel) have been rotated 90° relative to the DB3 axons (green channel), which are in the same orientation as Figure 6. Apparent appositions between the two sets of processes (arrows) represent random interactions. Scale bar = 10 μm.
TABLE 1.
Bipolar Cell Appositions With Parasol Cells1
| Control appositions/original appositions (±SD)
|
||||
|---|---|---|---|---|
| 90° | 180° | 270° | Average | |
| DB3/OFF Parasol | 0.60 ±0.19 | 0.62 ±0.11 | 0.65 ±0.15 | 0.63 ±0.15 |
| DB3/ON Parasol | 0.86 ±0.19 | 1.03 ±0.1 | 0.88 ±0.32 | 0.93 ±0.22 |
| FMB/OFF Parasol | 1.06 ±0.22 | 1.05 ±0.13 | 1.04 ±0.16 | 1.05 ±0.17 |
For each double-labeled area analyzed in the confocal microscope, the appositions between the two sets of processes were counted in the original image and in three different control images with one of the two labels rotated relative to the other (90°, 180°, and 270°) to estimate the number of appositions expected because of chance. Only appositions between DB3 axons and OFF parasol cells occurred more frequently than expected due to chance. SD, standard deviation; DB, diffuse bipolar; FMB, flat midget bipolar.
It was also important to control for the influence of vertically oriented Müller cell processes and ON bipolar cell axons running through the IPL. These processes might limit the number of paths available for processes ramifying in the outer half of the IPL, and this could explain why there are more appositions in the original images than there are in control images. The situation could be likened to people walking through a thick forest. They all must walk between the trees, and therefore, the likelihood of one person walking the same path as another person is higher than if the trees were not there. To examine the effect of vertically oriented elements, appositions were counted in reconstructed images that contained dendrites from an injected ON parasol cell, ramifying in sublamina b, and the DB3 axons from the same area, which ramify in sublamina a. Although these two sets of processes were in the same field (x-y plane), there were no actual appositions between them because they were separated along the z-axis, in different focal planes. However, if vertically oriented processes were responsible for our results from OFF parasol cells and DB3 axons in sublamina a of the IPL, then processes in sublamina b should also be limited to the same paths because of the columnar Müller cells and descending axons traveling through the IPL. In that case, when ON parasol cell dendrites and DB3 axons are overlaid into the same image and viewed in the flat-mount orientation (for example, see Figs. 6–8), there should also be more apparent appositions between them compared with control rotations, because both sets of processes would be confined to the same pathways. The number of appositions in original images between ON parasol cells and DB3 axons, however, was no different from the number in control images (Table 1; one-way ANOVA, P = 0.6). Therefore, vertically oriented processes were not responsible for the selective appositions between DB3 bipolar cells and OFF parasol cells.
Fig. 8.

Appositions (arrows) between OFF parasol ganglion cell dendrites (red) and FMB axons (green). Some apparent appositions (arrowhead) were separated along the z-axis and were therefore not counted. Scale bar = 10 μm.
Some DB3 varicosities within the dendritic field of an injected parasol cell were not adjacent to any of the parasol cell’s dendrites; one possible explanation is that they made appositions with other, unlabeled parasol cells. All of the areas analyzed contained dendrites from a single injected OFF parasol cell, but because the coverage factor for parasol cells is 3 (Grünert et al., 1993; Dacey, 1994), every point on the retina is covered by dendrites from three different parasol cells. Thus, the areas that were analyzed in these experiments actually have 3 times as many parasol cell dendrites than are visible in the confocal micrographs. On average, 55% of the DB3 axonal varicosities in each area were apposed to parasol cell dendrites. Taking into account the coverage factor for parasol cell dendrites, there would be 1.65 parasol cell appositions per DB3 axonal varicosity. Even if only half of the neuronal appositions seen in the light and electron microscope represent synapses (Mann et al., 1997; Jacoby and Marshak, 2000), a large majority of the DB3 varicosities would make synapses onto OFF parasol cell dendrites.
Appositions between flat midget bipolar cells and parasol cells
Because flat midget bipolar cell (FMB) axons ramify broadly in the distal half of the IPL at 10–40% depth, the lower portions of their axons overlap with OFF parasol cell dendrites and might provide input (Boycott and Wässle, 1991). In the central retinas of humans (Kolb and Dekorver, 1991) and macaques (Calkins et al., 1994), midget bipolar cells contact only midget ganglion cells. However, in peripheral retina it is possible that parasol ganglion cells are also contacted. To examine whether there are appositions between FMB cells and peripheral parasol cells, FMB cells were labeled by using antiserum to the calcium-binding protein recoverin (Milam et al., 1993; Wässle et al., 1994; Wiechmann, 1996; Yan and Wiechmann, 1997). In far peripheral retina, we found that the FMB axon plexus was relatively narrow, as described previously (Wässle et al., 1994). Most of the FMB axon terminals ramified distal to OFF parasol dendrites, precluding contact between them. However, some were found among the OFF parasol cell dendrites, and a few were found even more proximally. To determine whether there were significantly more appositions between FMB axons and OFF parasol cell dendrites than expected by chance, double-labeled flat mounts were analyzed by using the same technique as was used for CaBP-IR axons. Figure 8 shows a reconstructed image from a stack of optical sections containing dendrites from an injected OFF parasol cell (red) and recoverin-IR FMB axon terminals (green). Arrows indicate actual appositions, and arrowheads indicate artifactual appositions where the processes were separated by more than one section in the z-axis. In reconstructed stacks, artifactual appositions were particularly common for FMB cells because of the broad stratification of their axons. There were no differences in the number of appositions between original images, such as Figure 8, and rotated control images (Table 1; one-way ANOVA, P = 0.63). There were no more appositions between FMB axons and OFF parasol cells than would be expected because of chance, and therefore, it is unlikely that flat midget bipolar cells provide significant input to peripheral OFF parasol cells.
DB2 bipolar cells
Because axons of DB2 diffuse bipolar cells ramify throughout much of the outer half of the IPL (sublamina a), they are also able to make appositions with OFF parasol ganglion cells. DB2 bipolar cells and flat midget bipolar cells can both be labeled with antiserum to a glutamate transporter, isolated from rat brain, called GLT-1 (Rauen and Kanner, 1994; Grünert et al., 1994). In this study, we used an antiserum to the homolog, human excitatory amino acid transporter 2 (hEAAT2).
It was important to determine first whether anti-hEAAT2 also labeled DB2 cone bipolar cells and FMB cells. Single-labeled vertical sections from midperipheral retina were reacted with anti-hEAAT2 and analyzed in the confocal microscope. Because of the high density of labeled axons, it was difficult to distinguish between axon terminals of DB2 bipolar cells and FMB axon terminals using anti-hEAAT2, alone. To determine whether both DB2 and FMB axons were labeled with anti-hEAAT2, vertical sections were labeled with both anti-recoverin and anti-hEAAT2 (Fig. 9). This would normally not be possible because both antibodies had been raised in rabbits, but because recoverin-IR is present throughout the cytoplasm (Fig. 8) and hEAAT2-IR is limited to the vicinity of the plasma membrane (Fig. 9a,c), there is a built-in control for nonspecific staining. For example, if the fluorophore used to visualize anti-hEAAT2 were found throughout the cytoplasm, then it is cross-reacting with the recoverin antibody. In our material, however, the cross-reactivity was minimal. As shown in Figure 9a,b, recoverin-IR (green) was found in the cytoplasm of axonal varicosities at the top of the IPL (arrows), where FMB axons ramify (Boycott and Wässle, 1991); hEAAT2-IR (red) was localized to the membranes of axonal varicosities throughout the distal half of the IPL (Fig. 9a,c; arrowheads). All of the recoverin-IR varicosities were double-labeled, but most of the smaller hEAAT2-IR varicosities closer to the middle of the IPL were not recoverin-IR. These hEAAT2-IR-recoverin-negative varicosities were broadly stratified like DB2 axons (Boycott and Wässle, 1991). DB3 axons (blue) labeled with anti-CaBP were also included in Figure 9a–c to show the relative depths of stratification of the three bipolar cell types. Thus, antisera to hEAAT2 appear to label FMB and DB2 bipolar cells, as do antisera to GLT-1 (Grünert et al., 1994).
Fig. 9.

a: This triple-labeled vertical section contains hEAAT2-IR (red), recoverin-IR (green), and CaBP-IR (blue). In the IPL, anti-hEAAT2 labels the plasma membranes of bipolar cell axon varicosities. b: Some of these, mostly close to the top of the IPL, are FMB axons, which are also recoverin-IR throughout their cytoplasm (arrows). c: The other hEAAT-IR axon varicosities, which mostly lie below the FMB axons, are not recoverin-IR (arrowheads). This suggests that both FMB cells and DB2 bipolar cell axons are labeled with antisera to hEAAT2, but only FMB cells are labeled with antisera to recoverin. The CaBP-IR, DB3 axons (blue) are not hEAAT2-IR or recoverin-IR. Scale bar = 10 μm.
In our whole mounts, however, hEAAT 2-immunoreactive processes were very dense, and it was not possible to discern the boundaries between individual bipolar cell axon terminals or to distinguish between DB2 axons and FMB axons. Therefore, it was not possible to count the appositions between DB2 bipolar cells and OFF parasol cells or to determine whether they were selective by the technique used earlier. There appeared to be many more appositions between hEAAT 2-IR axons and OFF parasol cells than with recoverin-IR FMB axons and OFF parasol cells in vertical sections, however. This finding predicts that DB2 bipolar cells provide input to OFF parasol cells, as reported in a previous study of unlabeled tissue from central retina (Calkins, 1999).
Convergence onto parasol cells
To determine how many cones and DB3 bipolar cells would be expected to provide input to parasol cells, double-labeled flat mounts were optically sectioned at the level of the parasol cell dendrites, the DB3 cell bodies, and the cone inner segments. DB3 cell bodies and the cone inner segments overlying two parasol cell dendritic fields were counted. The eccentricity was estimated by using the local cone density and the diameter of the parasol cells’ dendritic fields. Cell 1 had a dendritic field diameter of 200 μm, and the overlying cone density was 7,448/mm2. From Watanabe and Rodieck (1989) and Packer et al. (1989), the eccentricity is ≈6 mm. Cell 2 had a dendritic field diameter of 290 μm and a local cone density of 5,667/mm2, and therefore, the eccentricity is ≈10 mm. The number of cones that fell inside the area of a parasol cell dendritic field was 240 for cell 1 and 281 for cell 2, and the number including those on the edge of the field was 250 for cell 1 and 296 for cell 2. This finding agrees with Goodchild et al. (1996) who showed that the cone convergence onto macaque parasol cells changed very little, remaining around 200 at eccentricities >6 mm. There were 43 DB3 bipolar cells contained entirely within the dendritic field of parasol cell 1 and 53 for cell 2. Including the DB3 cells on the edge of the dendritic field, there were 48 DB3 cells converging onto cell 1 and 55 DB3 cells onto cell 2. With 50 DB3 cells converging onto a typical parasol cell in midperipheral retina, there would be 50 × 33 axonal varicosities/DB3 cell = 1,650 DB3 axonal varicosities overlying the parasol cell dendrites. Because 55% of the DB3 varicosities in each area contact a single parasol cell, each parasol cell would be expected to make appositions with 908 (0.55 × 1,650) DB3 varicosities in midperipheral retina. Because parasol cells have a coverage factor of 3, however, there would be 1.65 parasol cell appositions per DB3 varicosity, as described earlier. Also, there are, at most, only 1.12 synapses per DB3 varicosity available for parasol cells (Jacoby and Marshak, 2000). Therefore, at the upper limit, there could be synapses at 68% (1.12/1.65), or 617 of the 908 DB3/ parasol cell appositions. If only 47% of the appositions represent synapses, as we demonstrated for all processes that appose DB3 axons (Jacoby and Marshak, 2000), then each parasol cell would receive 427 synapses from DB3 cells. Depending on how many other types of ganglion cells receive input from DB3 cells, parasol cells would receive from 427 to 617 synapses from 50 DB3 bipolar cells (summarized in Fig. 10).
Fig. 10.

Convergence onto a single OFF parasol cell in mid-peripheral retina. The parasol cell receives input from ≈50 DB3 bipolar cells and 250 cones. If each DB3 axonal varicosity that makes an apposition with an OFF parasol cell makes at least 1 synapse, then the 50 DB3 cells could provide 500 synapses onto the parasol cell.
DISCUSSION
Axons from three types of bipolar cells (FMB, DB2, and DB3) ramify in the same narrow stratum of the IPL as dendrites from OFF parasol ganglion cells. With use of double-label EM, we found that DB3 bipolars made synapses onto OFF parasol cells, and by using double-label confocal microscopy, DB3 bipolars made significantly more appositions with parasol cell dendrites than would be expected because of chance. These findings predict that other presynaptic cells would also make more appositions then expected by chance. FMB axons labeled with anti-recoverin did not make any more appositions with parasol cells than would be expected by chance, however. Therefore, we concluded that FMB cells do not provide significant input to peripheral OFF parasol cells. One other bipolar cell input to parasol ganglion cells was studied qualitatively. DB2 bipolar cells were labeled with anti-hEAAT2, and their axons made more appositions with OFF parasol cells than FMB cells did, a finding suggesting that they provide input, as well.
Bipolar cell inputs to parasol ganglion cells
A summary diagram of the proposed bipolar cell inputs to OFF parasol cells is shown in Figure 11. In a recent study, it was reported that narrowly stratifying bipolar cells resembling DB3 cells provided 71% of the bipolar cell input to a parasol ganglion cell in parafoveal retina (Calkins et al., 1995; Calkins, 1999). The remainder of the bipolar cell input (29%) came from broadly stratifying bipolar cells that resembled DB2 cells. Synapses from FMB cells onto parasol cells have not been observed in central retina (Kolb and DeKorver, 1991; Calkins et al., 1994). Thus, our results in peripheral retina are consistent with the hypothesis that parasol ganglion cells receive input from two populations of diffuse bipolar cells, DB2 and DB3 cells, at all eccentricities.
Fig. 11.

Summary diagram of proposed synapses from bipolar cells to parasol ganglion cells. Putative OFF cone bipolar cell types DB2 (DB2 BC) and DB3 (DB3 BC) receive mostly basal synapses from all of the cones in their dendritic field. DB3 bipolar cells make the majority of the bipolar cell synapses onto OFF parasol cells (OFF M GC), and they make homologous gap junctions with neighboring DB3 cells (crosshatched densities). DB2 bipolar cells provide the remainder of bipolar cell input to OFF parasol cells. C, cone; FMB, flat midget bipolar cell.
On the basis of confocal microscopy, we found that parasol cells from the midperipheral retina received ≈500 synapses from 43–55 DB3 bipolar cells. In the central retina, however, a serially reconstructed parasol cell received 60 synapses from 4 DB3 cells (Calkins et al., 1995; Calkins, 1999). The same foveal parasol cell received 25 synapses from 3 DB2 bipolar cells, for a total of 85 bipolar cell synapses. If peripheral parasol cells receive the same proportion of DB2 and DB3 inputs (i.e., 30% and 70%), they should receive ≈200 synapses from 38 DB2 bipolar cells, giving a total of roughly 700 synapses from all types of bipolar cells.
ON parasol ganglion cells from the peripheral baboon retina received 20% of their synapses from bipolar cells, but the remaining 80% were from amacrine cells (Jacoby et al., 1996). If we assume that OFF parasol cells have the same proportion of bipolar and amacrine input as ON cells, then midperipheral parasol cells could receive >2,800 synapses from amacrine cells, in addition to the 700 from bipolar cells, giving approximately 3,500 input synapses altogether. Kolb and Nelson (1993) estimated that a cat alpha ganglion cell with a dendritic field diameter of ≈800 μm received 6,150–9,500 synapses, and a beta cell with a dendritic field diameter of 62 μm received ≈1,000 synapses. Because the parasol cells analyzed here had dendritic field diameters of 200 and 290 μm, the results from cat retina had to be scaled to compare with our data. The alpha cell was roughly 3 times larger in diameter than our parasol cell, and therefore, the dendritic field area would be 9 times larger. Because the density of synapses onto alpha ganglion cells per unit area of dendritic field (retinal density) decreases only slightly with eccentricity (Kier et al., 1995), we would expect ≈940 synapses onto an alpha cell the size of our parasol cells. These results suggest that the density of synapses onto parasol cells is significantly higher than for cat alpha cells. Correspondingly, the dendritic field area of the beta cell from Kolb and Nelson (1993) was 16 times smaller than those of our parasol cells. The retinal density of synapses onto beta cells, however, decreases by a factor of ≈5 over this 16-fold increase in dendritic field area (Kier et al., 1995), so that we would expect only a 3-fold increase in the number of synapses onto a beta cell the size of our parasol cells. This gives an estimate of 3,000 synapses, which is about 15% less than our estimate for the parasol cells. In summary, the density of synapses onto parasol ganglion cells might be as much as 1.5 times higher than for cat beta cells, and as much as 4 times that of cat alpha cells.
Comparisons with other species
On the basis of similarities in axonal morphology and stratification, cone bipolar cells from other mammals appear to be similar to primate DB3 and DB2 bipolar cells. Those with narrowly stratifying axons in sublamina a of the IPL, like DB3, include types Cb2 (Kolb et al., 1981), CBa1 (cell 14) and CBa4 (McGuire et al., 1984) from cat retina, types ma2 (Famiglietti, 1981) and DAPI-Ba3 (Mills and Massey, 1992) from rabbit retina, and type CB5 from rat retina (Euler and Wässle, 1995). Cat Cb2 bipolar cells hyperpolarize to light increments in their receptive field centers (Nelson and Kolb, 1983), and DB3 cells would be expected to have similar light responses. Cone bipolar cells with broadly stratifying axons in sublamina a, like DB2, include types Cb1 (Kolb et al., 1981) and CBa2 (McGuire et al., 1984) from cat, DAPI-Ba2 cells from rabbit (Mills and Massey, 1992), and type CB3 bipolar cells from rat (Euler and Wässle, 1995). Thus, all mammals studied to date have multiple types of cone bipolar cells, even those considered to have rod-dominated vision. This suggests that there are functional requirements for multiple diffuse bipolar cell pathways between cones and ganglion cells and that these are conserved in evolution.
Cat homologs of DB2 and DB3 bipolar cells would be expected to provide input to ganglion cells homologous to parasol cells. In many respects, alpha ganglion cells from cats are similar to parasol ganglion cells (Peichl, 1991; Rodieck et al., 1993; Jacoby et al., 1996). Both are among the largest ganglion cells in their respective retinas, have narrowly stratified dendrites, and show tracer coupling to similar types of wide-field, axon-bearing amacrine cells. OFF alpha ganglion cells receive all of their bipolar cell input from cb2 bipolar cells (Kolb and Nelson, 1993). DB3 bipolar cells provide most of the bipolar cell input to OFF parasol cells (Calkins, 1999), and these results are consistent with homology between parasol cells and alpha cells. However, parasol cells are also similar to cat beta ganglion cells in absolute size and in dendritic morphology. OFF beta cells receive input from both cb1 and cb2 bipolar cells (Kolb and Nelson, 1993), and McGuire et al. (1986) found that OFF beta cells received 66% of their bipolar cell input from CBa1 bipolar cells and the remainder from CBa2 cells. This ratio is similar to that for parasol cells, which receive 71% of their bipolar cell input from DB3 cells and the remainder from DB2 cells (Calkins et al., 1995; Calkins, 1999). Although these results do not indicate which cat ganglion cells are homologous to parasol cells, they do support homology between primate DB3 bipolar cells and cat cb2-CBa1 bipolar cells, and between primate DB2 cells and cat cb1-CBa2 cells.
Acknowledgments
Grant sponsor: National Eye Institute; Grant numbers: EY06472, EY07024, EY10608, and EY81001; Grant sponsor: National Institute of Mental Health; Grant number: MH10957; Grant sponsor: National Institute of Neurological Disorders and Stroke; Grant number: NS33273.
We thank Mrs. Lillemor Krosby for excellent technical assistance, Dr. Alice Chuang for help with the statistical analysis, and Prof. Brian Boycott for his helpful comments on the manuscript.
LITERATURE CITED
- Arriza JL, Fairman WA, Wadiche JI, Murdoch GH, Kavanaugh MP, Amara SG. Functional comparisons of three glutamate transporter subtypes cloned from human motor cortex. J Neurosci. 1994;14:5559–5569. doi: 10.1523/JNEUROSCI.14-09-05559.1994. [DOI] [PMC free article] [PubMed] [Google Scholar]
- Boycott BB, Wässle H. Morphological classification of bipolar cells of the primate retina. Eur J Neurosci. 1991;3:1069–1088. doi: 10.1111/j.1460-9568.1991.tb00043.x. [DOI] [PubMed] [Google Scholar]
- Calkins DJ, Schein SJ, Tsukamoto Y, Sterling P. M and L cones in macaque fovea connect to midget ganglion cells by different numbers of excitatory synapses. Nature. 1994;371:70–72. doi: 10.1038/371070a0. [DOI] [PubMed] [Google Scholar]
- Calkins D, Schein S, Sterling P. Cone inputs to three types of non-midget ganglion cell in macaque fovea. Invest Ophthalmol Vis Sci. 1995;36:S4. [Google Scholar]
- Calkins DJ. Synaptic organization of cone pathways in the primate retina. In: Gegenfurtner K, Sharpe L, editors. Color vision: from genes to perception. New York: Cambridge University Press; 1999. [Google Scholar]
- Cohen E, Sterling P. Demonstration of cell types among cone bipolar neurons of cat retina. Proc R Soc Lond [Biol] 1990;330:305–21. doi: 10.1098/rstb.1990.0201. [DOI] [PubMed] [Google Scholar]
- Dacey DM, Lee BB. The “blue-on” opponent pathway in primate retina originates from a distinct bistratified ganglion cell type. Nature. 1994;367:731–735. doi: 10.1038/367731a0. [DOI] [PubMed] [Google Scholar]
- Dacey DM. Physiology, morphology and spatial densities of identified ganglion cell types in primate retina. Ciba Foundation Symposium; 1994. pp. 12–28. discussion 28–34, 63–70. [DOI] [PubMed] [Google Scholar]
- Danbolt NC, Storm-Mathisen J, Kanner BI. An (Na+ + K+) coupled L-glutamate transporter purified from rat brain is located in glial cell processes. Neuroscience. 1992;15:295–310. doi: 10.1016/0306-4522(92)90316-t. [DOI] [PubMed] [Google Scholar]
- Elisof S, Arriza JL, Leighton BH, Kavanaugh MP, Amara SG. Excitatory amino acid transporters of the salamander retina: identification, localization, and function. J Neurosci. 1998;18:698–712. doi: 10.1523/JNEUROSCI.18-02-00698.1998. [DOI] [PMC free article] [PubMed] [Google Scholar]
- Euler T, Wässle H. Immunocytochemical identification of cone bipolar cells in the rat retina. J Comp Neurol. 1995;361:461–478. doi: 10.1002/cne.903610310. [DOI] [PubMed] [Google Scholar]
- Famiglietti EV., Jr Functional architecture of cone bipolar cells in mammalian retina. Vision Res. 1981;21:1559–1563. doi: 10.1016/0042-6989(81)90032-8. [DOI] [PubMed] [Google Scholar]
- Ghosh KK, Martin PR, Grünert U. Morphological analysis of the blue cone pathway in the retina of a new world monkey, the marmoset Callithrix jacchus. J Comp Neurol. 1997;379:211–225. [PubMed] [Google Scholar]
- Goodchild AK, Ghosh KK, Martin PR. Comparison of photoreceptor spatial density and ganglion cell morphology in the retina of human, macaque monkey, cat, and the marmoset Callithrix jacchus. J Comp Neurol. 1996;366:55–75. doi: 10.1002/(SICI)1096-9861(19960226)366:1<55::AID-CNE5>3.0.CO;2-J. [DOI] [PubMed] [Google Scholar]
- Grünert U, Greferath U, Boycott BB, Wässle H. Parasol (P alpha) ganglion-cells of the primate fovea: immunocytochemical staining with antibodies against GABAA-receptors. Vision Res. 1993;33:1–14. doi: 10.1016/0042-6989(93)90052-x. [DOI] [PubMed] [Google Scholar]
- Grünert U, Martin PR, Wässle H. Immunocytochemical analysis of bipolar cells in the macaque monkey retina. J Comp Neurol. 1994;348:607–627. doi: 10.1002/cne.903480410. [DOI] [PubMed] [Google Scholar]
- Jacoby R, Stafford D, Kouyama N, Marshak D. Synaptic inputs to ON parasol ganglion cells in the primate retina. J Neurosci. 1996;16:8041–8056. doi: 10.1523/JNEUROSCI.16-24-08041.1996. [DOI] [PMC free article] [PubMed] [Google Scholar]
- Jacoby RA, Marshak DW. Synaptic connections of DB3 diffuse bipolar cell axons in macaque retina. J Comp Neurol. 2000;416:19–29. doi: 10.1002/(sici)1096-9861(20000103)416:1<19::aid-cne3>3.0.co;2-h. [DOI] [PMC free article] [PubMed] [Google Scholar]
- Jeon C-J, Masland RH. A population of wide-field bipolar cells in the rabbit’s retina. J Comp Neurol. 1995;360:403–412. doi: 10.1002/cne.903600304. [DOI] [PubMed] [Google Scholar]
- Kier CK, Buchsbaum G, Sterling P. How retinal microcircuits scale for ganglion cells of different size. J Neurosci. 1995;15:7673–7683. doi: 10.1523/JNEUROSCI.15-11-07673.1995. [DOI] [PMC free article] [PubMed] [Google Scholar]
- Kolb H, Nelson R, Mariani A. Amacrine cells, bipolar cells and ganglion cells of the cat retina: a Golgi study. Vision Res. 1981;21:1081–1114. doi: 10.1016/0042-6989(81)90013-4. [DOI] [PubMed] [Google Scholar]
- Kolb H, Dekorver L. Midget ganglion cells of the parafovea of the human retina: a study by electron microscopy and serial section reconstructions. J Comp Neurol. 1991;303:617–636. doi: 10.1002/cne.903030408. [DOI] [PubMed] [Google Scholar]
- Kolb H, Nelson R. OFF-alpha and OFF-beta ganglion cells in cat retina. II. Neural circuitry as revealed by electron microscopy of HRP stains. J Comp Neurol. 1993;329:85–110. doi: 10.1002/cne.903290107. [DOI] [PubMed] [Google Scholar]
- Lehre KP, Levy LM, Ottersen OP, Storm-Mathisen J, Danbolt NC. Differential expression of two glial glutamate transporters in the rat brain: quantitative and immunocytochemical observations. J Neurosci. 1995;15:1835–1853. doi: 10.1523/JNEUROSCI.15-03-01835.1995. [DOI] [PMC free article] [PubMed] [Google Scholar]
- Leventhal AG, Rodieck RW, Dreher B. Retinal ganglion cell classes in the Old World monkey: morphology and central projections. Science. 1981;213:1139–1142. doi: 10.1126/science.7268423. [DOI] [PubMed] [Google Scholar]
- Mann PT, Southwell BR, Young HM, Furness JB. Appositions made by axons of descending interneurons in the guinea-pig small intestine, investigated by confocal microscopy. J Chem Neuroanat. 1997;12:151–164. doi: 10.1016/s0891-0618(96)00189-5. [DOI] [PubMed] [Google Scholar]
- Martin PR, Grünert U. Spatial density and immunoreactivity of bipolar cells in the macaque monkey retina. J Comp Neurol. 1992;323:269–287. doi: 10.1002/cne.903230210. [DOI] [PubMed] [Google Scholar]
- Massey SC, Mills SL. A calbindin-immunoreactive cone bipolar cell type in the rabbit retina. J Comp Neurol. 1996;366:15–33. doi: 10.1002/(SICI)1096-9861(19960226)366:1<15::AID-CNE2>3.0.CO;2-N. [DOI] [PubMed] [Google Scholar]
- Massey SC, Kittila CA, See TP. ON alpha ganglion cells receive input from calbindin cone bipolar cells in rabbit retina. Invest Ophthalmol Vis Sci. 1996;37:S950. [Google Scholar]
- McGuire BA, Stevens JK, Sterling P. Microcircuitry of bipolar cells in cat retina. J Neurosci. 1984;4:2920–2938. doi: 10.1523/JNEUROSCI.04-12-02920.1984. [DOI] [PMC free article] [PubMed] [Google Scholar]
- McGuire BA, Stevens JK, Sterling P. Microcircuitry of beta ganglion cells in cat retina. J Neurosci. 1986;6:907–918. doi: 10.1523/JNEUROSCI.06-04-00907.1986. [DOI] [PMC free article] [PubMed] [Google Scholar]
- Milam AH, Dacey DM, Dizhoor AM. Recoverin immunoreactivity in mammalian cone bipolar cells. Vis Neurosci. 1993;10:1–12. doi: 10.1017/s0952523800003175. [DOI] [PubMed] [Google Scholar]
- Mills SL, Massey SC. Morphology of bipolar cells labeled by DAPI in the rabbit retina. J Comp Neurol. 1992;321:133–149. doi: 10.1002/cne.903210112. [DOI] [PubMed] [Google Scholar]
- Mills SL, Massey SC. Tracer coupling between mammalian bipolar cells. Invest Ophthalmol Vis Sci. 1996;37:S675. [Google Scholar]
- Nelson R, Kolb H. Synaptic patterns and response properties of bipolar and ganglion cells in the cat retina. Vision Res. 1983;23:1183–1195. doi: 10.1016/0042-6989(83)90032-9. [DOI] [PubMed] [Google Scholar]
- Packer O, Hendrickson AE, Curcio CA. Photoreceptor topography of the retina in the adult pigtail macaque (macaca nemistrina) J Comp Neurol. 1989;288:165–183. doi: 10.1002/cne.902880113. [DOI] [PubMed] [Google Scholar]
- Peichl L. Alpha ganglion cells in mammalian retinae: common properties, species differences, and some comments on other ganglion cells. Vis Neurosci. 1991;7:155–169. doi: 10.1017/s0952523800011020. [DOI] [PubMed] [Google Scholar]
- Perry VH, Oehler R, Cowey A. Retinal ganglion cells that project to the dorsal lateral geniculate nucleus in the macaque monkey. Neuroscience. 1984;12:1101–1123. doi: 10.1016/0306-4522(84)90006-x. [DOI] [PubMed] [Google Scholar]
- Polyak SL. The retina. Chicago: The University of Chicago Press; 1941. [Google Scholar]
- Preston GM, Jung JS, Guggino WP, Agre P. The mercury-sensitive residue at cysteine 189 in the CHIP28 water channel. J Biol Chem. 1993;268:17–20. [PubMed] [Google Scholar]
- Rauen T, Kanner BI. Localization of the glutamate transporter GLT-1 in rat and macaque monkey retinae. Neurosci Lett. 1994;169:137–140. doi: 10.1016/0304-3940(94)90375-1. [DOI] [PubMed] [Google Scholar]
- Rauen T, Rothstein JD, Wässle H. Differential expression of three glutamate transporter subtypes in the rat retina. Cell Tissue Res. 1996;286:325–336. doi: 10.1007/s004410050702. [DOI] [PubMed] [Google Scholar]
- Rodieck RW, Brening RK, Watanabe M. The origin of parallel visual pathways. In: Shapley R, Lam DMK, editors. Procceedings of Retinal Research Foundation Symposia. Vol. 5. Cambridge, MA: Massachusetts Institute of Technology; 1993. pp. 117–144. [Google Scholar]
- Rothstein JD, Martin L, Levey AI, Dykes-Hoberg M, Jin L, Wu D, Nash N, Kuncl RW. Localization of neuronal and glial glutamate transporters. Neuron. 1994;13:713–725. doi: 10.1016/0896-6273(94)90038-8. [DOI] [PubMed] [Google Scholar]
- Vardi N, Masarachia PJ, Sterling P. Structure of the starburst amacrine network in the cat retina and its association with alpha ganglion cells. J Comp Neurol. 1989;288:601–611. doi: 10.1002/cne.902880407. [DOI] [PubMed] [Google Scholar]
- Wässle H, Grünert U, Martin P, Boycott BB. Immunocytochemical characterization and spatial distribution of midget bipolar cells in the macaque monkey retina. Vision Res. 1994;34:561–579. doi: 10.1016/0042-6989(94)90013-2. [DOI] [PubMed] [Google Scholar]
- Watanabe M, Rodieck RW. Parasol and midget ganglion cells of the primate retina. J Comp Neurol. 1989;289:434–454. doi: 10.1002/cne.902890308. [DOI] [PubMed] [Google Scholar]
- Wiechmann AF, Hammarback JA. Expression of recoverin mRNA in the human retina: localization by in situ hybridization. Experimental Eye Research. 1993;57:763–769. doi: 10.1006/exer.1993.1184. [DOI] [PubMed] [Google Scholar]
- Wiechmann AF. Recoverin in cultured human retinoblastoma cells: enhanced expression during morphological differentiation. J Neurochem. 1996;67:105–110. doi: 10.1046/j.1471-4159.1996.67010105.x. [DOI] [PubMed] [Google Scholar]
- Yan XX, Wiechmann AF. Early expression of recoverin in a unique population of neurons in the human retina. Anat Embryol. 1997;195:51–63. doi: 10.1007/s004290050024. [DOI] [PubMed] [Google Scholar]