

Abstract
We describe here a dominant mutation, night blindness b (nbb), which causes an age-related visual system defect in zebrafish. At 4–5 months of age, dark-adaptednbb+/−mutants show abnormal visual threshold fluctuations when measured behaviorally. Light sensitizes the animals; thus early dark adaptation ofnbb+/−fish is normal. After 2 hr of dark adaptation, however, visual thresholds ofnbb+/−mutants are raised on average 2–3 log units, and rod system function is not detectable. Electroretinograms recorded fromnbb+/−mutants are normal, but ganglion cell thresholds are raised in prolonged darkness, suggesting an inner retinal defect. The visual defect ofnbb+/−mutants may be likely caused by an abnormal olfactoretinal centrifugal innervation; innbb+/−mutants, the olfactoretinal centrifugal projection to the retina is disrupted, and the number of retinal dopaminergic interplexiform cells is reduced. A similar visual defect as shown bynbb+/−mutants is observed in zebrafish in which the olfactory epithelium and olfactory bulb have been excised. Homozygous nbb fish display an early onset neural degeneration throughout the CNS and die by 7–8 d of age.
Keywords: dark adaptation, dopamine, escape response, mutation, neuronal degeneration, olfactory bulb, olfactoretinal centrifugal pathway, terminal nerve neuron, visual sensitivity, zebrafish
Zebrafish are ideal for genetic studies of the vertebrate eye (Brockerhoff et al., 1995; Baier et al., 1996; Malicki et al., 1996; Li and Dowling, 1997; Neuhauss et al., 1999). Zebrafish are highly visual animals whose retinas contain one type of rod and four types of cone (Branchek and Bremiller, 1984;Robinson et al., 1993). A number of recessive mutations that affect zebrafish retinal development or function have been identified recently (Brockerhoff et al., 1995, 1997; Karlstrom et al., 1996; Malicki et al., 1996; Trowe et al., 1996; Fadool et al., 1997; Neuhauss et al., 1999). However, virtually all of these mutants demonstrate defects other than the eye defects. These mutants tend to develop abnormally and die between 5 and 8 d of age. Thus, it has not been generally possible to study eye mutations in adult zebrafish.
We have recently developed a behavioral test, based on the visually mediated escape response of fish to a threatening object, that permits a quantitative analysis of zebrafish visual sensitivity and the isolation of visual system mutations in adults (Li and Dowling, 1997). When challenged by a threatening object, zebrafish display a robust escape response; as soon as the threatening object comes into view, the fish turn instantly and swim rapidly away. By varying the light intensity illuminating the threatening object and its surround, absolute rod and cone system thresholds as well as the time course of dark adaptation after bright light adaptation can be measured. Using our behavioral assay, we have screened for dominant mutations that cause altered visual sensitivity levels in F1 generation zebrafish that were derived from N-ethyl-N-nitrosurea (ENU) mutagenized founders.
We describe here a dominant mutation, designated night blindness b (nbb), that causes an unusual visual system defect in adult zebrafish. When fully dark-adapted, the visual threshold ofnbb+/−mutants fluctuates by 2–3 log units from day to day, unlike wild-type fish in which the visual threshold is maintained at a constant level when measured at the same time on different days. By recording the electroretinogram (ERG) and ganglion cell discharge, we show that the defect underlying thenbb+/−visual deficit appears not to relate to outer retinal function but rather to abnormalities in the inner retina. Innbb+/−mutants, the olfactoretinal centrifugal pathway is disturbed, and the number of retinal dopaminergic interplexiform cells (DA-IPCs) is reduced. Removing the olfactory epithelium (OE) and olfactory bulb (OB) in wild-type zebrafish results in a visual system defect similar to that ofnbb+/−mutant fish. Although heterozygous mutant fish are viable and show age-related visual system defects, homozygous nbb fish display an early onset neural degeneration throughout the CNS and die by 7–8 d of age.
MATERIALS AND METHODS
Animals and maintenance. Zebrafish (Danio rerio) were maintained on a 14–10 hr light/dark cycle (light, 8 A.M.-10 P.M.; 1.0–2.5 μW/cm2) as described (Westerfield, 1995). For some of the circadian experiments, animals were phase-shifted to a new light/dark cycle (light, 10 P.M.-noon.). Animals were kept in the shifted light/dark cycle for 2 weeks before threshold measurements were made.
The behavioral assay. The apparatus used for behavioral analysis of adult zebrafish visual sensitivity has been described (Li and Dowling, 1997). It consists of a stationary transparent container surrounded by a rotating drum. A black segment (5 × 5 cm) is marked on the drum that serves as a threatening object. The drum is illuminated from above with a white light source (maximum intensity, 4.60 × 10²μW/cm2) and turned at 10 rpm by a motor. Neutral-density filters (in half-log unit steps) are used to change the light intensity on the drum.
With illumination at or above the visual threshold level, zebrafish display a robust escape response to the black segment rotating outside the container (Li and Dowling, 1997). Usually, a judgment as to whether a fish can see the black segment at a given light intensity can be made in <10 sec. For mutant screening, the light illuminating the drum was set at log I = −5.0, ∼1 log unit above the absolute threshold level of wild-type zebrafish. The F1 fish (derived from ENU mutagenized founders) were dark-adapted for a minimum of 20–30 min before a threshold measurement was made. Individuals that failed to show the escape response under the test level of illumination were isolated and rescreened on subsequent days.
To measure the course of dark adaptation, the fish were first light-adapted (3.25 × 10³μW/cm2) for 15–20 min. During subsequent dark adaptation, the threshold light that was required to evoke an escape response when the fish was challenged by the rotating black segment was recorded. The first threshold measurements were made at 2 min after the start of dark adaptation, then repeated at 2 min intervals, and completed at 26 min. Log light threshold is plotted as a function of time of dark adaptation, known as a dark adaptation curve (Li and Dowling, 1997).
ERG and ganglion cell recordings. Zebrafish were anesthetized using 4% 3-amino benzoic methylester and immobilized with 10% gallamine triethiodide. Zebrafish were placed on their side on a sponge with one eye facing toward the light source (maximum intensity, 6.75 × 10³μW/cm2). A slow stream of fish water was directed into the mouth of the fish to keep the fish well oxygenated. ERGs were recorded using a glass pipette (filled with a balanced salt solution) placed on the center of the cornea. Fish were illuminated with 10 msec flashes (full field). The electrical signals were amplified and recorded conventionally.
Ganglion cell action potentials were recorded from the optic nerve. Zebrafish were anesthetized, immobilized, and handled as described above. The connective tissue surrounding the eye was cut away using a pair of microsurgery scissors. The eye was pulled out of the orbit slightly (by 1–2 mm) and held with two glass rods to expose the optic nerve. A tungsten microelectrode (Frederick Haer and Company) was inserted into the optic nerve where the ganglion cell activity was recorded. The eyes were illuminated with 500 msec diffuse light (full field; the same light source as used for ERG recordings). The electrical signals were amplified and recorded conventionally.
Histology and immunocytochemistry. Methods used for histology and immunocytochemistry have been described (Schmitt and Dowling, 1996). For histology, specimens were first fixed in 1% paraformaldehyde/2.5% glutaraldehyde and post-fixed in 1% osmium tetroxide in 0.06 m PBS. Specimens were embedded in Epon/Araldite (Polysciences, Warrington, PA), cut at 1.0 μm in thickness using a microtome, stained with 1% methylene blue, and viewed under a light microscope.
For immunocytochemistry, specimens were fixed in 4% paraformaldehyde in PBS. Specimens were incubated with primary antibodies [FMRFamide (provided by T. O'Donohue), 1:1,000; 5E11 (provided by J. Fadool), 1:10; tyrosine hydroxylase (Chemicon, CA), 1:200] and then incubated with secondary antibodies [FITC- or rhodamine-conjugated secondary antibodies (Boehringer Mannheim, IN) 1:50]. Specimens were mounted on slides and viewed by fluorescence microscopy.
OE and OB excision. Zebrafish were anesthetized using 4% 3-amino benzoic methylester. The connective tissue between the nostril and OE were cut using a microblade. The OE was then stripped out using a pair of small forceps. The OE excision was later confirmed under a dissecting microscope. In most cases, not only the OE but also the olfactory nerve as well as the anterior part of OB were stripped out using this procedure. Thus we refer to OE/OB excision. The fish were allowed to recover for 2–3 d before the behavioral visual threshold measurements were made. No obvious differences in swimming behavior were observed between control and operated fish.
Acridine orange staining. Zebrafish embryos (2.5 d old) were dechorionated and stained with 5 μg/ml of acridine orange (Sigma, St. Louis, MO) in fish water. Embryos were washed with fish water and viewed by fluorescence microscopy (Furutani-Seiki et al., 1996; Li and Dowling, 1997).
Confocal microscopy and image analysis. Confocal images were taken using a Zeiss 410 confocal laser-scanning microscope equipped with a Krypton-argon laser. FITC and rhodamine were excited with the 488 nm and 568 nm emission lines, respectively. Double-labeled specimens were analyzed with sequential scans. Z-series sections were collected in 1.0 μm steps (n = 12).
RESULTS
Isolation of the nbb+/− mutant
We reported previously that zebrafish visual sensitivity is regulated by an endogenous circadian clock (Li and Dowling, 1998). Over a 24 hr period, zebrafish are least sensitive to visual stimuli before dawn and most sensitive before dusk. Although zebrafish visual sensitivity fluctuates between day and night, it remains constant when measured at the same time on different days. When evaluating the visual sensitivity of mutagenized F1 fish, we routinely made threshold measurements in the late afternoon–early evening hours (4–8 P.M.) when the fish are most sensitive to light.
The heterozygous night blindness b(nbbda15) mutant was discovered because its visual sensitivity fluctuated substantially from day to day when measured in the late afternoon hours. This is shown in Figure1A for the F1 generation (9.5 months old) ENU mutagenized zebrafish that we originally isolated. On day 1, the visual threshold of thenbb+/−fish was ∼2 log units above that of control fish; on the second day it was even higher, ∼2.5 log units above the control level. However, on day 3, thresholds of thenbb+/−and control fish were indistinguishable. Two days later (day 5), the visual threshold of thenbb+/−fish was 3 log units above the control fish, but then on day 7, it once again fell to near normal levels. During this time of day, the visual thresholds of wild-type fish remained at a fairly constant level, between log I = −6.0 and log I = −6.5.
Fig. 1.

Behavioral visual thresholds of wild-type andnbb+/−fish. A, Behavioral visual thresholds of a wild-type fish (9.5 months old, ●) and the originalnbb+/−mutant (9.5 months old, ○) determined at the same time (∼6 P.M.) on 5 different days. Each circle indicates a behavioral visual threshold measurement. Note the threshold fluctuation in thenbb+/−mutant when measured on different days. The horizontal dashed line drawn at log I = −5.5 indicates the highest threshold level of wild-type fish when measured at 6 P.M.B, Dark adaptation curves of wild-type (●,n = 12) andnbb+/−fish (○, n = 12) measured during late afternoon–early evening hours. For the first 26 min, visual thresholds were similar between wild-type and mutant fish. Threshold elevations were observed innbb+/−fish when measured at 1, 2, 4, and 6 hr of dark adaptation. Data represent the means ± SD. C, Visual thresholds of wild-type (●, n = 6) andnbb+/−fish (○, n = 10) measured with white (left panel), red (middle panel), or green (right panel) light. Eachcircle indicates a behavioral visual threshold measurement. Note the similarity in visual thresholds ofnbb+/−mutants when measured using white, red, and green lights.
The gross morphology and swimming activity of thenbb+/−fish were indistinguishable from those of wild-type fish. Thenbb+/−fish was crossed with a wild-type zebrafish to generate an F2 generation. In the resulting F2 generation, thenbb+/−mutants were identified using two criteria: the fluctuation of behavioral visual sensitivity and homozygous lethality. That is,nbb+/−fish when bred together yield 25% offspring that die by 7–8 d of age (see below).
The visual defect of nbb+/− fish begins in early adulthood and progresses with age
We measured visual thresholds of F2 generationnbb+/−fish at different ages to determine when the visual threshold fluctuations begin and how they relate to age. The threshold measurements were made in animals that had been dark-adapted for 2 hr (substantial threshold fluctuations are observed only in prolonged dark-adaptednbb+/−mutants; see below). At 2 months of age, all of the tested fish (n = 18), which were randomly selected from an outcross between the originalnbb+/−and a wild-type fish, were normal in terms of visual sensitivity. Defective visual behavior was first detected at 3.5 months; 1 of the 18 test fish showed visual threshold fluctuations similar to that observed in the originalnbb+/−mutant. The behavioral visual threshold of this individual was logI = −4.5 on day 1, but it then dropped to logI = −6.0 when measured at the same time on the following day. On day 3, its threshold was again raised to logI = −5.0. As the F2 generation fish grew older, more individuals showed fluctuations in visual sensitivity. At 4.5 months of age, for example, 4 of 18 F2 fish showed visual threshold fluctuations, and by 6.5 months, 10 of 18 showed fluctuating visual thresholds similar to that seen in the originalnbb+/−mutant.
The extent of visual threshold fluctuation innbb+/−fish progressed with age. At 6.5 months, for example, the visual thresholds of the 10 testednbb+/−fish varied by up to 3 log units, and their average visual threshold was ∼1.0 log unit higher than the threshold level of wild-type fish (log I = −5.1 ± 1.3 vs log I = −6.1 ± 0.3). At 11.5 months, the threshold fluctuation of thesenbb+/−fish had increased to 5 log units, and their average visual threshold was ∼2 log units above that of wild-type fish (log I= −4.0 ± 1.9 vs log I = −6.0 ± 0.4).
The subsequent studies described below were performed using wild-type and identifiednbb+/−fish that were 10–14 months old or otherwise specified.
Light sensitizes nbb+/− fish
To explore factors that might affect the visual sensitivity ofnbb+/−fish, we examined the effects of light adaptation and the time course of subsequent dark adaptation using identifiednbb+/−mutants. The results are shown in Figure 1B. For the first 20–30 min of dark adaptation after bright light adaptation, thenbb+/−mutants dark-adapted in a fashion comparable to that of wild-type fish. During the first 6–8 min of dark adaptation, for example, visual thresholds ofnbb+/−fish (n = 12) were identical to those of wild-type fish (n = 12), suggesting that during early dark adaptation the cone system function innbb+/−fish was normal. During subsequent dark adaptation, visual thresholds of both wild-type andnbb+/−fish continued to decrease until they reached a plateau at 20–22 min. The final threshold ofnbb+/−fish measured at 26 min of dark adaptation was only slightly higher (0.4 log unit) than that of wild-type fish. Thus, between 20 and 26 min of dark adaptation, rod system function innbb+/−fish appeared essentially normal.
With additional time in the dark, however, visual thresholds ofnbb+/−fish began to fluctuate, and the average threshold began to rise. After 1 hr of dark adaptation, the visual thresholds ofnbb+/−fish were on average 0.8 log units higher than those of wild-type fish (Fig. 1B). At 2 hr, they were 2.0 log units above that of wild-type fish. The average visual thresholds ofnbb+/−fish remained high at 4 and 6 hr of dark adaptation, and the visual threshold fluctuations among individual mutant fish continued. Visual thresholds of wild-type fish, on the other hand, remained at a relatively constant level during this 6 hr dark adaptation period (Fig.1B).
Rod function of nbb+/− fish is lost during prolonged darkness
During prolonged darkness, the behavioral visual thresholds ofnbb+/−mutants rose on average by 2–3 log units and reached levels comparable to cone system thresholds in wild-type zebrafish (Fig.1B). To determine whether the threshold elevations were caused primarily by a loss of rod system function, we probed the spectral sensitivity of the cone and rod systems in 2 hr dark-adaptednbb+/−mutants using phototopically matched red (625 nm) or green (500 nm) light. Individualnbb+/−mutants (n = 10) that showed high visual thresholds (log I > −3.5) under white light illumination (Fig.1C, left panel) were tested for cone and rod function using red or green illumination. The results are shown in Figure 1C (middle and right panels) With red and green illumination, the average visual thresholds of 2 hr dark-adapted wild-type zebrafish (n = 6) were logI = −3.4 (red) and log I = −5.3 (green). This shows that fully dark-adapted wild-type fish are ∼2 log units more sensitive to green than to red light. In other words, at 2 hr of dark adaptation, the behavioral visual sensitivity of wild-type fish is governed by rods (Li and Dowling, 1998). Thenbb+/−mutants, on the other hand, did not show rod-dominated visual behavior when tested under prolonged dark-adapted conditions. After 2 hr of dark adaptation, the average thresholds ofnbb+/−mutants were virtually identical when tested using red or green illumination (log I = −2.4). This suggests that the visual threshold elevations shown by prolonged dark-adaptednbb+/−mutants are caused primarily by a loss of rod system function. That the red light thresholds of a number ofnbb+/−mutants were higher than the red light thresholds of wild-type fish suggests that the cone system is also somewhat affected innbb+/−mutants when kept in prolonged darkness.
Visual threshold elevation in nbb+/− fish relates to time in the dark
We next examined visual thresholds of individualnbb+/−fish as a function of time in the dark. The results are shown in Figure2A. At 20 min of dark adaptation, all tested mutants (n = 14) showed normal visual thresholds similar to those of wild-type fish. After 1 hr in the dark, threshold elevations were observed in somenbb+/−mutants; 5 of 14 tested fish showed a rise of visual threshold of ∼1.0 log unit. The threshold elevations became more evident when animals were kept for longer times in the dark. At 2, 4, and 6 hr of dark adaptation, for example, >70% of the tested mutant fish showed visual thresholds equal to or above log I = −5.0. Moreover, a number of the tested fish (35–50%) showed no behavioral responses when tested with light 3 log units above the absolute threshold level of wild-type fish (above log I = −3.0).
Fig. 2.

Behavioral visual thresholds of wild-type andnbb+/−fish as a function of time in dark. A, Visual thresholds ofnbb+/−fish (○, n = 14) during dark adaptation after bright light adaptation (indicated by the first open barshown on the top of the figure). Eachcircle indicates a behavioral visual threshold measurement. Note that at 2, 4, and 6 hr, some of thenbb+/−fish showed no response to visual stimuli at 3 log units above the absolute threshold level of wild-type fish (shown above thehorizontal dashed line drawn at logI = −3.0). The elevated visual thresholds were decreased by exposure to light (the second open barshown on the top of the figure). The black bars shown on the top of the figure indicate darkness. Filled circles indicate the average visual threshold of wild-type fish kept in the same illuminating conditions.B, Visual thresholds of individualnbb+/−mutant fish (numbered 1-4) measured at various times in the dark. Each circleindicates a behavioral visual threshold measurement. Note the threshold fluctuations in fish 1, 2, and 4 when measured at different times in the dark. C, Behavioral visual thresholds of wild-type (●, n = 6) andnbb+/−fish (○, n = 12) measured at subjective dawn and subjective dusk, Animals were kept in constant dark during the experiment. Each circle indicates a behavioral visual threshold measurement. The thresholds measured at subjective dawn were similar between wild-type andnbb+/−fish. Significant threshold elevations were observed innbb+/−mutants when measured at subjective dusk.
The elevated visual thresholds ofnbb+/−mutants could be decreased by light adaptation. After 20 min of light exposure following this 6 hr period of dark adaptation, for example, all of the testednbb+/−mutants responded positively to visual stimuli. Moreover, 11 of 14 tested mutants showed essentially normal thresholds similar to those of wild-type fish (equal to or below log I = −5.5) (Fig.2A).
We also examined whether a single mutant fish showed consistent visual thresholds when kept in darkness. Figure 2B shows that this is not the case. Visual thresholds of individualnbb+/−fish varied substantially when measured over a 6 hr dark adaptation period. An individual that had a lower visual threshold at 2 hr of dark adaptation could have a higher visual threshold at 4 and 6 hr of dark adaptation (fish 1), and the opposite was also observed (fish 2). Fish that had a high visual threshold at 2 hr of dark adaptation could have a lower threshold at 4 hr of dark adaptation but a higher one again at 6 hr of dark adaptation (fish 4). Only one of four tested mutants had a consistent threshold for the entire 6 hr period (fish 3).
The circadian clock that regulates visual sensitivity in nbb+/− mutants may be abnormal
To conclude our behavioral studies, we asked whether the visual threshold fluctuation and elevation shown bynbb+/−mutants relate to the circadian regulation of visual sensitivity. To this end, we measured visual thresholds ofnbb+/−fish as a function of time of day. Animals were kept in the dark from lights off the day before the test. The threshold measurements were made at subjective dawn and subjective dusk.
The results are shown in Figure 2C. In wild-type fish (n = 6), the average threshold measured at subjective dawn was ∼2 log units higher than the average threshold measured at subjective dusk (log I = −3.8 vs log I= −6.1). Innbb+/−mutants (n = 12), however, the average thresholds measured at these two time points were similar (log I = −3.5 at subjective dawn vs log I = −3.7 at subjective dusk). At subjective dawn, visual thresholds of wild-type and mutant fish were similar, and both varied substantially (Fig. 2C). At subjective dusk, on the other hand, no significant threshold variations were observed in wild-type fish, but visual thresholds ofnbb+/−mutant fish varied substantially, by as much as 4.5 log units (from logI = −2.0 to log I = −6.5).
Outer retinal function of nbb+/− fish is normal
To determine whether the defective visual behavior ofnbb+/−fish is caused by a dysfunction of the outer retina, we recorded ERGs from mutant fish. The vertebrate ERG consists of two prominent waves: a corneal negative a-wave, which arises from the photoreceptor cells, followed by a corneal positive b-wave, which originates from second-order retinal cells (Dowling, 1987); thus, the ERG monitors activity primarily from the outer retina. In these experiments, fish were first light-adapted and then kept in the dark for either 20 min or 2 hr before an ERG was recorded. No obvious differences in ERG responses were observed when recorded at 20 min or 2 hr of dark adaptation between wild-type (n = 12) andnbb+/−fish (n = 8). Over a range of 6 log units of light stimuli, the ERG waveform as well as the a- and b-wave amplitudes were similar between wild-type andnbb+/−fish (Fig. 3A). Furthermore, the light intensity that was required to elicit a threshold ERG (10–20 μV b-wave) was similar between the wild-type andnbb+/−fish (Table 1). These data suggest that the outer retina ofnbb+/−mutants functions properly.
Fig. 3.

ERG and ganglion cell recordings.A, Representative ERGs recorded from 2 hr dark-adapted wild-type andnbb+/−fish at dusk. Over a range of 6 log units of stimuli, the ERGs were similar between wild-type andnbb+/−animals. a, a-wave; b, b-wave. The light responses were averaged 6–10 times to increase the response to noise ratio. Calibration bars (bottom) signify 200 msec horizontally and 100 μV vertically. B, Representative histograms of ganglion cell discharges from wild-type and mutant zebrafish elicited with a full-field flash (intensity, logI = −3.0). Note both on andoff responses to the 0.5 sec flash. C, Threshold light levels that were required to fire action potentials of retinal ganglion cells in wild-type (●, n = 6) andnbb+/−fish (○, n = 11) measured at 20 min and 2 hr of dark adaptation. Each circle indicates a visual threshold measurement. Note the threshold elevation innbb+/−mutants at 2 hr of dark adaptation. The horizontal dashed line drawn at log I = −5.75 indicates the highest threshold level of wild-type fish.
Table 1.
Threshold levels of ERG and retinal ganglion cell spikes of wild-type and nbb+/− fish at different times of dark adaptation
| ERG | Ganglion cells | |||
|---|---|---|---|---|
| 20 min | 2 hr | 20 min | 2 hr | |
| Wild type | −6.0 ± 0.4 | −6.1 ± 0.3 | −6.2 ± 0.2 | −6.5 ± 0.3 |
| nbb+/− | −5.9 ± 0.3 | −5.9 ± 0.4 | −5.6 ± 0.6 | −5.2 ± 0.9 |
Different animals were used for ERG and ganglion cell recordings. For ERG recordings, n = 12 for wild-type fish andn = 8 for nbb+/− fish. For ganglion cell recordings, n = 6 for wild-type fish andn = 11 for nbb+/− fish. Data represent the means ± SD.
Inner retinal function of nbb+/− mutants is abnormal
We next examined the light thresholds of retinal ganglion cells innbb+/−mutants to determine whether thenbb+/−visual defect relates to a dysfunction of the inner retina. Animals were first light-adapted and then dark-adapted for either 20 min or 2 hr before a threshold measurement was made. Ganglion cell discharges were recorded from the optic nerve using a tungsten microelectrode (Fig. 3B). In most cases, we recorded ganglion cell activity simultaneously from four to six ganglion cells. Our criterion for a threshold response was the observation on the oscilloscope screen of an increase in action potential discharge. In other words, we measured the thresholds of the most sensitive ganglion cells in each group of recorded cells.
Figure 3C shows the results. After 20 min of dark adaptation, 7 of 11 tested mutant fish showed normal ganglion cell thresholds, whereas 4 mutant fish showed thresholds above logI = −5.75, our criterion level for normality. The average ganglion cell threshold recorded fromnbb+/−mutants was ∼0.6 log units above the threshold level recorded from wild-type fish (n = 6) (Table 1), comparable to the behavioral visual threshold elevation measured at 20 min of dark adaptation.
Whennbb+/−mutants were kept in darkness for 2 hr, more threshold elevations were observed in the ganglion cell discharge. For example, only 3nbb+/−mutants showed normal thresholds (below log I = −5.75) after 2 hr of dark adaptation, whereas 8 of 11 mutant fish showed elevated ganglion cell thresholds as compared with those of wild-type fish (Fig. 3C). The extent of threshold elevation in 2 hr dark-adaptednbb+/−mutants was as much as 3 log units. The ganglion cell threshold was on average 1.3 log units higher innbb+/−than in wild-type zebrafish (Table 1).
Retinal DA-IPCs are decreased in number in aged nbb+/− mutants
Thenbb+/−retina is relatively normal in terms of its gross morphology. It shows normal-appearing nuclear layers as well as plexiform layers. No obvious defects were seen in the photoreceptor or ganglion cell layers. However, one possible abnormality innbb+/−retinas was observed in the lower portion of the inner nuclear layer (INL) where amacrine and DA-IPCs reside; swollen cells and empty spaces were sometimes seen (Fig.4B), although swollen cells were occasionally seen in wild-type retinas (Fig.4A). Our impression was that this disruption of structure was more common innbb+/−than in wild-type retinas, although considerable variation in this regard was noted in the retinas of both types of fish.
Fig. 4.

Histological sections of the retina from wild-type (A) andnbb+/−fish (B) showing the inner nuclear layer. Note that in the lower portion of the inner nuclear layer more swollen cells and/or empty spaces (arrows) were observed innbb+/−than in wild-type retinas. Scale bar, 50 μm.
To test whether there might be an abnormality in the amacrine cells and/or DA-IPCs innbb+/−mutants, we visualized these cells in retinal whole-mount preparations using antibodies against these two cell types. No obvious differences were observed in the appearance and number of amacrine cells betweennbb+/−and wild-type fish [stained with 5E11, an antibody that selectively stains zebrafish amacrine cells (Fadool et al., 1999)]. However, the number of DA-IPCs innbb+/−retinas was reduced somewhat particularly in agednbb+/−mutants (stained with an antibody against tyrosine hydroxylase). In young adults (4.5 months), the number of DA-IPCs was similar betweennbb+/−(n = 8) and wild-type (n = 12) fish (Table 2). However, asnbb+/−fish aged, the number of DA-IPCs was reduced. At 11.5 months, DA-IPCs were decreased by ∼20% innbb+/−fish (n = 8) as compared with the number found in 4.5-month-oldnbb+/−or 11.5-month-old wild-type animals (n = 12) (Table2).
Table 2.
The number of DA-IPCs per retina in young and older animals
| 4.5 months old | 11.5 months old | |
|---|---|---|
| Wild type | 1167 ± 58 | 1116 ± 40* |
| nbb+/− | 1084 ± 76 | 885 ± 67* |
Data were obtained from whole-mount tyrosine hydroxylase-labeled retinas. n = 12 for wild-type retinas, andn = 8 for nbb+/− retinas. *p < 0.001 (t test). Data represent the means ± SD.
Centrifugal fiber innervation of the retina is disrupted in nbb+/− fish
The DA-IPCs in teleost fish retinas receive a rich innervation from centrifugal fibers (CFs) that originate from the terminal nerve neurons (TNs) in the olfactory bulb (Zucker and Dowling, 1987). TNs in fish contain two types of neuropeptides: gonadotropin hormone-releasing hormone (GnRH) and molluscan cardioexcitatory tetrapeptide (FMRFamide) (Stell et al., 1984; Walker and Stell, 1986;Zucker and Dowling, 1987). Using an antibody against FMRFamide, we identified TNs in zebrafish (Fig.5A). Similar to other teleost species, TNs (30–40 in number) are found in the anterior/ventral part of the olfactory bulb in zebrafish (Fig. 5B). Most of the TN axons terminate in the forebrain and midbrain, but some project into the optic nerve (Fig. 5C) and enter the retina where they extend along the border of the INL and inner plexiform layer (IPL), in close apposition to DA-IPCs (Fig. 5D). TN axons that enter the optic nerve and retina are also called CFs.
Fig. 5.

The olfactoretinal centrifugal pathway in zebrafish. A, A schematic drawing of the forebrain and midbrain of zebrafish (dorsal view). TNs (red circles) are found in the anterior/ventral part of the olfactory bulb. Most TN axons are found in TE and TC.B, C, and D highlight the olfactory bulb, the optic nerve, and the retina, respectively, as indicated in A. OE, Olfactory epithelium;ON, olfactory nerve; OB, olfactory bulb;OP, optic nerve; TE, telencephalon;TC, tectum; RE, retina. B, A whole-mount olfactory bulb (outlined by the dashed line; anterior is up) stained with an antibody against FMRFamide. Both TN cell bodies and axons were stained (arrows). C, FMRFamide immunostaining of a retinal section showing CFs in the optic nerve (vertical arrows) and in the retina (horizontal arrows). Photoreceptor cells (top left) were nonspecifically labeled. D, A double-labeled retinal section showing the CFs (red) and DA-IPCs (green,arrows). CFs and DA-IPCs were identified using antibodies against FMRFamide and tyrosine hydroxylase, respectively. Photoreceptor cells (top) were nonspecifically labeled.PH, Photoreceptor cell layer; OP, outer plexiform layer; IN, inner nuclear layer;IP, inner plexiform layer. Scale bars: B, 100 μm; C, D, 30 μm.
TNs were identified innbb+/−fish. The number and appearance of the TNs in the olfactory bulbs as well as the distribution of TN axons in the forebrain and midbrain appeared normal. However, the pattern of CF innervation of the retina was altered innbb+/−mutants. In wild-type retinas, the CFs (five to eight in number at or near the optic disk) first extend out radially and then branch. Secondary and tertiary branches of the CFs are often observed, and prominent varicosities are seen along the processes. The CF branches tend to run concentrically around the retina, and this is especially evident in peripheral retinal regions (Fig.6A,C). Innbb+/−mutants, the number of CFs that entered the retina was similar to that of wild-type fish. However, the branching of CFs in the retina occurred less frequently, and the distribution of CFs was less organized (Fig.6B,D). Furthermore, the CF innervation of the retina was reduced innbb+/−mutants; the number of FMRFamide-positive varicosities counted from nasal/ventral regions ofnbb+/−retinas was reduced by ∼50% as compared with that counted from the same regions of wild-type retinas (1471 ± 485/mm2 vs 3086 ± 457/mm2; p < 0.001;n = 12 for both the wild-type andnbb+/−fish).
Fig. 6.

Flat-mounted wild-type (A,C) andnbb+/−(B, D) retinas. A,B, Schematic drawing of representative CF distribution in wild-type (A) andnbb+/−(B) retinas. Dorsal is up; nasal is to the left. The black circles marked in the middle of the retina indicate the optic disk. Note the disruption and reduction of CFs in thenbb+/−retina. C, D, Confocal images taken from nasal/ventral regions (inset boxes in Aand B) of double-labeled wild-type (C) andnbb+/−(D) retinas. CFs are shown in red, and DA-IPCs are shown in green. Note the disruption and reduction of CFs and the reduction of DA-IPCs in thenbb+/−retina. Scale bar, 100 μm.
Visual thresholds are increased in the absence of olfactory input
To determine whether olfactory centrifugal input plays a role in the visual system and could relate to the visual defect seen innbb+/−mutants, we measured visual sensitivity of zebrafish in which the OE and OB were removed. After surgery (see Materials and Methods), fish were allowed to recover for 2–3 d. No obvious differences in behavior such as feeding or swimming were observed between OE/OB-excised and control animals.
We first examined dark adaptation. For the first 20–30 min of dark adaptation after bright light adaptation, the visual thresholds were similar between OE/OB-excised (4.5 months old, n = 6) and control animals (4.5 months old, n = 10) (Fig.7A). However, when kept for longer times in the dark, OE/OB-excised fish displayed threshold elevations similar to those seen in thenbb+/−mutants. After 1 hr of dark adaptation, for example, two of six OE/OB-excised animals showed high visual thresholds; one responded at log I = −3.0, and the other showed no responses to visual stimuli at levels 3 log units above the absolute sensitivity level of the control fish (Fig. 7B). At 2 and 4 hr of dark adaptation, virtually all of the OE/OB-excised fish showed higher visual thresholds than control fish. Moreover, one-half to two-thirds of the OE/OB-excised fish showed no behavioral responses to visual stimuli at levels 3 log units above the absolute sensitivity level of control fish (above log I = −3) (Fig. 7B). Visual threshold fluctuations were also observed in some of the OE/OB-excised animals; two of six tested fish showed substantial visual threshold fluctuations (>2 log units) when kept in prolonged darkness.
Fig. 7.

Behavioral visual thresholds of control (4.5 months old, ●, n = 10) and OE/OB-excised animals (4.5 months old, ○, n = 6) measured during late afternoon–early evening hours. A, Dark adaptation curves of the control and experimental animals in 26 min. Note the similarity in visual threshold between the control and experimental animals. Data represent the means ± SD. B, Visual thresholds of experimental animals (○) during prolonged darkness. Each circle indicates a behavioral visual threshold measurement. Note the threshold elevation after 1, 2, and 4 hr of dark adaptation. Some of the experimental animals showed no response to visual stimuli 3 log units above the absolute threshold level of wild-type fish (shown above the horizontal dashed lineat log I = −3.0). Filled circlesindicate the average visual thresholds of wild-type fish kept under the same illuminating conditions.
Homozygous nbb mutants are embryonic lethal
To investigate further the nbb mutation, we brednbb to homozygosity by crossing individualnbb+/−mutant fish. Homozygous nbb mutants showed early degeneration in the brain and retinas, beginning at ∼2.5 d post-fertilization (dpf). At 2.5 dpf, the gross morphology, including the size of brain and eye, was similar between wild-type and mutant fish (Fig.8A,B). However, cell death in the forebrain and retinas was observed whennbb−/−embryos were stained with acridine orange (Fig.8B).
Fig. 8.
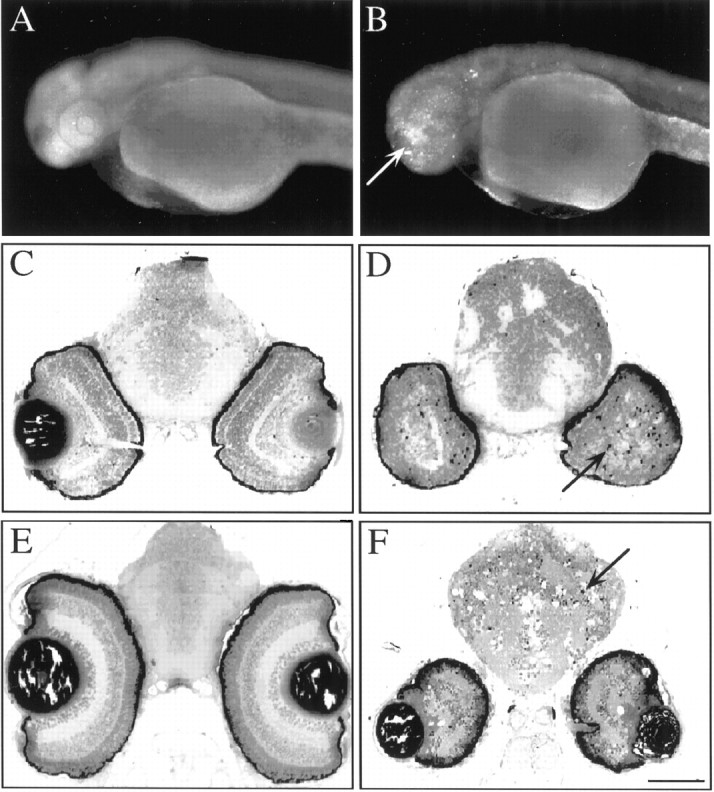
Photographs of whole-mount zebrafish embryos (A, B) and histological sections of the brain and retinas (C–F). A,B, Photographs of 2.5-d-old wild-type (A) andnbb−/−(B) embryos stained with acridine orange. Note the stained cells in the forebrain and eyes ofnbb−/−embryos (bright staining in B,arrow). C–F, Histological sections of the brain and retinas of wild-type (C, E) andnbb−/−(D, F) fish. At 3 d of age (C, D), apoptotic cells were detected in the brain and retinas innbb−/−embryos (D, arrow). By 7 d (E, F), the sizes of the brain and retinas innbb−/−embryos were further reduced. Many cells had died (F,arrow). Scale bars: A, B, 250 μm; C–F, 100 μm.
Brain and retinal cells innbb−/−fish continued to die over time so that by 3 dpf,nbb−/−embryos could be readily identified grossly by their small eyes. Figure8C–F show histological sections across the brain and eyes of wild-type andnbb−/−embryos at 3 and 7 d of age. At 3 d, the retinas are well formed in wild-type fish (Fig. 8C) but not so innbb−/−mutants (Fig. 8D). Dying cells were observed in the eye and brain innbb−/−embryos (Fig. 8D). By 7 d, cell degeneration innbb−/−embryos was widespread; the eye was further reduced in size, and many cells had died (Fig. 8F). Cell death was also observed in the developing forebrain/olfactory bulb as well as in the spinal cord innbb−/−mutants. Thenbb−/−embryos died by 7–8 dpf.
DISCUSSION
In this paper, we describe a dominant mutation (nbb) that causes an unusual visual system defect in adult zebrafish. Under fully dark-adapted conditions, visual thresholds ofnbb+/−mutants measured behaviorally fluctuate abnormally. In addition,nbb+/−mutants show gradual elevations in average visual threshold depending on time in the dark. After 2 hr of dark adaptation, for example, visual thresholds ofnbb+/−mutants are 2–3 log units above the average thresholds measured in fully dark-adapted wild-type fish. However, the elevated visual thresholds can be decreased by exposure to light. After 20 min of bright light adaptation, visual thresholds ofnbb+/−fish fall to levels similar to those of wild-type fish.
The threshold elevation shown bynbb+/−mutants appears to be caused primarily by a loss of rod system function. By examining the light sensitivity ofnbb+/−fish using phototopically matched color illumination, we show that in prolonged darkness, the residual visual sensitivity ofnbb+/−mutants is mediated mainly by the cones. Several lines of evidence suggest that the visual defect ofnbb+/−mutants does not relate to photoreceptor cell function but rather is caused by abnormalities proximal to the outer retina. For example, during the first 20–30 min of dark adaptation after bright light adaptation, visual thresholds measured innbb+/−fish were similar to thresholds measured in wild-type zebrafish. This suggests that at least during early dark adaptation, both the cone and rod photoreceptor cells innbb+/−mutants are essentially normal. Furthermore, at all times during dark adaptation, the ERGs recorded fromnbb+/−mutants showed normal sensitivity levels as well as a- and b-wave amplitudes, suggesting that not only the photoreceptor cells but also other outer retinal neurons innbb+/−fish are functioning properly. On the other hand, light levels required to fire action potentials in retinal ganglion cells were elevated innbb+/−mutants. This suggests that the defect underlyingnbb+/−visual deficit occurs in the inner retina.
Cellular abnormalities were detected in the inner retina in agednbb+/−mutants using histological and immunocytochemical methods. Innbb+/−mutants, there is some evidence of cell loss in the lower portion of the INL where amacrine cells and DA-IPCs normally reside. At 11.5 months of age, the number of DA-IPCs innbb+/−retinas was reduced by ∼20% innbb+/−mutant fish as compared with the number counted from 11.5-month-old wild-type fish or 4.5-month-oldnbb+/−mutants.
The role of centrifugal fiber input to the retina
The observation of reduced DA-IPCs in agednbb+/−mutant retinas led to an investigation of the centrifugal fiber innervation of DA-IPCs in zebrafish. It has long been known that in many vertebrates, the neural retina receives efferent inputs from other parts of the brain (Arey, 1916; Brooke et al., 1965; Dowling and Cowan, 1966; Demski and Northcutt, 1983; Springer, 1983; Fujita et al., 1985). The efferent input originates from the ventral thalamus in reptiles (Halpern et al., 1976), from the isthmooptic nucleus in bird (Cowan, 1970), and from the pretectal area in mammal (Itaya, 1980). In fish, the efferent input originates from the TNs that are located in the olfactory bulb (Munz et al., 1982; Stell et al., 1984;Walker and Stell, 1986). Most of the TN axons in teleost fish terminate in the forebrain and midbrain, but some enter the optic nerve and retina where they terminate along the border between the inner plexiform layer and the inner nuclear layer (Stell et al., 1984). Using electron microscopy, Zucker and Dowling (1987) demonstrated that in the retina the CFs make conventional synapses onto DA-IPCs.
Although the anatomical connections between the olfactory bulb and retina have been described, how CFs influence visual function remains largely unknown. Some in vitro studies performed in isolated fish retinas have investigated the role of CFs in the regulation of retinal cell activity. In white perch, for example, exogenously applied GnRH depolarized the retinal horizontal cells and altered their receptive field size (Umino and Dowling, 1991). It is believed that these effects are mediated by the DA-IPCs on which the CFs synapse; in isolated fish retinas in which the DA-IPCs have been destroyed, exogenous application of GnRH produced no effects on retinal horizontal cells (Umino and Dowling, 1991). In isolated goldfish retinas, exogenous application of FMRFamide caused an increase of spontaneous activity of dark-adapted retinal ganglion cells, but it is not known whether these effects are mediated directly by the peptide or via the DA-IPCs (Stell et al., 1984; Walker and Stell, 1986).
Here we report that CF innervation of the retina appears to play an important role in the regulation of visual sensitivity in zebrafish. Thenbb+/−mutants showed substantial visual threshold fluctuations and elevations particularly under prolonged dark-adapted conditions. A visual defect similar to that shown bynbb+/−mutants was observed in zebrafish in which the OEs/OBs have been excised. The visual defects shown bynbb+/−mutant fish may also be related to a depression of DA-IPC activity. We have found that in the absence of DA-IPCs, zebrafish are less sensitive to light by up to 3 log units as compared with wild-type fish [accompanying paper (Li and Dowling, 2000)]. The sensitivity loss in DA-IPC-depleted animals is attributable primarily to a loss of rod system function, as is the case fornbb+/−mutants. At the present time, it is not clear how the olfactory centrifugal input might influence visual sensitivity. One possibility is that olfactory signals trigger excitation of the DA-IPCs. In response, dopamine levels in the retina are raised, enhancing rod signal transmission through the inner plexiform layer.
The circadian control of nbb+/− visual sensitivity may be disrupted
The mechanisms that underlie the circadian clock regulation of visual sensitivity may relate to the defect shown bynbb+/−fish. In wild-type fish, visual sensitivity is suppressed by up to 2 log units by the circadian clock during early morning hours (Li and Dowling, 1998). The suppression of visual sensitivity is released during the day. Innbb+/−mutants, suppression of visual sensitivity appears to continue during day and night. As a result, visual thresholds ofnbb+/−fish are on average ∼2 log units above the threshold level of wild-type fish as measured before dusk. Of particular note is the fact that during circadian suppression of visual sensitivity (at dawn), substantial variation of visual thresholds among wild-type zebrafish is observed. Little fluctuation in visual system sensitivity is observed at dusk, when the fish are most sensitive to light. Innbb+/−fish, substantial visual threshold fluctuations are observed both at dawn and at dusk. The loss of circadian control of visual sensitivity innbb+/−mutants could be related to the disruption of DA-IPCs in the retina. For example, in zebrafish in which the DA-IPCs have been ablated, the circadian control of visual sensitivity is largely abolished [accompanying paper (Li and Dowling, 2000)].
The nbb gene
Last, what can we say about the role and locus of expression of the nbb gene? Our data suggest that thenbb gene is essential for early CNS development and is required for maintenance of CNS function during adulthood. With half of the nbb gene product available (heterozygotes), animals are viable but show age-related defects primarily in the olfactory and/or visual system. However, when nbb gene function is completely eliminated (homozygotes), animals show many defects both in the brain and elsewhere during embryonic development. Homozygous nbbmutants die by 7–8 d of age. This suggests that the expression ofnbb is not limited to either the olfactory or visual system but that it must function in many cells and tissues.
Footnotes
This work was supported by National Institutes of Health Grants EY 00811 and EY 00824. We thank A. Adolph for advice on ERG and ganglion cell recordings, S. Brockerhoff for providing ENU mutagenized zebrafish, E. Schmitt for protocols of histology and immunocytochemistry, J. Fadool for providing 5E11 antibodies, and T. O'Donohue for providing FMRFamide antibodies. We also thank W. McCarthy, S. Harris, and S. Sciascia for maintenance of zebrafish, and D. Smith for advice on confocal imaging.
Correspondence should be addressed to Lei Li, Department of Physiology, University of Kentucky College of Medicine, 800 Rose Street, Lexington, KY 40536. E-mail: leili@pop.uky.edu.
REFERENCES
- 1.Arey LB. The function of the afferent fibers of the optic nerve of fishes. J Comp Neurol. 1916;26:213–245. [Google Scholar]
- 2.Baier H, Klostermann S, Trowe T, Karlstrom RO, Nusslein-Volhard C, Bonhoeffer F. Genetic dissection of the retinotectal projection. Development. 1996;123:415–425. doi: 10.1242/dev.123.1.415. [DOI] [PubMed] [Google Scholar]
- 3.Branchek T, Bremiller R. The development of photoreceptors in the zebrafish, Branchydanio rerio. I. Structure. J Comp Neurol. 1984;224:107–115. doi: 10.1002/cne.902240109. [DOI] [PubMed] [Google Scholar]
- 4.Brockerhoff SE, Hurley JB, Janssen-Bienhold U, Neuhauss SCF, Driever W, Dowling JE. A behavioral screen for isolating zebrafish mutants with visual system defects. Proc Natl Acad Sci USA. 1995;92:10545–10549. doi: 10.1073/pnas.92.23.10545. [DOI] [PMC free article] [PubMed] [Google Scholar]
- 5.Brockerhoff SE, Hurley JB, Niemi GA, Dowling JE. A new form of inherited red-blindness identified in zebrafish. J Neurosci. 1997;17:4236–4242. doi: 10.1523/JNEUROSCI.17-11-04236.1997. [DOI] [PMC free article] [PubMed] [Google Scholar]
- 6.Brooke RNL, Downer JC, Powell TPS. Centrifugal fibers to the retina in the monkey and cat. Nature. 1965;207:1365–1367. doi: 10.1038/2071365a0. [DOI] [PubMed] [Google Scholar]
- 7.Cowan WM. Centrifugal fibers to the avian retina. Br Med Bull. 1970;2:112–118. [Google Scholar]
- 8.Demski LS, Northcutt RG. The terminal nerve: a new chemosensory system in vertebrate? Science. 1983;220:435–437. doi: 10.1126/science.6836287. [DOI] [PubMed] [Google Scholar]
- 9.Dowling JE. The retina: an approachable part of the brain. Harvard UP; Cambridge, MA: 1987. [Google Scholar]
- 10.Dowling JE, Cowan WM. An electron microscope study of normal and degenerating centrifugal fiber terminals in the pigeon retina. Z Zellforsch Mikrosk Anat. 1966;71:14–28. doi: 10.1007/BF00339827. [DOI] [PubMed] [Google Scholar]
- 11.Fadool JM, Brockerhoff SE, Hyatt GA, Dowling JE. Mutations affecting eye morphology in the developing zebrafish (Danio rerio). Dev Genet. 1997;20:288–295. doi: 10.1002/(SICI)1520-6408(1997)20:3<288::AID-DVG11>3.0.CO;2-4. [DOI] [PubMed] [Google Scholar]
- 12.Fadool JM, Fadool DA, Moore JC, Linser PJ. Characterization of monoclonal antibodies against zebrafish retina. Invest Ophthal Vis Sci. 1999;40:S237. [Google Scholar]
- 13.Fujita I, Satou M, Ueda K. Ganglion cells of the terminal nerve: morphology and electrophysiology. Brain Res. 1985;335:148–152. doi: 10.1016/0006-8993(85)90286-0. [DOI] [PubMed] [Google Scholar]
- 14.Furutani-Seiki M, Jiang YJ, Brand M, Hersenberg CP, Houart C, Beuchle D, Van Eeden JM, Granato M, Haffer P, Hammerschmidt M, Kane DA, Kelsh RN, Mullins MC, Odenthal J, Nusslein-Volhard C. Neural degeneration mutants in the zebrafish, Danio rerio. Development. 1996;123:229–239. doi: 10.1242/dev.123.1.229. [DOI] [PubMed] [Google Scholar]
- 15.Halpern M, Wang RT, Colman DR. Centrifugal fibers to the eye in a nonavian vertebrate: source revealed by horseradish peroxidase studies. Science. 1976;194:1185–1188. doi: 10.1126/science.63147. [DOI] [PubMed] [Google Scholar]
- 16.Itaya SK. Retinal efferents from the pretectal area in the rat. Brain Res. 1980;201:436–441. doi: 10.1016/0006-8993(80)91049-5. [DOI] [PubMed] [Google Scholar]
- 17.Karlstrom RO, Trowe T, Klostermann S, Baier H, Brand M, Crawford AD, Grunewald B, Haffter P, Hoffmann H, Meyer SU, Muller BK, Richter D, Van Eeden FJM, Nusslein-Volhard C, Bonhoeffer F. Zebrafish mutations affecting retinotectal axon pathfinding. Development. 1996;123:427–438. doi: 10.1242/dev.123.1.427. [DOI] [PubMed] [Google Scholar]
- 18.Li L, Dowling JE. A dominant form of inherited retinal degeneration caused by a non-photoreceptor cell-specific mutation. Proc Natl Acad Sci USA. 1997;94:11645–11650. doi: 10.1073/pnas.94.21.11645. [DOI] [PMC free article] [PubMed] [Google Scholar]
- 19.Li L, Dowling JE. Zebrafish visual sensitivity is regulated by a circadian clock. Vis Neurosci. 1998;15:851–857. doi: 10.1017/s0952523898155050. [DOI] [PubMed] [Google Scholar]
- 20.Li L, Dowling JE. Effects of dopamine depletion on visual sensitivity of zebrafish. J Neurosci. 2000;20:1893–1903. doi: 10.1523/JNEUROSCI.20-05-01893.2000. [DOI] [PMC free article] [PubMed] [Google Scholar]
- 21.Malicki J, Neuhauss SCF, Schier AF, Solnica-Krezel L, Stemple DL, Stainier DYR, Abdelilah S, Zwartkruis F, Rangini Z, Driever W. Mutations affecting development of the zebrafish retina. Development. 1996;123:263–273. doi: 10.1242/dev.123.1.263. [DOI] [PubMed] [Google Scholar]
- 22.Munz H, Class B, Stumpf WE, Jennes L. Centrifugal innervation of the retina by luteinizing hormone releasing hormone (LHRH)-immunoreactive telencephalic neurons in teleostean fishes. Cell Tissue Res. 1982;222:313–323. doi: 10.1007/BF00213215. [DOI] [PubMed] [Google Scholar]
- 23.Neuhauss SCF, Biehlmaier O, Seeliger MW, Das T, Kohler K, Harris WA, Baier H. Genetic disorders of vision revealed by a behavioral screen of 400 essential loci in zebrafish. J Neurosci. 1999;19:8603–8615. doi: 10.1523/JNEUROSCI.19-19-08603.1999. [DOI] [PMC free article] [PubMed] [Google Scholar]
- 24.Robinson J, Schmitt EA, Harosi FI, Reec RJ, Dowling JE. Zebrafish ultraviolet visual pigment: absorption spectrum, sequence, and localization. Proc Natl Acad Sci USA. 1993;90:6009–6012. doi: 10.1073/pnas.90.13.6009. [DOI] [PMC free article] [PubMed] [Google Scholar]
- 25.Schmitt EA, Dowling JE. Comparison of topographical patterns of ganglion and photoreceptor cell differentiation in the retina of the zebrafish. J Comp Neurol. 1996;371:222–234. doi: 10.1002/(SICI)1096-9861(19960722)371:2<222::AID-CNE3>3.0.CO;2-4. [DOI] [PubMed] [Google Scholar]
- 26.Springer AD. Centrifugal innervation of goldfish retina from ganglion cells of the nervus terminalis. J Comp Neurol. 1983;214:404–415. [Google Scholar]
- 27.Stell WK, Walker SE, Chohan KS, Ball AK. The goldfish nervus terminalis: a luteinizing hormone-releasing hormone and molluscan cardioexcitatory peptide immunoreactive olfactoretinal pathway. Proc Natl Acad Sci USA. 1984;81:940–944. doi: 10.1073/pnas.81.3.940. [DOI] [PMC free article] [PubMed] [Google Scholar]
- 28.Trowe T, Klostermann S, Baier H, Granato M, Crawford AD, Grunewald B, Hoffmann H, Karlstrom RO, Meyer SU, Muller B, Richter S, Nusslein-Volhard C, Bonhoeffer F. Mutations disrupting the ordering and topographic mapping of axons in the retinotectal projection of the zebrafish, Danio rerio. Development. 1996;123:439–450. doi: 10.1242/dev.123.1.439. [DOI] [PubMed] [Google Scholar]
- 29.Umino O, Dowling JE. Dopamine release from interplexiform cells in the retina: effects of GnRH, FMRFamide, bicuculline, and enkephalin on horizontal cell activity. J Neurosci. 1991;11:3034–3046. doi: 10.1523/JNEUROSCI.11-10-03034.1991. [DOI] [PMC free article] [PubMed] [Google Scholar]
- 30.Walker SE, Stell WK. Gonadotropin-releasing hormone (GnRH), molluscan cardioexcitatory peptide (FMRFamide), enkephalin and related neuropeptides affect goldfish retinal ganglion cell activity. Brain Res. 1986;384:262–273. doi: 10.1016/0006-8993(86)91162-5. [DOI] [PubMed] [Google Scholar]
- 31.Westerfield M. The zebrafish book: a guide for the laboratory use of zebrafish (Brachydanio rerio). University of Oregon; Eugene, OR: 1995. [Google Scholar]
- 32.Zucker CL, Dowling JE. Centrifugal fibers synapse on dopaminergic interplexiform cells in the teleost retina. Nature. 1987;330:166–168. doi: 10.1038/330166a0. [DOI] [PubMed] [Google Scholar]