

Abstract
Opening and closing of a CFTR Cl− channel is controlled by PKA-mediated phosphorylation of its cytoplasmic regulatory (R) domain and by ATP binding, and likely hydrolysis, at its two nucleotide binding domains. Functional interactions between the R domain and the two nucleotide binding domains were probed by characterizing the gating of severed CFTR channels expressed in Xenopus oocytes. Expression levels were assessed using measurements of oocyte conductance, and detailed functional characteristics of the channels were extracted from kinetic analyses of macroscopic current relaxations and of single-channel gating events in membrane patches excised from the oocytes. The kinetic behavior of wild-type (WT) CFTR channels was compared with that of split CFTR channels bearing a single cut (between residues 633 and 634) just before the R domain, of split channels with a single cut (between residues 835 and 837) just after the R domain, and of split channels from which the entire R domain (residues 634–836) between those two cut sites was omitted. The channels cut before the R domain had characteristics almost identical to those of WT channels, except for less than twofold shorter open burst durations in the presence of PKA. Channels cut just after the R domain were characterized by a low level of activity even without phosphorylation, strong stimulation by PKA, enhanced apparent affinity for ATP as assayed by open probability, and a somewhat destabilized binding site for the locking action of the nonhydrolyzable ATP analog AMPPNP. Split channels with no R domain (from coexpression of CFTR segments 1–633 and 837–1480) were highly active without phosphorylation, but otherwise displayed the characteristics of channels cut after the R domain, including higher apparent ATP affinity, and less tight binding of AMPPNP at the locking site, than for WT. Intriguingly, severed channels with no R domain were still noticeably stimulated by PKA, implying that activation of WT CFTR by PKA likely also includes some component unrelated to the R domain. As the maximal opening rates were the same for WT channels and split channels with no R domain, it seems that the phosphorylated R domain does not stimulate opening of CFTR channels; rather, the dephosphorylated R domain inhibits them.
Keywords: ATP-binding cassette transporter, chloride ion channel, phosphorylation, gating regulation, kinetic model
INTRODUCTION
The cystic fibrosis transmembrane conductance regulator, encoded by the gene altered in cystic fibrosis patients, is a chloride channel normally expressed at the apical surfaces of epithelia, where its diminished function underlies the disease (Riordan et al. 1989). Opening and closing of CFTR channels are complex processes controlled by interactions between their three principal cytoplasmic domains, namely the regulatory (R) domain and the NH2- and COOH-terminal nucleotide binding domains (NBD1 and NBD2). The R domain contains many serines (Riordan et al. 1989) in consensus motifs for phosphorylation by cAMP-dependent protein kinase (PKA) and protein kinase C, and at least two are phosphorylated by PKC in vitro (Picciotto et al. 1992; Dulhanty and Riordan 1994), several by PKA in vivo (Cheng et al. 1991, Picciotto et al. 1992), and at least 8 by PKA in vitro (Cheng et al. 1991; Picciotto et al. 1992; Townsend et al. 1996; Neville et al. 1997). All these PKA sites, and more, have been implicated in channel regulation from the functional consequences of mutating them (e.g., Chang et al. 1993; Rich et al. 1993; Seibert et al. 1995, Seibert et al. 1999; Mathews et al. 1998a). Phosphorylation of the R domain by PKA (and probably PKC) is required before ATP binding, and possibly hydrolysis, at NBD1 causes a CFTR channel to open. Depending on the channel's phosphorylation status, it has been proposed that a second ATP may then bind at NBD2 and stabilize the open state of the channel until hydrolysis of that ATP prompts channel closure (for reviews, see, e.g., Csanády and Gadsby 1999; Gadsby and Nairn 1999; Sheppard and Welsh 1999). However, this picture of channel gating is both oversimplified and controversial, and neither the precise roles of the individual domains nor the details of the interactions between them are yet clear.
The present work was aimed at clarifying the nature of these interactions between the R domain and the NBDs in regulating CFTR channel gating. One question is whether activation of CFTR channels via R-domain phosphorylation reflects disinhibition or stimulation, or both. Because opening of wild type (WT) CFTR channels by ATP requires phosphorylation, it was suggested that the dephosphorylated R domain inhibits channel function (e.g., Cheng et al. 1991). This was further supported by the finding that CFTR channels with much of the R domain deleted, CFTR-ΔR(708-835), were gated by ATP in the absence of phosphorylation, albeit with a low open probability (Rich et al. 1991, Rich et al. 1993; Ma et al. 1997). The low opening rate of ΔR(708-835) channels, compared with WT, went hand in hand with their apparent inability (Ma et al. 1997) to interact with AMPPNP or pyrophosphate (PPi), substances that stabilize open bursts of phosphorylated WT channels. These deficiencies of ΔR(708-835) channels, together with a stimulation of their activity caused by phosphorylated exogenous R-domain peptides, led to the conclusion that the R domain in its dephosphorylated state inhibits CFTR channel gating, but stimulates gating when phosphorylated (Winter and Welsh 1997; Ma et al. 1997). In addition, all of the stimulation caused by PKA was ascribed to phosphorylation of the R domain, because PKA no longer influenced ΔR(708-835) channels once the residual R-domain serine, Ser 660, was mutated to alanine (Rich et al. 1993).
Although deletion of a domain is a useful strategy for discerning its function, the selection of appropriate boundaries for the deletion, to avoid steric distortion when originally nonadjacent residues are linked, can be difficult unless the structure is already known. Fortunately, CFTR is a member of the superfamily of ATP-binding cassette (ABC) transporters and, except for its unique R domain, it shares their overall modular architecture, comprising two hexa-helical transmembrane domains and two cytoplasmic NBDs (see Higgins 1992). In many prokaryotic ABC transporters, these domains are expressed from separate genes, but they coassemble to form functional transporters. Evidently, even in their single-gene eukaryotic descendants, the individual domains have retained the ability to fold correctly and to interact productively with each other, because split constructs, obtained by coexpression of complementary severed segments, have been demonstrated to be functional not only for CFTR (Ostedgaard et al. 1997; Chan et al. 2000), but also for the multi-drug resistance transporters P-glycoprotein (Loo and Clarke 1994) and MRP (Gao et al. 1996), and for the yeast a-mating factor transporter, STE6 (Berkower and Michaelis 1991). We have recently successfully used this severed-molecule approach to functionally define the structural boundaries of NBD1 in CFTR (Chan et al. 2000), and we have extended that approach here to probe the interactions of the R domain with the NBDs that regulate CFTR channel gating.
We examined WT CFTR channels, severed CFTR channels with a single cut close to either the N- or the C-proximal end of the R domain, and severed CFTR channels lacking the entire R domain between those cut sites, after expressing them in Xenopus oocytes. Severing CFTR between NBD1 and the R domain resulted in only a small change in gating properties, whereas a cut near the COOH terminus of the R domain allowed a small amount of phosphorylation-independent activity. Split channels with no R domain were functionally similar to channels cut just after the R domain, except for a more pronounced activity without phosphorylation. Because the opening rates were the same after phosphorylation for WT channels and split channels with no R domain, it seems unlikely that the phosphorylated R domain normally stimulates CFTR channel opening.
METHODS
Molecular Biology
pGEMHE-WT, pGEMHE-1-633, pGEMHE-Flag3-633, pGEMHE-Flag3-835, and pGEMHE-634-1480 were constructed as described (Chan et al. 2000). pGEMHE-1-835 was made by PCR using a forward primer T7 FW (5′-TAATACGACTCACTATAGGGCGAATT) and a reverse primer 835RV (5′-CCGCTCGAG CTAATC-AAAAAAGCACTCCTTTAAGTC) with pGEMHE-WT as template, followed by subcloning into the SmaI and XhoI (BioLabs Inc.) sites of pGEMHE. pGEMHE-837-1480 was made by PCR with a forward primer PK837FW (5′-TCCCTGCAGCCGCCATGGAGAGCATACCAGCAGTGACT) and a reverse primer SP6 RV (5′-CGCCAAGCTATTTAGGTGACACTATAG) with pGEMHE-WT as template, cut by XhoI, and subcloned into SmaI (blunt) and XhoI sites of pGEMHE. CFTR-K1250A was a gift from Dr. David Dawson (Oregon Health Sciences University, Portland, OR), and was subcloned into pGEMHE to give pGEMHE-K1250A. pGEMHE-837-1480(K1250A) was made using pGEMHE-K1250A as template, primers SK837FW (5′-TCCCCCGGGCCGCCATGGAGAGCATACCAGCAGTGACT) and SP6 RV, followed by subcloning. All constructs were confirmed by automated sequencing. cRNA was prepared by in vitro transcription and quantitated as described (Chan et al. 2000).
Isolation and Injection of Xenopus Oocytes, and Two-Microelectrode Voltage-Clamp Recordings
Oocytes were isolated, and 2.5 ng cRNA for each CFTR segment (mixed as appropriate, in a constant 50-nl volume) was injected as described (Chan et al. 2000). Recordings were made at room temperature in a flow chamber, while oocytes were superfused with Ca2+-free Ringer's solution. Basal and activated (by 50 μM forskolin and 1 mM IBMX) conductances were calculated from the slope between −60 and −20 mV of steady state current–voltage plots obtained from 1-s voltage steps to potentials between −100 and +80 mV. To abolish basal PKA activity, oocytes were injected, 10–30 min before recording, with 50 nl of 20-mM RpcAMPS (BIOLOG) solution; estimated final concentration, ∼2 mM.
Excised Patch Recording
For recording single-channel or macroscopic currents, excised inside-out patches were pulled from oocytes preinjected with 0.1–5 ng of cRNA for each CFTR segment. Recordings were made as described (Chan et al. 2000). Briefly, outward unitary currents were recorded at a pipette holding potential of −40 mV (Vm = +40 mV), with a pipette solution containing 138 mM NMG, 2 mM MgCl2, 5 mM HEPES, 136 mM HCl, pH 7.4 with HCl. Pipette resistances were ∼1 or 4–7 MΩ for macropatch or single-channel recordings, respectively, and seal resistances were 100–300 GΩ. The continuously flowing bath solution contained 138 mM NMG, 2 mM Mg-sulfamate, 5 mM HEPES, 0.5 mM EGTA, 134 mM sulfamic acid, pH 7.1 with sulfamic acid (for single-channel conductance measurements, sulfamate in the bath solution was replaced by Cl−). Solution exchange (measured from the decay of endogenous Ca2+-activated Cl−-channel current, after brief application and removal of 2 mM Ca-sulfamate) had a time constant of 200–600 ms, and was essentially complete within 1–3 s. The rate of the slow current decay after AMPPNP removal was at least an order of magnitude slower in all cases. Nucleotides were added in the form of MgATP (pH 7.2 with NMG), Li4-AMPPNP, and NMG-pyrophosphate (pH 7.2 with NMG, supplemented with equimolar Mg-sulfamate). To counter highly active endogenous membrane-attached phosphatases, 300 nM PKA catalytic subunit purified from bovine heart (Kaczmarek et al. 1980) was used to activate CFTR channels. Unless specified, recordings were made at ambient room temperature, ∼24°C for most experiments studying AMPPNP and various [ATP], but 21°–26°C for steady state recordings used for kinetic analysis. Records were filtered online at 100 Hz using an eight-pole Bessel filter, and digitized at 1 kHz.
Kinetic analysis of records containing one to seven channels was as described (Chan et al. 2000). Baseline-subtracted currents (to remove slow drifts and the ∼0.5 pA shift seen on adding PKA, due to its buffer: such baseline-corrected traces are shown in Fig. 3, Fig. 5, Fig. 7, and Fig. 10; others are uncorrected) were idealized by conventional half-amplitude threshold crossing. Events lists were fitted with a simple model in which all principal gating transitions were pooled into a closed-open scheme, and flickery closures modeled as pore blockage events (Ishihara and Welsh 1997), resulting in the three-state closed-open-blocked scheme (C-O-B). Rate constants r CO, r OC, r OB, and r BO were extracted by a simultaneous fit to the dwell-time histograms of all conductance levels, as described (Csanády 2000), and mean interburst and burst durations then calculated as τib = 1/ r CO and τb = (1/r OC)(1 + r OB/r BO), respectively. Dead time was 4 ms, and typical rates were r OB = ∼3 s−1, r BO = ∼100 s−1, and r CO and r OC on the order of 1 s−1, depending on [ATP] and/or PKA. Open probabilities were calculated from the events lists as the time-average of the fraction of open channels.
Figure 3.

Kinetic parameters underlying phosphorylation-dependent changes in channel currents. (A) Representative baseline-subtracted records from excised patches containing small numbers of WT, 633+634, 835+837, cut-ΔR (633+837), or Flag-cut-ΔR (F633+837) channels. (B) Open probability, (C) mean burst duration, and (D) mean interburst duration, from fits to steady state dwell-time histograms for each construct (identified below each column): striped bars give estimates in the presence of 300 nM PKA and 2 mM MgATP; black bars give estimates in MgATP alone, before exposure to PKA, for constructs 835+837, cut-ΔR (633+837), and Flag-cut-ΔR (F633+837); gray bars give estimates in MgATP alone, just after removal of PKA, for WT and 633+634 channels.
Figure 5.

Dependence on [ATP] of opening and closing rates of WT and Flag-cut-ΔR in small patches containing few channels. (A) Representative baseline-subtracted recordings: quasi-stable activity of WT channels (top) after initial rapid drop in P o on removal of PKA; Flag-cut-ΔR (F633+837) channels (bottom) before exposure to PKA. (B and C) Summary of opening and closing rates from the segments at test [ATP] (50 μM, 100 μM, and 1 mM) normalized to the mean of the estimates obtained from the bracketing segments at 2 mM ATP, from experiments like those in A, for WT (▴) and Flag-cut-ΔR channels (F633+837; ▿). For WT, relative rates at 2 μM ATP were estimated from three tests in one macropatch, on the basis of reasonable assumptions (e.g., P o = 0.36 in PKA and 2 mM ATP) to obtain channel number, and using the mean closing rate at 2 mM ATP from all small patches. Solid and dotted lines in B are Michaelis fits to the data of WT and Flag-cut-ΔR, giving K m values of 46 ± 13 and 39 ± 7 μM, respectively.
Figure 7.

(A and C) Baseline-subtracted traces showing delayed closure of WT (A) and cut-ΔR (633+837) (C) channels after washout (at ∼24°C) of 0.1 mM MgATP and 1 mM AMPPNP 5 s before the start of each trace. Red lines show unlocking events reconstructed using algorithm in Methods. (B and D) Idealized sequences of unlocking events for WT (B) and cut-ΔR (D) channels, constructed by summing results of two WT and five cut-ΔR experiments like those at left. Note different time scales in A and B vs. C and D.
Figure 10.

Walker-A mutant cut-ΔR(K1250A) [633+837 (K1250A)] channels show prolonged open bursts. (A) Representative baseline-subtracted record of single cut-ΔR(K1250A) channel in 2 mM MgATP, no PKA, at 25°C. (B) Current relaxation of cut-ΔR(K1250A) channels after removal of 2 mM MgATP (no PKA), constructed by summing synchronized decay currents from nine experiments, at 25°C; single-exponential fit (solid line) to quasi-macroscopic current decay gave τ = 6.7 s. (Inset) Similar trace constructed from seven experiments at 20°C with fit (solid line) τ = 10.1 s. (C) Survivor function of burst durations, after exclusion of flickery closures, of cut-ΔR(K1250A) channels in 2 mM MgATP, constructed from events isolated from a total of 16 min of recordings suitable for such analysis, including 10 min from a single channel. The distribution was fit (solid line) significantly better by two exponential components than by one.
Determination of the Number of Channels
For kinetic analysis, channels were counted at the end of each record by locking them in the open state with 2 mM PPi (or 1 mM AMPPNP) in the presence of 0.1 mM ATP. In cases where not all channels could be locked, as was frequently the case for channels cut after, or lacking, the R domain, statistical tests, developed for simplicity for identical and independent channels with a simple closed-open scheme, were used to test the hypothesis that the number of channels in the patch (n) did not exceed the observed maximum number of simultaneously open channels (n′). One such test was based on the argument that the presence of n channels (n > n′) is not likely if the total observed time with n′ channels simultaneously open is long compared with the apparent opening rate of n − n′ channels. In particular, if β′ is the single-channel opening rate extracted assuming n′ channels, then β*n − n′, the apparent opening rate of n − n′ channels assuming that there are n channels in the patch, is β*n − n′ ≈ (n′/n)(n − n′)β′. If T n′ is the total observed time during which n′ channels were simultaneously open, then the a posteriori probability that a simultaneous opening of an additional channel is not observed during this time, provided that there are n channels, is given by e −β*n−n′Tn′.Hence, the hypothesis that n channels (n > n′) are present in the patch can be rejected with confidence 1 − ε, if e −β*n−n′Tn′ <ε. For n′ = 1 and P o << 1, this test reduces to that derived by Colquhoun and Hawkes 1995. A different test was used in cases where the number of n′ events was very small, but the total time observed with n′ − 1 simultaneously open channels was very long, based on the argument that the presence of n channels (n > n′) is not likely if the number of expected n′ events (assuming n channels) greatly exceeds the observed number. Since these tests assume a simple closed-open scheme, β′ was taken as the inverse of the mean interburst duration obtained assuming n′ channels. Records for which the number of channels could be estimated with >90% confidence were included for kinetic analysis. Although these tests proved reliable for simulated data, they are likely less accurate in real situations where the implicit assumption of identical and independent channels may not always hold. Nevertheless, they are expected to eliminate the likelihood of grossly underestimating channel number.
Burst Analysis
Bursts were isolated from single-channel records by suppressing closures shorter than a specified cutoff t c. The method of Jackson et al. 1983 was used to choose the value of t c individually for each record. This method minimizes the total probability of misassigning a closed event, and provides t c in the form of t c=τ1τ2τ2−τ1·lnτ2 a 1τ1 a 2, where τ1, τ2, a 1, and a 2 are time constants and fractional amplitudes of a two-exponential fit to the closed-time histogram. [Typically, t c was 30–80 ms, 400–800 ms for cut-ΔR(K1250A).] The distributions of the durations of bursts obtained in this way were fitted by single exponentials or sums of two exponentials. The fit parameters were determined from the events lists using an unbinned maximum likelihood optimization (e.g., Colquhoun and Sigworth 1995). The need for introducing a second component was evaluated by the Schwarz criterion, which penalizes models with too many parameters. This method was found effective by Ball and Sansom 1989 for model identification when comparing likelihoods of a series of dwell times. Since (after exclusion of flickery closures) model identification was reduced here to a choice between a simple closed-open model or a model with one closed and two open states, for both of which the log likelihood of the whole time series separates into the sum of the log likelihoods of the closed- and open-time intervals (see Ball and Sansom 1989), in this case, applying the Schwarz criterion to the likelihood of the (relevant) open-time intervals, instead of to the likelihood of the entire series of dwell times, is expected to give similar results (see online supplemental material). Accordingly, the two-exponential fit (three parameters) was preferred over the single-exponential (one parameter) if the increase in the log likelihood satisfied ΔLL > ln(2M), where M was the number of bursts fitted (corresponding to a time series of 2M events). Isolated bursts obtained from low-activity records with more than one channel were included if the mean length of those bursts was ≥80% of the mean burst duration obtained from the same patch by multichannel fitting.
Reconstruction of the Time Sequence of Unlocking Events
The prolonged durations of individual “locked” events of channels exposed to mixtures of ATP and AMPPNP were measured in patches with few channels, where abrupt removal of nucleotides generated a staircase-like current decay. A technical difficulty in identifying unlocking time points in such records is that locked channels undergo frequent brief closures (∼50–80 ms, longer than the flickers within normal bursts). When many channels are locked, these flickers can sum to make apparent gaps of hundreds of milliseconds, as if a channel had unlocked but then reopened. In addition, real reopenings also occur occasionally, due to the combined difficulties of instantly completely washing away all nucleotide molecules and of the high affinity of the channels for ATP. Our strategy was to consider the kth channel unlocked once a gap to lower conductance levels was observed with a duration exceeding a defined cutoff. The cutoff was chosen separately for each conductance level, such that the choice equated the probabilities of assigning a particular unlocking event too early or too late. These error probabilities were estimated based on the flicker characteristics, and the apparent reopening rate observed after all channels were unlocked. Longer cutoff times were assigned for higher conductance levels, since flickery closures of more locked channels are more likely to add up to longer gaps. Typical cutoffs ranged from ∼500 ms for conductance level 1 (i.e., the unlocking of the last channel), to ∼2,000 ms for conductance level 10 (unlocking of the first of 10 locked channels). Results were satisfactory (in contrast to the use of a fixed cutoff for all levels) on simulated current traces, and afforded the additional benefit of providing the estimated probabilities for committing an error at each decision (see online supplemental material).
Calculation of Apparent Affinities and Fitting of Macroscopic Current Relaxations
Macroscopic currents, typically originating from hundreds or thousands of channels, were refiltered at 10 Hz, and sampled at 50 Hz. Relative currents at various [ATP] were obtained by normalizing mean steady currents at the test [ATP] to the average of the steady currents at 2 mM ATP measured just before and just after each test application. Decay currents were fitted by single or double exponentials using a least-squares fitter (SigmaPlot 4.0), and the need for a second component was judged empirically.
Single-Channel Conductances
All-points histograms of 10-s current recordings, made in the same patch at −80-, −40-, 0-, +40-, and +80-mV membrane potentials, were fitted with sums of Gaussians. Distances between adjacent peaks were plotted against voltage, and channel conductance obtained as the slope of a straight line fit to each plot. At least three experiments were made for each construct, and mean conductances were compared with that of WT channels using Student's t test.
Temperature Dependence
Records used for kinetic analysis were segregated into pools recorded between 21° and 23°C (termed 22°C), or 24° and 26°C (termed 25°C), and burst and interburst durations were averaged separately. Despite this small temperature range, approximate Q 10 values were tentatively calculated from the Arrhenius equation as Q 10=k 2 k 1 10T2−T1,with corresponding enthalpic activation energies given by E a = [RT 1 T 2/(T 1 − T 2)] · ln(k 1/k 2), where R = 8.31 J mol−1 K−1, and k 1 and k 2 are rates measured at absolute temperatures T 1 and T 2, respectively.
Online Supplemental Material
Further details of some of the analyses applied here are available online at http://www.jgp.org/cgi/content/full/116/3/477/DC1. These include: applying the Schwarz criterion to open-time distributions to distinguish between one or more open states, given a single closed state; reconstructing the time series of unlocking events while equating the probabilities of assigning a given event too early or too late; evaluating the applicability of the three-state Closed-Open-Blocked scheme to data derived from the more complex gating model considered in the discussion; and deriving the observable parameters from such a gating scheme.
RESULTS
Dependence on Phosphorylation of Currents in Severed Channels in Resting and Stimulated Oocytes
Membrane conductance assayed channel function in oocytes injected with cRNA encoding WT CFTR, or CFTR molecules severed just before or just after the R domain, or severed at both points and thus lacking the R domain (Fig. 1; compare Chan et al. 2000). Stimulation of the cAMP/PKA pathway by 50 μM forskolin and 1 mM IBMX did not affect control uninjected oocytes, but elicited similarly large conductances in oocytes injected with 2.5 ng WT CFTR cRNA (173 ± 4 μS, n = 37), or 2.5 ng each of cRNAs encoding Flag3-835 plus 837-1480 (called F835+837; 165 ± 9 μS, n = 14), or 2.5 ng each of cRNAs encoding Flag3-633 plus 837-1480 (called Flag-cut-ΔR; 179 ± 5 μS, n = 5), comparable with those we found for CFTR constructs severed before or after NBD1 (Chan et al. 2000). Resting oocytes expressing WT CFTR displayed a small but significant conductance that reflected a low level of phosphorylation by basally active PKA, because injection of RpcAMPS, an inhibitor of PKA, reduced that conductance (here from 14 ± 1 μS, n = 4, to 6 ± 0.5 μS, n = 5) to near the level seen in resting uninjected oocytes (3 ± 0.3 μS, n = 21; Fig. 1). This implies that constitutively active phosphatases in the resting oocytes are able to dephosphorylate and inactivate the channels after RpcAMPS injection.
Figure 1.

Dependence on phosphorylation by PKA of membrane conductance in resting (basal) and activated oocytes expressing WT CFTR and severed CFTR channels [Flag3-835 plus 837-1480 (F835+837), or Flag-cut-ΔR (F633+837)], and influence of RpcAMPS injection. Bars show mean (±SEM) basal and activated (by 50 μM forskolin plus 1 mM IBMX) conductances of oocytes injected with cRNAs (2.5 or 0.25 ng per construct, as indicated) of the CFTR segments cartooned at left: NH2-terminal Flag epitope (black zigzag); transmembrane domains (blue, cyan); NBD1 (red circle); R domain (green rectangle); NBD2 (yellow circle). Maximal conductances (μS) of oocytes expressing any half-molecule alone were close to that of uninjected oocytes (3 ± 0.3, n = 21): Flag3-633, 2 ± 0.2 (n = 15); Flag3-835, 3 ± 0.4 (n = 10); 634-1480, 5 ± 1 (n = 10); and 837-1480, 3 ± 0.4 (n = 9).
Unlike the small basal conductance of oocytes expressing WT CFTR (or Flag3-633 plus 634-1480 channels; Chan et al. 2000), the conductances of resting oocytes injected with severed constructs F835+837 or Flag-cut-ΔR were relatively large, 82 ± 9 μS (n = 9) or 164 ± 9 μS (n = 4), respectively (Fig. 1). Moreover, in contrast to the abolition of basal conductance by RpcAMPS in oocytes expressing WT CFTR, in the case of F835+837, RpcAMPS reduced the basal conductance only to 33 ± 2 μS (n = 6) and, for Flag-cut-ΔR channels, RpcAMPS hardly reduced the basal conductance at all (150 ± 9 μS, n = 9). Use of only 0.25 ng of each cRNA encoding Flag-cut-ΔR resulted in a smaller basal conductance (71 ± 4 μS, n = 5), again only slightly reduced (to 46 ± 3 μS, n = 2) by RpcAMPS, but there was a significant activation of these channels by forskolin plus IBMX (117 ± 11 μS, n = 5; Fig. 1). These results indicate that PKA-mediated phosphorylation makes a substantial contribution to both the low level of activity of WT CFTR channels and the greater activity of F835+837 channels in resting unstimulated oocytes, whereas the comparatively large basal activity of Flag-cut-ΔR channels is practically independent of phosphorylation by PKA; i.e., it is constitutive. Surprisingly, these Flag-cut-ΔR channels could still be stimulated by PKA, even though they had no R domain. However, the greater increment in conductance upon activating oocytes injected with only 0.25 ng cRNA suggests that the ∼180-μS, apparently maximal, activated conductance (Fig. 1) seen after injecting ≥2.5 ng cRNA (encoding a variety of CFTR channel constructs; compare Chan et al. 2000) might reflect saturation; e.g., of some component in the oocyte cAMP/PKA pathway. Further analysis therefore used excised patches in which the channels could be directly phosphorylated with PKA catalytic subunit.
Though the NH2-terminal Flag is useful for coimmunoprecipitation studies (e.g., for examining possible phosphorylation of cut-ΔR channels), we found that it slowed opening of WT CFTR channels two- to threefold (Chan et al. 2000). We therefore characterized mainly non-Flagged constructs, but also tested Flag-cut-ΔR channels for eventual comparison with biochemical data.
Differential Dependence on Phosphorylation of Macropatch Currents of Various Severed Channels
In excised patches, the strong, membrane-coupled, endogenous phosphatase activity rapidly diminished to negligible levels the low basal activity of WT CFTR channels, and of those formed by segments 1-633 plus 634-1480 (called 633+634), so they could not be activated by MgATP alone (Fig. 2A and Fig. B). But both of these channel types were similarly activated, over 10–20 s, by 300 nM PKA catalytic subunit plus 2 mM MgATP, giving large macropatch currents (Fig. 2A and Fig. B). Also, in both cases, channel activity immediately (within 3–5 s) declined approximately threefold upon removal of PKA in the continued presence of ATP, but was then relatively stable, the remaining current declining much more slowly over several minutes. The simplest interpretation of this biphasic decline is that some phosphorylated residues are dephosphorylated extremely quickly, resulting in partially phosphorylated channels with lower activity, whereas other residues, supporting the residual current, are dephosphorylated with a much slower time course. As expected, all channels shut promptly when ATP was withdrawn.
Figure 2.

Macropatch CFTR currents recorded before, during, and after exposure to 2 mM MgATP with and without 300 nM PKA. (A) WT channels. (B) Severed 633+634 channels. (C) Severed 835+837 channels; note significant current activated by MgATP alone, and robust stimulation by PKA. (D) Flag-cut-ΔR (F633+837) channels; note strong activation by MgATP alone, and small stimulation by PKA. (E) Summary of currents activated by MgATP alone (black bars), normalized to the currents subsequently measured in the same patches in the presence of PKA (striped bars), for constructs 835+837 (0.19 ± 0.03, n = 12), cut-ΔR (633+837, 0.78 ± 0.01, n = 6), and Flag-cut-ΔR (F633+837, 0.71 ± 0.03, n = 24); normalized basal current of Flag-cut-ΔR channels was unaltered (0.78 ± 0.04, n = 10, gray bar) in patches from oocytes preinjected with RpcAMPS to inhibit endogenous PKA.
Patches containing channels formed by segments 1–835 plus 837–1480 (called 835+837) generated a significant current when MgATP alone was applied, even before PKA exposure (Fig. 2 C). Nevertheless, subsequent application of PKA increased this macroscopic current severalfold.
Cut-ΔR channels, with (see Fig. 2 D and 6 E), or without (see Fig. 6 D) the Flag, displayed substantial activity in response to MgATP alone. Furthermore, superfusion with PKA increased current ∼30–50% in patches containing Flag-cut-ΔR (Fig. 2 D) or cut-ΔR channels (compare Fig. 6D and Fig. E, below), even though they lacked the entire R domain (residues 634–836), suggested to contain all, or most, of the phosphorylation sites responsible for channel activation (e.g., Rich et al. 1993; Seibert et al. 1995, Seibert et al. 1999).
Figure 6.
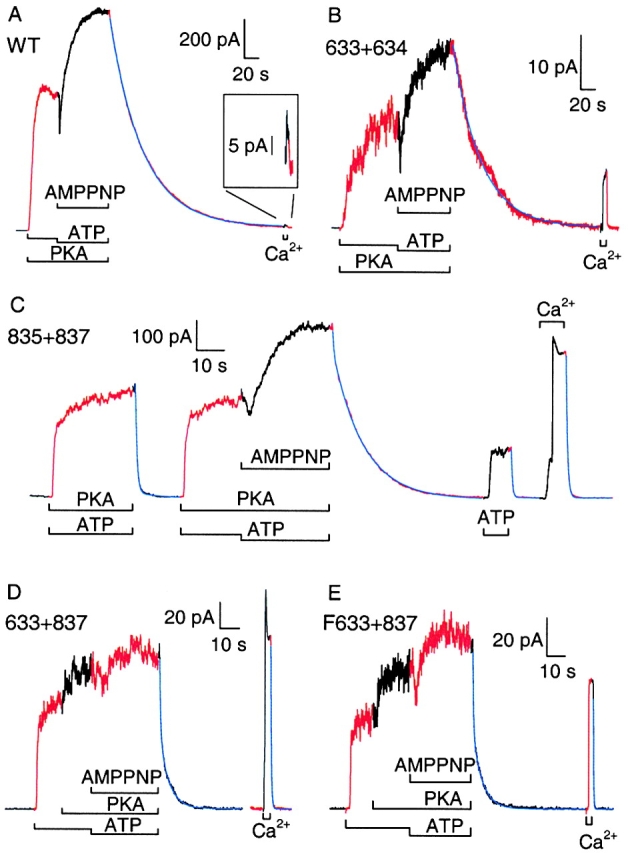
AMPPNP added with ATP causes slow current relaxation after removal of nucleotides in WT and severed channels. Channels at ∼24°C (23°–25°C) were activated by 2 mM MgATP with or without 300 nM PKA, and then locked open with 1 mM AMPPNP plus 0.1 mM ATP in PKA; brief stimulation of Ca2+-activated Cl− channels with 2 mM Ca sulfamate indicated solution exchange time. (A) WT CFTR; blue line is a single exponential, with τ = 47 s. (B) 633+634 channels; blue line is a single exponential, with τ = 38 s. (C) 835+837 channels; fit to current decay after AMPPNP is double exponential, with time constants and amplitudes, τ1 = 337 ms, τ2 = 11 s, and a 1 = 63 pA, a 2 = 501 pA. (D) cut-ΔR (633+837) channels; fit to current decay after AMPPNP is double exponential, with τ1 = 439 ms, τ2 = 4.7 s, and a 1 = 57 pA, a 2 = 59 pA. (E) Flag-cut-ΔR (F633+837) channels; fit to current decay after AMPPNP is double exponential, with τ1 = 364 ms, τ2 = 5.2 s, and a 1 = 41 pA, a 2 = 40 pA.
Fig. 2 E summarizes, for the three constructs that gave measurable currents before PKA application, the relative amplitudes of these initial currents in MgATP alone (black bars), normalized to the maximal currents recorded subsequently in the same patches in the presence of PKA (striped bars; normalization was necessary, as channel number varied greatly from patch to patch: compare the large variability in macroscopic current sizes in this and later figures). This initial current, the component of basal whole-oocyte current that survives patch excision, likely reflects phosphorylation-independent activity, because preinjection of oocytes with RpcAMPS (which effectively abolished basal activity of WT channels; Fig. 1) 10–30 min before patch excision, did not alter the fractional response of Flag-cut-ΔR channels to subsequently applied PKA (Fig. 2 E, gray vs. black bars). This implies that by the time (typically ∼2 min) recordings were begun in excised patches, any basally phosphorylated residues capable of enhancing channel activity had already been dephosphorylated by membrane-associated phosphatases.
Kinetic Characterization of Channel Activity in the Presence and Absence of PKA
The macroscopic current traces in Fig. 2 point to important differences among the various severed channels, but offer no insight into the underlying kinetic causes. Fig. 3 A shows for each construct a representative current record in which individual channel gating transitions can be discerned. Exposure of WT or 633+634 channels to 2 mM MgATP for 2 min resulted in no channel openings (Fig. 3 A, top two traces), although subsequent application of PKA caused immediate robust activation of a single channel for WT, and of at least three channels for 633+634: for both of these channel types, activity sharply declined after PKA removal. In the center trace, recorded from a patch containing four channels formed by segments 835+837, a small but significant number of openings were seen initially in MgATP alone, but subsequent exposure to PKA resulted in a large increase in their frequency. The initial segment of the cut-ΔR trace also shows substantial channel activity in MgATP alone, but that activity resulted from only a single channel and so reflects a considerably higher constitutive P o than that of 835+837 channels. PKA increased the frequency of openings of the cut-ΔR channel, but the increase was much smaller than seen for 835+837. The Flag-cut-ΔR construct behaved like its Flag-less counterpart.
Fig. 3 (B–D) and Table summarize kinetic analyses of segments of records obtained during application of PKA (striped bars) or after its removal (gray bars) for WT and 633+634 channels, as well as before (black bars) or during (striped bars) PKA application for constructs 835+837, cut-ΔR, and Flag-cut-ΔR. In PKA, the P o of WT channels was ∼0.36, whereas the P o of the severed constructs was somewhat lower, ∼0.2 (Fig. 3 B). The P o dropped three- to fourfold for WT and 633+634 channels after PKA removal. The constitutive open probabilities, before PKA exposure, were ∼0.04 for 835+837 and ∼0.13 for the two constructs lacking the R domain.
Table 1.
Po and Kinetic Parameters
| Construct | WT | n | 633+634 | n | 835+837 | n | 633+837 | n | F633+837 | n |
|---|---|---|---|---|---|---|---|---|---|---|
| P o(+) | 0.36 ± 0.03 | 19 | 0.22 ± 0.03 | 7 | 0.22 ± 0.06 | 5 | 0.19 ± 0.01 | 13 | 0.21 ± 0.02 | 9 |
| P o(−) | 0.09 ± 0.02 | 5 | 0.04 ± 0.01 | 4 | 0.04 ± 0.01 | 3 | 0.13 ± 0.01 | 18 | 0.13 ± 0.01 | 13 |
| P o(+)/P o(−) | 4.11 ± 1.04 | 5 | 5.02 ± 0.83 | 6 | 7.03 ± 1.32 | 6 | 1.60 ± 0.17 | 15 | 1.53 ± 0.10 | 11 |
| τb(+) | 771 ± 92 | 19 | 554 ± 21 | 8 | 336 ± 36 | 8 | 297 ± 35 | 15 | 493 ± 64 | 13 |
| τb(−) | 264 ± 45 | 5 | 240 ± 26 | 6 | 312 ± 50 | 7 | 432 ± 55 | 24 | 429 ± 54 | 18 |
| τb(+)/τb(−) | 2.94 ± 0.60 | 5 | 2.96 ± 0.40 | 6 | 1.06 ± 0.16 | 6 | 0.88 ± 0.07 | 15 | 1.05 ± 0.07 | 12 |
| τib(+) | 1364 ± 158 | 19 | 2380 ± 703 | 7 | 1341 ± 459 | 5 | 1297 ± 181 | 13 | 1583 ± 273 | 9 |
| τib(−) | 2900 ± 606 | 5 | 8172 ± 4187 | 4 | 9895 ± 4111 | 3 | 3055 ± 666 | 18 | 2678 ± 467 | 13 |
| τib(+)/τib(−) | 0.62 ± 0.16 | 5 | 0.55 ± 0.11 | 6 | 0.17 ± 0.05 | 5 | 0.58 ± 0.07 | 15 | 0.67 ± 0.06 | 11 |
Mean ± SEM burst and interburst durations (ms) and P o in 2 mM MgATP with (+) or without (−) 300 nM PKA at 21°–26°C. Ratios were estimated individually for patches where both conditions were assayed, and then averaged. n, number of observations.
In the presence of PKA (Fig. 3 C, striped bars), all severed constructs are characterized by open (burst) durations of ∼300–500 ms, significantly shorter than for WT channels in PKA (∼800 ms). After PKA removal, 633+634 channels, like WT channels, showed a considerable reduction of mean burst duration, in both cases resulting in bursts of only ∼200–250 ms (gray bars). In contrast, the burst durations of 835+837, cut-ΔR, and Flag-cut-ΔR channels changed little, if at all, when PKA was added or removed (Fig. 3 C, black vs. striped bars for those constructs).
During exposure to PKA, the interburst durations (closed intervals) were similar (∼1,500 ms) for WT and all the severed constructs (Fig. 3 D, striped bars). The sudden drop in P o of WT and 633+634 channels upon PKA removal (Fig. 2A and Fig. B, and Fig. 3A and Fig. B) partly reflected increased closed intervals (Fig. 3 D), in addition to briefer openings (Fig. 3 C). The strong activation of 835+837 channels by PKA, as well as the more modest stimulation of cut-ΔR and Flag-cut-ΔR, was due to shortening of the interburst durations that, in the absence of PKA, were very long (∼10 s) for 835+837 channels, but less so (∼3 s) for the constructs with no R domain (Fig. 3 D).
Macroscopic Currents Suggest Increased Apparent ATP Affinity of Channels Cut After the R Domain
To see whether severing these CFTR molecules around the R domain influenced the dependence of channel P o on ATP concentration, we measured steady currents in macropatches at various [ATP] and normalized them to that at 2 mM ATP. The tests were performed in the absence of PKA (i.e., in the constitutive, basal state) for cut-ΔR and Flag- cut-ΔR channels, but after PKA removal for WT, 633+634, and 835+837 channels (since for the latter construct prephosphorylation activity was fairly small).
Comparison of such measurements for WT and cut-ΔR channels at 2–1,000 μM ATP, each test bracketed by steps to 2 mM ATP, reveals that half-maximal activity of WT channels requires ∼50 μM ATP (Fig. 4 A), whereas for cut-ΔR channels 20 μM ATP is sufficient (Fig. 4 B). Results from experiments like these are summarized in Fig. 4 C. The curves show Michaelis-Menten fits, yielding K m estimates (μM) of 51 ± 2 for WT (•), 25 ± 1 for cut-ΔR (▿), and 23 ± 1 for Flag-cut-ΔR (▴).
Figure 4.

Apparent affinity for ATP as reflected by Po, after PKA removal for WT, 633+634, and 835+837 channels, and before applying PKA for cut-ΔR and Flag-cut-ΔR channels. (A) Macroscopic currents from representative patches containing WT channels in response to step application and removal of 2 mM [ATP] with intervening 10–30-s test exposures to 2, 10, 20, 50, 100, and 500 μM, and 1 mM [ATP], respectively; scale bars indicate 5 pA and 10 s.(B) Records from representative patches containing cut-ΔR (633+837) channels; protocol and labeling as in A. (C) Summary of activation of macroscopic current by [ATP] for WT (•), cut-ΔR (▿), and Flag-cut-ΔR (▴) channels, from experiments like those in A and B. Average amplitude of steady current near the end of each 10–30-s test exposure was normalized to the mean of the average sizes of the steady currents at 2 mM ATP in that patch just before and after the test. The solid line is a Michaelis fit to the data for WT channels; K m = 51 ± 2 μM. The dotted line is the fit for Flag-cut-ΔR channels; K m = 23 ± 1 μM. The fit for cut-ΔR channels overlies the dotted line and was omitted for clarity; K m = 25 ± 1 μM. Fitting the same data to the Hill equation yielded Hill coefficients of 0.98 ± 0.06 for WT, 0.84 ± 0.05 for cut-ΔR, and 0.99 ± 0.08 for Flag-cut-ΔR channels. (D) Summary of relative current at 50 μM ATP (I50μM/I2mM) for WT CFTR and all the severed constructs; the ratio I50μM/I2mM provides a rough measure of apparent affinity, because 2 mM ATP was a saturating concentration for each construct (I1mM/I2mM ratios were: 1.34 ± 0.10 for 633+634; 1.03 ± 0.02 for 835+837; ∼1.0 for the other three constructs, C). *I50μM/I2mM value significantly higher (P < 0.01) than for WT channels.
Fig. 4 D summarizes relative currents at 50 μM ATP (normalized to those at 2 mM ATP) for all constructs, including 633+634 and 835+837, for which dose–response curves were incomplete. The I50μM/I2mM ratio of 633+634 channels (0.51 ± 0.02) was not significantly different (P > 0.1) from WT (0.50 ± 0.02), but that ratio for 835+837 (0.71 ± 0.02), cut-ΔR (0.62 ± 0.01), and Flag-cut-ΔR channels (0.66 ± 0.02) was in each case significantly higher than for WT (P < 0.01; Student's t test).
The Macroscopic Response to ATP Reflects the [ATP] Dependence of the Opening Rate
We analyzed channel kinetics to see whether [ATP] influenced burst or interburst duration, or both. Partially phosphorylated WT channels were examined shortly after PKA removal, and constitutively active Flag-cut-ΔR channels were studied without applying PKA (Fig. 5 A). The rate constants for channel opening (r CO; C-O-B, see methods) and closing (r OC) extracted from quasi-stationary activity at each [ATP] are shown normalized to their respective values at 2 mM ATP in the same patch (Fig. 5B and Fig. C). Whereas the closing rates varied little with [ATP] for either construct under these conditions, the opening rates were strongly dependent, the Michaelis fits to the data points giving K m estimates of 46 ± 13 μM for WT and 39 ± 7 μM for Flag-cut-ΔR.
Removal of ATP and AMPPNP Reveals a Slow Component in the Macroscopic Current Relaxation
We tested whether exposing macropatches to AMPPNP plus ATP in the presence of PKA could lock open these severed channels. Upon removal of all nucleotides, no further channel openings should occur (e.g., Fig. 2), and the current relaxation should then reflect the rate of channel closure. Solution exchange rate (time constant 200–600 ms), estimated from closure of endogenous Ca2+-activated Cl− channels, was an order of magnitude faster than the fastest unlocking rates found here. Fig. 6 shows a representative record for each construct (and Table summarizes all the results). Once channel current was steady in 300 nM PKA with 2 mM MgATP, the [ATP] was decreased to 0.1 mM and 1 mM AMPPNP was added. In all cases, an initial current drop, due to both the decreased [ATP] and competition from AMPPNP for the site of channel opening, was followed by robust activation. For WT (Fig. 6 A) and 633+634 (B) channels, after withdrawal of all nucleotides, the current decayed to zero with an exponential time course (fitted blue lines) of time constant 47 and 38 s, respectively, reflecting the mean dwell time of AMPPNP on those channels.
Table 2.
Time Constant and Fractional Amplitude of Slow Component of Current Decay after AMPPNP Removal
| Construct | τAMPPNP | a locked | n |
|---|---|---|---|
| WT | 39136 ± 3646 | 0.90 ± 0.07 | 9 |
| 633+634 | 58052 ± 14447 | 1.00 ± 0.00 | 4 |
| 835+837 | 7310 ± 1027 | 0.59 ± 0.09 | 9 |
| 633+837 | 5841 ± 423 | 0.47 ± 0.04 | 8 |
| F633+837 | 8161 ± 2203 | 0.65 ± 0.11 | 5 |
Mean ± SEM time constants (τAMPPNP; ms) and fractional amplitudes (a locked), measured at ∼24°C; n, number of patches.
Mean ± SEM time constants (τAMPPNP; ms) and fractional amplitudes (a locked), measured at ∼24°C; n, number of patches.
For 835+837 channels, the AMPPNP test was bracketed by applications of ATP, one with and one without PKA, the latter followed by the brief Ca2+ pulse; fits were made to all four decay time courses (Fig. 6 C). The first, after removal of ATP plus PKA, required two exponential components for a good fit, with time constants τ1 = 623 ms and τ2 = 10.3 s, and amplitudes a 1 = 365 pA and a 2 = 25 pA, respectively. The relaxation after AMPPNP withdrawal also needed two components, with time constants τ1 = 337 ms and τ2 = 11 s, and amplitudes a 1 = 63 pA and a 2 = 501 pA, respectively. But the last two current decays, after removal of ATP and of Ca2+, were both well fit by single exponentials with respective time constants, 429 and 568 ms. Because the fast components in the first two relaxations, and the entire third decay, were all comparable with the Ca2+ washout, they likely reflect solution exchange time and so were not studied further. AMPPNP, with PKA and ATP, evidently introduced a large slow component in the current decay after its removal. However, in contrast to the results with WT and 633+634 channels, the decay on removing AMPPNP also included a fast component, suggesting that not all 835+837 channels contributing to the steady state current in the presence of ATP and AMPPNP were in the locked-open state. Further, the apparent dwell time of AMPPNP on the locked channels (11 s) was considerably shorter than for the WT-like constructs, implying a faster dissociation of AMPPNP from 835+837 channels (note expanded time scales in Fig. 6, C–E).
Cut-ΔR and Flag-cut-ΔR channels displayed constitutive activity on initial exposure to ATP, discernible stimulation by PKA, further activation by AMPPNP, and current decays upon nucleotide removal that required double-exponential fits (Fig. 6D and Fig. E): the time constants and amplitudes were τ1 = 439 ms, τ2 = 4.7 s, a 1 = 57 pA, and a 2 = 59 pA for cut-ΔR; and τ1 = 364 ms, τ2 = 5.2 s, a 1 = 41 pA, and a 2 = 40 pA for Flag-cut-ΔR. For these two patches, the Ca2+-washout time constants were 372 and 212 ms.
Prolonged Bursts in AMPPNP Underlie the Slow Current Decay After AMPPNP Removal
In patches with few channels, AMPPNP plus ATP elicited long open bursts in all constructs. Withdrawal of nucleotides then caused a staircase-like current decay in which individual unlocking events could be identified, as illustrated by traces from WT (Fig. 7 A) and cut-ΔR channels (C). Adding up idealized unlocking sequences (red lines; see methods; Fig. 7A and Fig. C) from two tests on WT (B) and five tests on cut-ΔR channels (D), and fitting the resulting relaxations with single exponentials, yielded time constants (representing mean burst durations) of 31 s for WT and 6.4 s for cut-ΔR; a similar procedure with four tests on Flag-cut-ΔR channels gave a time constant of 9.3 s. The mean durations of these long open bursts induced by AMPPNP agree well with the time constants of the slow component of the macroscopic current relaxations on AMPPNP removal (Fig. 6, Table ).
Burst Distributions Imply Different Mechanisms of Shorter Mean Burst Durations of Cut Channels
In PKA, the mean burst durations of all the severed constructs were similarly shortened, relative to WT (Fig. 3 C). To further dissect the mechanisms responsible for these shorter bursts, we analyzed the distribution of the burst durations for each construct, after excluding flickery closures (methods). As PKA seemed to affect the burst durations of 835+837, cut-ΔR, and Flag-cut-ΔR channels little (Fig. 3 C; Table ), records in the absence or presence of PKA were pooled for those constructs to increase the number of events for fitting. But, for WT and 633+634 channels, segments recorded during or after PKA were analyzed separately. The burst duration distributions were maximum likelihood-fitted with both single- and double-exponential functions, and the need for the second component accepted or rejected based on its improvement of the likelihood (see methods).
The distributions are displayed in Fig. 8 in the form of survivor functions; i.e., the probability that a channel is still in the burst state after time t, provided it was in the burst state at time zero, is plotted against time. The distributions for WT and 633+634 in the presence (“+”; top, first and third panels) and absence of PKA (“−”; top, second and fourth panels) were all well fit by single exponentials, and introduction of a second component did not significantly improve the likelihood. The time constants, 778 and 461 ms for WT and 633+634 channels, respectively, in the presence of PKA agree well with their mean burst durations obtained from multichannel kinetic fits under the same conditions (771 and 554 ms, respectively; Fig. 3 C, striped bars; Table ). Also, after removal of PKA, the fitted time constants, 263 and 214 ms, for WT and 633+634, matched the estimated mean burst durations of 264 and 240 ms, respectively, under those conditions (Fig. 3 C, gray bars; Table ).
Figure 8.

Distributions of burst durations of WT and severed channels. Dwell times of individual bursts, after omitting flickery closures, were ranked by duration in descending order, and rank numbers, divided by the total number of events, were plotted against duration to yield survivor functions. Parameters for fits (solid lines) by single or double exponentials were obtained directly from the events lists by maximum likelihood; the need for a second component was evaluated from its improvement of the likelihood. WT and 633+634 channels were analyzed separately in PKA (+) and after PKA removal (−); for 835+837, cut-ΔR (633+837), and Flag-cut-ΔR (F633+837) channels, analysis used pooled data that included segments with and without PKA. Time constants (τ) and fractional amplitudes (a) are printed in each panel and, for 835+837, cut-ΔR, and Flag-cut-ΔR, τsh, τl, a sh, and a l, are also listed (with their error estimates; half-widths of 0.5 unit likelihood intervals) in Fig. 11 as observed parameters. For WT and 633+634, τ in PKA is given (with error estimates) in Fig. 11 as τl; after PKA removal, τ = 263 ± 9 ms for WT and τ = 214 ± 27 ms for 633+634.
For 835+837, cut-ΔR, and Flag-cut-ΔR channels, the likelihood was significantly improved by introducing a second component into the fits of the distributions (Fig. 8, bottom). The brief components, accounting for the larger fraction of events in all three cases, had time constants close to those observed for WT and 633+634 channels in the absence of PKA. However, in all three cases, a long component was also clearly discernible, with a time constant resembling that for WT in the presence of PKA.
Strong Temperature Dependence of Burst Durations and Locking Behavior
The experiments in Fig. 3 and Fig. 8 were performed at ambient room temperature, which varied between extremes of 21° and 26°C and was noted on each experimental day. Data were separated, in retrospect, into pools recorded between 21° and 23°C (referred to as 22°C), and between 24° and 26°C (referred to as 25°C). Mean burst durations were re-evaluated separately for the two temperature pools for WT, 835+837, cut-ΔR, and Flag-cut-ΔR channels (all 633+634 data fell into the same, 22°C, pool). For WT channels, only segments recorded in the presence of PKA were included, while records in the absence or presence of PKA were included for the other constructs. The results, presented in Table , suggest a large temperature dependence of the burst durations for all constructs. Though the temperature range sampled was far too small to provide accurate estimates, these data suggest a Q 10 for closure of WT channels in the presence of PKA of 2.8, predicting an enthalpic activation energy of 75 kJ/mol. The influence of temperature on burst duration appeared even more pronounced for the three cut constructs, giving Q 10 estimates of 4.0, 4.0, and 5.3 for 835+837, cut-ΔR, and Flag-cut-ΔR channels, corresponding to apparent enthalpic activation energies for channel closure of 100, 102, and 122 kJ/mol, respectively.
Table 3.
Burst Durations for 22° and 25°C Pools, for WT and Severed Channels
| Construct | τb(22°C) | n | τb(25°C) | n | τb(22)/τb(25) | Q 10 | Apparent Ea |
|---|---|---|---|---|---|---|---|
| WT (+PKA) | 896 ± 144 | 9 | 659 ± 113 | 10 | 1.36 | 2.8 | 75 |
| 835+837 | 445 ± 49 | 3 | 295 ± 29 | 12 | 1.51 | 4.0 | 100 |
| 633+837 | 429 ± 52 | 26 | 282 ± 33 | 13 | 1.52 | 4.0 | 102 |
| F633+837 | 554 ± 58 | 17 | 336 ± 39 | 14 | 1.65 | 5.3 | 122 |
Mean ± SEM (n, number of observations) burst durations (ms) for WT (with PKA) and for the other constructs (with or without PKA); apparent E a is in kJ/mol.
AMPPNP was tested on cut-ΔR channels at 20°C (under temperature control; Fig. 9). At this lower temperature, AMPPNP caused a larger amplitude activation (even in the complete absence of PKA; compare with 24°C, Fig. 6 D) and, in the patch illustrated, the decay after AMPPNP removal was well fit by a single exponential, with 18-s time constant. In five experiments on cut-ΔR channels at 20°C, the slow component averaged 0.71 ± 0.08 of the total current decay, and its average time constant was 13.5 ± 2 s.
Figure 9.

Enhanced stimulation of cut-ΔR (633+837) channel current by AMPPNP at 20°C without exposure to PKA; the current decay after nucleotide removal was well fit by a single exponential (fit line), τ = 18 s.
Severed Channels with no R Domain, but with NBD2 Walker-A Mutation, Display Prolonged Bursts
To probe the role of NBD2 function in cut-ΔR channels, we introduced the Walker-A lysine (Walker et al. 1982) mutation in NBD2, K1250A. In excised patches, cut-ΔR(K1250A) channels had similar conductance to WT CFTR, required MgATP for activity but (like the other cut channels with no R domain) were active without exposure to PKA, and their activity was dominated by long open bursts, each interrupted by many (six to eight on average) flickery closures (Fig. 10 A; note time scale).
Kinetic analysis proved difficult because burst and interburst durations were both prolonged, hampering collection of sufficient numbers of relevant gating transitions, and the distribution of closed events was heavily dominated by the flickery closures (with mean duration ∼80 ms). Nevertheless, multichannel histogram fits gave mean burst durations of 5.0 ± 0.7 s at 25°C (n = 5), and 9.5 ± 1.4 s at 20°C (n = 3). Consistent with the interpretation that the prolonged bursts reflect nonhydrolytic binding of ATP at NBD2, these mean burst durations of cut-ΔR(K1250A) were comparable with the time constants of the slow components of current relaxation after exposure of cut-ΔR channels to AMPPNP at the corresponding temperatures (5.8 ± 0.4 s and 13.5 ± 2 s at 25° and 20°C, respectively; Fig. 6 D and 9; and Table ).
To avoid the difficulties of steady state kinetic analysis, we examined the current relaxation after ATP removal in patches containing cut-ΔR(K1250A) channels. Because patches with more than 10–20 channels were rare, ATP removal experiments were repeated and the records later summed to produce quasi-macroscopic current relaxations. The current decay of Fig. 10 B, constructed from nine ATP removal experiments at 25°C, yielded a single exponential fit with a time constant 6.7 s, in reasonable agreement with the steady state estimate of the mean burst duration at that temperature. The inset trace, constructed from seven experiments at 20°C, has a fit time constant of 10.1 s, also similar to the corresponding steady state estimate of mean burst duration.
Analysis of the <100 isolated bursts recorded from cut-ΔR(K1250A) channels indicated a double-exponential distribution (Fig. 10 C), suggesting two distinct populations of bursts, although both components seemed approximately fivefold slower than their counterparts for cut-ΔR channels.
Single-Channel Conductance Is Unaltered in Severed CFTR Channels
We examined whether conductance of the severed channels was similar to that of WT CFTR channels, by recording unitary currents in patches held at potentials between −80 and +80 mV and exposed to 2 mM MgATP and symmetrical 140 mM [Cl−]. Current–voltage plots were constructed from the distances between peaks in sums of Gaussians fitted to all-points histograms. All were linear, giving single-channel conductances (pS) of 6.3 ± 0.2 (n = 3) for 633+634, 7.6 ± 0.2 (n = 3) for 835+837, 7.1 ± 0.3 (n = 4) for cut-ΔR, and 7.6 ± 0.1 (n = 4) for Flag-cut-ΔR, none of which differed significantly from WT (6.8 ± 0.3, n = 4; P < 0.05), indicating that the gross pore architecture of these severed constructs remained intact.
DISCUSSION
Evaluation of Suitable Gating Models
The results presented here address the role of the R domain in regulating the interactions of nucleotides with the NBDs that somehow control opening and closing of CFTR channels. Before discussing their implications, an appropriate gating model must be chosen. Our data are consistent with models with two ATP binding sites, one responsible for opening the channel, the other for stabilizing its open (burst) state. Three such gating schemes have been proposed recently (Gadsby and Nairn 1999; Weinreich et al. 1999; Zeltwanger et al. 1999) that, although differing in detail, share common features (Hwang et al. 1994; Gadsby and Nairn 1994), including assigning NBD1 the principal role of channel opening and NBD2 that of channel closing. The latter is supported by the prolonged open bursts that result from mutations of the NBD2 Walker-A lysine, K1250 (Carson et al. 1995; Gunderson and Kopito 1995), known to disrupt ATP hydrolysis there (Ramjeesingh et al. 1999). All three schemes propose that two steps precede channel opening: first, the site responsible for opening (presumed to be NBD1), empty at the start of each interburst closure (state C1), reversibly binds ATP (state C2), after which a rate-limiting step (likely related to hydrolysis) leads to channel opening (state O1). Open channels can then either simply close (back to state C1) by losing the hydrolysis products from NBD1 (resulting in brief openings), or bind ATP at a second site (presumed to be NBD2), resulting in stabilization of the open state (state O2; long openings). After hydrolysis of ATP at NBD2, in one model (Zeltwanger et al. 1999), hydrolysis products at NBD2 are lost first, returning the channel to O1, from which it can either close (to C1) or rebind ATP at NBD2 (returning to O2). In the other two models, ATP hydrolysis at NBD2 results in loss of hydrolysis products from both NBDs, and channel closure (back to C1). The latter models can be simplified to Fig. 1, while that of Zeltwanger et al. 1999 reduces to Fig. 2.
Scheme S1.

Scheme S2.

Forward and backward rate constants between states C1 and C2 are not made explicit, since no attempt was made to estimate them in the present study. By fitting the distribution of interburst durations, Zeltwanger et al. 1999 proposed a rapid equilibrium between the two closed states (k off,ATP = 6.5 s−1), whereas Weinreich et al. 1999 suggested a slow k off for nucleotides (k off,ADP ∼0.4 s−1, k off,AMPPNP ∼0.05 s−1), based on fits to macroscopic relaxations after step changes in nucleotide concentrations. Both schemes predict a simple Michaelis-Menten type dependence of channel opening rate on [ATP], consistent with observation (Fig. 5 B). The strong dependence of WT burst durations on phosphorylation (Fig. 3 C and 8) can be explained by an effect on rate k 2 (reflecting ATP binding at NBD2): in poorly phosphorylated channels k 2 << k −1, so most openings proceed directly from O1 to C1. But in highly phosphorylated channels, k 2 is large, so transition O1 → O2 will be favored, increasing burst duration (assuming k 3 < k −1). When k 2 is comparable to k −1, a mixture of short and long openings is expected; never observed for WT channels here, but shown for constructs 835+837, cut-ΔR, and Flag-cut-ΔR (Fig. 8; compare Dousmanis et al. 1996). Rate k −2 represents dissociation of ATP from NBD2 and, assuming that its structural analog AMPPNP (Yount 1975) has comparable binding kinetics, the slow apparent dissociation of AMPPNP from WT channels (Fig. 6 and Fig. 7; compare Fig. 10) suggests that k −2 is very small (∼0.02 s−1); so channels mostly exit from O2 via k 3. Though drawn as one step, in both schemes, the latter pathway transits a series of states involving hydrolysis and release of products from NBD2 (also from NBD1 for Fig. 1). Unlike the other explicit rate constants, which are all first-order, k 2 is pseudo–first order and scales with [ATP]. If that step were a simple bimolecular binding reaction, Fig. 2 would predict infinitely long burst durations at very high [ATP], because for k 2 >> k −1 a channel would incessantly cycle between O1 and O2. Zeltwanger et al. 1999 found burst durations to saturate at high [ATP] (Fig. 5 C) and so proposed that ATP binding at NBD2 follows a rate-limiting dissociation of ADP from that site. (Strictly, if ADP leaves NBD2 during O1 → O2, that step is irreversible in the absence of ADP, and WT channels unlocking from AMPPNP, or K1250A channels closing from long bursts in ATP, must close through a state distinct from O1: the four-state schemes are clearly oversimplified.) For high k 2, Fig. 1 predicts that most openings proceed from O1 to O2, and thence to C1, producing a uniform population of openings with durations approximating the lifetime of state O2, ∼1/k 3.
Choosing Between Fig. 1 and Fig. 2
Although Fig. 1 and Fig. 2 are both consistent with the mean burst durations found here under various conditions, they differ in their predictions for the distribution of burst durations. As a first approximation, we assume that, among the rates influencing open time (i.e., k −1, k 2, k −2, k 3) in WT channels, only k 2 is altered by phosphorylation. The short bursts of partially phosphorylated WT channels here agree with those found by Zeltwanger et al. 1999 for phosphorylated channels at very low [ATP]. Since under both conditions (when k 2 << k −1), k −1 is the reciprocal of the mean burst duration, these results suggest that k −1 does not change dramatically with phosphorylation, and is ∼3–4 s−1 for WT CFTR. For Fig. 2, the mean burst duration is τb = (1/k −1) · {1 + [k 2/(k 3 + k −2)]}. With fixed rate constants k −1 and k −2, and a given observed τb, this equation puts a linear constraint on k 2 and k 3: k 3 = (τb k −1 − 1)−1 · k 2 − k −2. Though any pair of k 2 and k 3 values that satisfies this constraint will fit the mean of the observed burst durations, their distribution will vary for different pairs. With rates k 2 and k 3 on the order of those proposed by Zeltwanger et al. 1999 (∼1 s−1), and applying the above constraint to match τb found here, Fig. 2 predicts a distribution with two components that ought to be distinguishable. For example, rates k −1 = 3.8 s−1, k 2 = 2 s−1, k −2 = 0.025 s−1, k 3 = 1 s−1, respectively, predict mean τb = 777 ms, close to that observed here for WT channels in PKA, but they also predict a distribution with two components, with time constants τsh = 161 ms, τl = 1,591 ms, and fractional amplitudes a sh = 0.57 and a l = 0.43, respectively, in contrast to the uniform distribution found (Fig. 8). Simulating 160 events (far fewer than obtained in this study) for Fig. 2 with the above rates, and fitting the distribution of open times with two exponentials, gave estimates τsh = 171 ms, τl = 1,276 ms, a sh = 0.51 and a l = 0.49, and a 24-log-unit increase in likelihood over that of a single-exponential fit, indicating a significantly better fit by two components. This set of rate constants is therefore not consistent with the uniform distribution of burst durations observed here for WT channels in PKA.
It is nevertheless possible to find a set of rates for Fig. 2 that predicts a uniform distribution of burst durations. As k 2 and k 3 are made faster, while observing the above linear constraint, both time constants of the distribution progressively shorten, while the fractional amplitudes shift in favor of the longer component, until, with k 2 and k 3 very fast, the distribution becomes nearly uniform. Qualitatively, each opening contains many brief passages to state O2, while the observed apparent closing rate essentially becomes k −1 multiplied by the fraction of time open channels spend in the O1 state. In practice, with k 2 ∼20 s−1 and a corresponding k 3 of ∼10 s−1, identification of two components in the distribution of open times from simulated data became difficult. However, such large rates are inconsistent with studies on macroscopic relaxations of WT CFTR currents upon removal of ATP (Weinreich et al. 1999). Using high-speed solution exchange compatible with resolution of CFTR gating, those authors found a slow component in the current decay when ATP was removed together with, or shortly after, but not if long after, PKA. Fig. 2 with k 3 >> k −1, however, predicts that all channels shut quickly, essentially with rate k −1, once ATP is removed (when k 2 ∼ 0).
Fig. 1 thus seemed easier to fit to our results, and so will be used for their subsequent interpretation. Findings related to channel opening are discussed first, followed by observations that bear on channel closing.
Slightly Increased Apparent ATP Affinities of Channels Severed Near R-domain COOH Terminus
Previous studies have revealed a dependence on phosphorylation of CFTR's apparent affinity for ATP, from comparisons of P o vs. [ATP] relationships, either for WT CFTR channels with or without PKA (Winter and Welsh 1997), or for phosphorylated WT channels versus mutants lacking one or more R-domain serines (Winter and Welsh 1997, Mathews et al. 1998a). Correspondingly, pretreatment of purified, reconstituted WT CFTR with PKA lowered the K m of the ATP hydrolysis rate approximately threefold, compared with untreated CFTR (Li et al. 1996). Based on these findings, and the effect of phosphorylated R-domain peptide on ΔR(708-835)-S660A channels, the phosphorylated R domain was proposed to stimulate channel activity by enhancing the affinity of CFTR for ATP (Winter and Welsh 1997). In the present study, apparent ATP affinities for activating P o in cut-ΔR and Flag-cut-ΔR channels without PKA were approximately twofold higher than in WT after removing PKA (Fig. 4). Because WT channels under these conditions are expected to be at least partially phosphorylated, and yet their K 0.5 measured by P o is still larger than for channels with no R domain, this result is more consistent with the unphosphorylated R domain inhibiting ATP binding, and with the increase in apparent affinity caused by PKA reflecting a graded disinhibition; full disinhibition occurs in severed channels with no R domain, as reported by their higher apparent affinity. Also consistent with these data, when experiments like those of Fig. 4 were performed on WT channels in the presence of PKA, a Michaelis fit to a more limited data set yielded a slightly smaller K m of 38 ± 7 μM (compared with 51 ± 2 μM after removing PKA; Fig. 4).
Moreover, the higher I50μM/I2mM ratio of 835+837 channels compared with WT (both after PKA removal), suggests that a simple cut close to the COOH terminus of the R domain, while only partially relieving the inhibitory effect of the unphosphorylated R domain on the rate-limiting step for channel opening (compare low basal opening rate; Fig. 3 D), may still be sufficient to fully relieve the inhibition on ATP binding. Interestingly, a half-channel truncated at that same cut site (D836X; Sheppard et al. 1994) also showed a low level of constitutive activity, but was strongly activated by PKA, and had a high apparent affinity for ATP, properties reminiscent of those described here for 835+837 channels. However, we found no measurable conductance in resting or stimulated oocytes injected with RNA encoding a similar half-molecule, Flag3-835 (Fig. 1, legend), and so it was not examined in excised patches.
Our dwell-time analysis revealed that the macroscopic (P o) current sensitivity to ATP of Flag-cut-ΔR and of partially phosphorylated WT channels results from a Michaelis-type dependence of opening rate on [ATP], while closing rates were altered relatively little (Fig. 5B and Fig. C; compare Venglarik et al. 1994; Winter et al. 1994). This differs from a report (Zeltwanger et al. 1999) demonstrating longer bursts at higher [ATP], though in presumed highly phosphorylated WT CFTR channels. The present data can be interpreted in terms of Fig. 1 by assuming that rate k 2 is very small in partially phosphorylated WT channels, so that most openings close from O1 directly to C1 with rate k −1, which is independent of [ATP]. This would account for the short burst durations of ∼250 ms of WT channels after PKA removal (Fig. 3 C and 8; and Table ).
If opening rate r CO depends on [ATP] through r CO=r CO,max·ATPATP+K rCO,while closing rate r OC is independent of [ATP], then a similar Michaelis-type dependence ensues for P o vs. [ATP], P o = P o,max · [ATP]/([ATP] + K Po,where, P o,max = r CO,max/(r CO,max + r OC) and K Po=K rCO·r OC r CO,max+r OC.This K 0.5, as measured by P o, is hence expected to be somewhat smaller than the K 0.5 measured by opening rate. In the above conditions (i.e., after PKA removal), however, with r CO,max ∼ 0.35 s−1 and r OC ∼ 3–4 s−1 (Table ), these relations predict K Po≈K rCO,in reasonable agreement with the data (Fig. 4 C and 5 B), considering the errors in the kinetic measurements. From Fig. 1, K rCO= (k off,ATP + k 1)/k on,ATP. Thus, K rCO(and hence K Pois expected to be close to the real affinity (K d = k off,ATP/k on,ATP) of NBD1 for ATP, only if ATP binding at NBD1 is in rapid equilibrium compared with the subsequent step that rate-limits channel opening (k off,ATP >> k 1). In any case, since k 1 in the experiments to estimate apparent affinity was comparable for all constructs (∼0.35 s−1; after PKA removal for WT and 835+837, but before PKA exposure for cut-ΔR and Flag-cut-ΔR), the observed differences in K rCO K Pomay, at least, be expected to reflect parallel changes in K d.
Phosphorylation Dependence of Channel Activity for the Severed Constructs
The inactivity of dephosphorylated WT CFTR channels has been attributed to inhibition of gating by the unphosphorylated R domain, since ΔR(708-835)CFTR channels, missing much of the R domain, were active without phosphorylation (Rich et al. 1991, Rich et al. 1993; Ma et al. 1997). Consistent with that finding, cut-ΔR and Flag-cut-ΔR channels in excised patches were active in just MgATP, before exposure to PKA (Fig. 2 D and E, and 3, A and B). This activity, not seen for WT channels (Fig. 2 A and 3 A), is inferred to reflect constitutive, PKA-independent, channel function because it persisted in patches excised from oocytes preinjected with RpcAMPS (Fig. 2 E), an inhibitor of PKA, which suppressed activity of WT, but not of Flag-cut-ΔR, channels in resting oocytes (Fig. 1). For severed channels with no R domain, this constitutive activity corresponded to a P o of ∼0.13 (Fig. 3 B; and Table ), roughly 35% of the P o of WT channels in the presence of PKA (∼0.36). 835+837 channels, cut near the COOH terminus of the R domain, were also active before phosphorylation (Fig. 2, C–E, and 3, A and B), but far less so, corresponding to a basal P o of ∼0.04 (Fig. 3 B; and Table ). 633+634 channels showed no phosphorylation-independent activity (Fig. 2 B and 3 A). On the basis of Fig. 1, these effects at high [MgATP] are interpreted as a dependence of rate k 1 on phosphorylation: k 1 = 0 in dephosphorylated WT (and 633+634) channels; i.e., the rate-limiting step after ATP binding is inhibited by the unphosphorylated R domain. This inhibition is partially relieved by a cut close to the COOH terminus of the R domain and, presumably, completely relieved in severed channels with no R domain, or in WT channels by full phosphorylation of the R domain.
No Evidence for Stimulatory Action of Phosphorylated R Domain
On top of the R domain's inhibitory effect when dephosphorylated, a stimulatory influence when phosphorylated was proposed based on a stimulation of ΔR(708-835) channels by phosphorylated R-domain peptides, ascribed to an increase in channel opening rate (Ma et al. 1997; Winter and Welsh 1997). However, in the absence of the phosphopeptide, the opening rate of ΔR(708-835)-S660A, with or without PKA, was only ∼30% that of phosphorylated WT, and increased only to ∼45% of the latter, even in the presence of the phosphopeptide (Winter and Welsh 1997; compare Ma et al. 1997). Here, cut-ΔR and Flag-cut-ΔR channels both had opening rates in the presence of PKA indistinguishable from that of phosphorylated WT channels (Fig. 3 D; and Table ), arguing against any stimulatory effect of the phosphorylated R domain in WT. The much lower opening rate of ΔR(708-835) channels, compared with WT or cut-ΔR, suggests that linking residues 707 and 836, which in WT channels might be far away from each other in space, impairs channel structure, and hence function; in which case, addition of an exogenous R domain might help normalize channel structure. Indeed, in preliminary tests, injection of 2.5 ng cRNA encoding ΔR(708-835) CFTR did not elicit any measurable conductance in oocytes, although in excised patches single channels with very low activity were occasionally observed (with 5 ng cRNA), implying inefficient processing of those channels under our conditions. By contrast, effectively severing ΔR(708-835) by coexpressing segments Flag3-707 plus 837-1480 (2.5 ng cRNA each) resulted in robust currents in resting unstimulated oocytes (conductance, 167 ± 7 μS, n = 6), supporting the conclusion that the linkage, per se, rather than the precise boundaries of the deletion, caused the low P o and poor expression of single-chain ΔR(708-835) in oocytes.
Cut-ΔR Channels Still Respond to PKA
Surprisingly, cut-ΔR and Flag-cut-ΔR channels were stimulated by 30–50% upon exposure to PKA (Fig. 2D and Fig. E, Fig. 3A and Fig. B, and Fig. 6D and Fig. E; and Table ) to a P o of ∼0.2, due to a near doubling of their opening rate, which closely approached that of WT in the presence of PKA (Fig. 3 D; and Table ). This activation is intriguing, because the effect of PKA on CFTR has generally been attributed to phosphorylation of serine residues within the R domain, based on both biochemical and functional evidence: CNBr cleavage and peptide mapping experiments on CFTR protein prephosphorylated by PKA with γ-32P ATP found no evidence for phosphorylation outside the R domain (Cheng et al. 1991; Picciotto et al. 1992; Seibert et al. 1995), and PKA no longer stimulated ΔR(708-835) channels after mutation of serine 660 [ΔR(708-835)-S660A, Rich et al., 1993; compare Ma et al., 1997]. However, from a methionine map of CFTR, full CNBr cleavage might be expected to generate many small fragments (several <10 amino acids long), some including serines, and phosphorylation of such short fragments is unlikely to be detected by standard SDS-PAGE. Also, lack of response of ΔR(708-835)-S660A channels to PKA could reflect steric constraints introduced by linking residue 707 to 836. So, at present, phosphorylation of CFTR by PKA on a site outside the R domain cannot be ruled out, and could account for the PKA-mediated stimulation of channel activity seen here for cut-ΔR and Flag-cut-ΔR channels. Preliminary data from autoradiograms of Flag-cut-ΔR CFTR, coimmunoprecipitated by an anti–Flag M2 antibody and incubated in vitro with PKA and γ-32P ATP, suggest that PKA can phosphorylate those channels. But more work will be needed to identify the site(s) phosphorylated and address their in vivo significance. Their phosphorylation notwithstanding, our observed stimulation by PKA of split channels with no R domain could still reflect phosphorylation of ancillary proteins in the patch that somehow modulate cut-ΔR CFTR gating.
No Influence of Flag Epitope on Cut-Δ-R Channel Gating
In related experiments, we've found that attaching the eight-residue Flag epitope to the NH2 terminus of WT CFTR, or of CFTR channels severed near either boundary of NBD1, selectively lowered the channel opening rate two- to threefold (Chan et al. 2000). In contrast, Flag-cut-ΔR showed functional characteristics similar to those of cut-ΔR, which lacked the Flag (e.g., Fig. 3, Fig. 4, Fig. 6, and Fig. 8; and Tables I–III). Interestingly, a likely α-helical section of CFTR's NH2 terminus (within residues 46–60) was recently reported to bind to the R domain, and enhance channel activity (Naren et al. 1999): point mutations in that stretch of amino acids impaired the gating of WT (an effect apparently on channel closing rate), but not of ΔR(708-835)-S660A, channels. It is thus tempting to speculate that our NH2-terminal Flag epitope slowed CFTR channel opening by interfering with the interaction between the helical region and the R domain, perhaps impairing phosphorylation or the gating response to phosphorylation.
Dependence on Phosphorylation of Mean Length and Distribution of Burst Durations
In the presence of PKA, all severed constructs in this study had shorter mean burst durations than WT channels (Fig. 3 C, striped bars). But the underlying mechanism seemed different for 633+634 channels, in which locking behavior mimicked WT, than for the others, in which locking was altered. This grouping was supported by the distributions of burst durations. WT and 633+634 channels displayed uniform populations of bursts both in the presence of, and shortly after removing, PKA, with long lifetimes in PKA (somewhat reduced for 633+634), and short lifetimes after its removal (Fig. 8, top). These findings are explained by Fig. 1 if k −1 is similar (∼4 s−1) for both channels, and for both k 2 (reflecting ATP binding to NBD2) is similarly low in the absence and similarly high in the presence of PKA, but k 3 is somewhat faster for 633+634 than for WT. Together with a similarly small k −2, this scheme also accounts for the similar locking behavior of the two constructs (Table ), despite different mean burst durations. In contrast, the burst durations of 835+837, cut-ΔR, and Flag-cut-ΔR channels were little affected by PKA (Fig. 3 C; and Table ), and displayed double-exponential distributions indicating mixtures of two populations of bursts with different lifetimes. Interestingly, the two time constants in each case roughly matched the lifetimes of WT bursts with and without PKA (Fig. 8, bottom). Such behavior is predicted by Fig. 1 if k 2 is small, though not zero (as indicated by the locking with AMPPNP; Table ), but not altered much by PKA. Since, at least in 835+837 channels, the R domain still seems responsive to phosphorylation (judging from the severalfold stimulation of opening rate by PKA; Fig. 3 D, Table ), it seems likely that access to the ATP-binding site responsible for long bursts (presumably NBD2) is impaired by severing the backbone near the COOH terminus of the R domain. Deletion of the entire R domain (in cut-ΔR and Flag-cut-ΔR channels) did not further alter the duration or distribution of bursts.
For k 2 small (but not zero), Fig. 1 implies that mean burst durations should increase with [ATP], whereas those of Flag-cut-ΔR channels did not (Fig. 5 C), which suggests that the (presumably compound) transition from O1 to O2 in those channels is rate limited by something other than ATP binding (perhaps dissociation of ADP from NBD2; see Gadsby and Nairn 1999; Zeltwanger et al. 1999).
Caution is warranted in interpreting burst-duration distributions obtained by pooling data from several patches, despite their consistency with the macroscopic unlocking results. It is hard to exclude the possibility that the distributions and macroscopic data both reflect mixtures of the behaviors of functionally different channels, rather than the complex behavior of individual channels. An extreme possibility is that 835+837, cut-ΔR, and Flag-cut-ΔR constructs all give rise to two distinct channel populations, one behaving (with respect to NBD2 function) like WT in the presence of, the other like WT in the absence of, but neither population being affected by, PKA. While this seems unlikely, because short and long bursts were readily seen in individual single-channel records for these constructs, the extracted relative fractions of the two populations could be inaccurate, due to unpredictable bias introduced by differing impacts of records of unequal length, expected to scale with the number of contributed events. Nevertheless, the qualitative information derived from the pooled distributions is likely valid.
Locking of Severed Channels in the Open State by AMPPNP
AMPPNP added with ATP can lock WT CFTR channels in the open state (Gunderson and Kopito 1994; Hwang et al. 1994; Carson et al. 1995), an effect attributed to tight binding of AMPPNP to NBD2, because similar prolonged open bursts result from mutations of the Walker A lysine, K1250, at NBD2 (Carson et al. 1995; Gunderson and Kopito 1995). WT channels may be locked open only when they are highly phosphorylated (Hwang et al. 1994; Mathews et al. 1998a), consistent with the proposed increase in k 2 upon phosphorylation.
AMPPNP, in the presence of ATP, also enhanced the currents of all severed CFTR channels tested, and elicited a slowly relaxing component in the current decay on nucleotide removal (Fig. 6) due to prolonged bursts (Fig. 7). Similar results were obtained for all constructs when PPi replaced AMPPNP (compare Csanády et al. 1999; Chan et al. 2000). If the prolonged bursts reflect AMPPNP occupancy of the site that stabilizes the open state (presumably NBD2), then, since AMPPNP cannot be hydrolyzed (i.e., k 3 = 0), Fig. 1 predicts that the time constant of the slowly decaying current component is given by 1/k −2. The faster rates measured for 835+837, cut-ΔR, and Flag-cut-ΔR channels, in comparison with WT or 633+634 channels (Fig. 6 and Fig. 7; and Table ), suggest more rapid dissociation, and hence a destabilized binding site for AMPPNP, caused by severing near the COOH terminus of the R domain. The fractional amplitude of the slow component gives the approximate fraction of open channels that, in the steady state, have AMPPNP bound at NBD2. Though faster than WT, the dissociation of AMPPNP from 835+837, cut-ΔR, and Flag-cut-ΔR channels is still too slow to account for the much smaller fractional amplitude of their slow component (Table ), which may thus be attributed to their reduced k 2. These effects on k 2 and k −2 indicate relative inaccessibility and structural instability of NBD2 in the channels cut after the R domain.
Nevertheless, the clear demonstration that severed channels with no R domain can be locked open by either AMPPNP (Fig. 6, Fig. 7, and Fig. 9) or PPi contrasts with their reported lack of effect on burst durations of ΔR(708-835) CFTR channels; PPi did not affect bursts even in the presence of phosphorylated R-domain peptide (Ma et al. 1997), suggesting severe destabilization of NBD2, possibly a further consequence of linking residues 707 and 836.
ATP Binding to NBD2 of Severed Channels Lacking an R Domain Is Supported by Prolonged Bursts of Cut-ΔR(K1250A)
Mutation of K1250 practically abolishes ATP hydrolysis in CFTR (Ramjeesingh et al. 1999), as does mutation of Walker-A lysines in other ABC transporters (e.g., Loo and Clarke 1994; Müller et al. 1996). In intact CFTR, the K1250A mutation results in extremely long open bursts, comparable with those seen with AMPPNP, interpreted as nonhydrolytic tight binding of ATP to NBD2 (Carson et al. 1995; Gunderson and Kopito 1995). If ATP can occupy NBD2 in severed CFTR channels with no R domain, then cut-ΔR(K1250A) channels ought to show prolonged bursts (like those induced by AMPPNP in cut-ΔR channels) whenever NBD2 binds ATP, since k 3 = 0. This expectation was confirmed (Fig. 10 A), and corroborated by the correspondingly slow relaxation of quasi-macroscopic currents after withdrawal of ATP (Fig. 10 B). The large fraction of prolonged openings in cut-ΔR(K1250A) channels seems paradoxical, because only a small fraction of the bursts of cut-ΔR channels belonged to the slow component of the distribution (Fig. 8), implying that few bursts involved binding of ATP to the stabilizing site. Intriguingly, the same paradox seems to apply to intact K1250A CFTR channels, which also showed predominantly long openings under conditions where WT channels were only inefficiently locked by AMPPNP (see Carson and Welsh 1993; Carson et al. 1995).
Despite technical difficulties, such as excessive numbers of flickery closures coupled with the small overall number of bursts recorded, the distribution of cut-ΔR(K1250A) burst durations indicated a mixture of two populations, both with lifetimes longer than the corresponding populations for cut-ΔR channels (Fig. 10 C). According to Fig. 1, the slower components of those distributions reflect k 3 for cut-ΔR channels, but k −2 for cut-ΔR(K1250A) channels. But the observation that the faster component was approximately fivefold prolonged for cut-ΔR(K1250A) channels, if correct, suggests that rate k −1 is also slowed in these channels, which would provide, during each burst, a longer time window for ATP to bind to NBD2. Strictly, an invariant slower k −1 would predict bursts at very low [ATP] longer than the ∼250-ms bursts seen for WT channels in the absence of PKA. However, intact K1250A CFTR channels showed brief (∼200-ms) bursts at 10 μM ATP comparable with WT (Zeltwanger et al. 1999), and we occasionally saw comparably brief reopenings of cut-ΔR(K1250A) channels in macropatches during ATP washout, when [ATP] was extremely low. In any event, an influence of the Walker-A mutation on more than one rate constant is not unexpected, since cut-ΔR(K1250A) channels were also ∼10-fold slower in opening (τib = 25 ± 12 s in the absence of PKA, n = 4) than cut-ΔR channels (τib = 3.1 ± 0.7 s in the absence of PKA, n = 18; Table ), just like full-length K1250A CFTR channels, which reportedly open far more slowly than WT (Carson et al. 1995). Propagated effects of the Walker-A mutation on protein structure, or possible contribution of other regions to the catalytic sites (including from a second CFTR molecule in a putative dimer; see Zerhusen et al. 1999), might eventually explain this intriguing finding.
Strong Temperature Dependence of Gating of Constructs Severed at the COOH Terminus of the R Domain
The fairly large apparent enthalpic activation energy (∼75 kJ/mol, Q 10 ∼ 2.8; Table ) for closure of WT channels in PKA, roughly gauged from burst durations collected in two narrowly separated temperature pools (21°–23°C vs. 24°–26°C), agree with the more rigorous estimate (87 kJ/mol) made by Mathews et al. 1998b, who argued that it supports the notion that ATP hydrolysis controls channel closure. Apparent Q 10 values seemed even higher for 835+837, cut-ΔR, and Flag-cut-ΔR channels (Table ). But, with evidently more than one open state, Q 10 values of mean burst durations need not reflect the activation energy of a particular gating step. In Fig. 1, for instance, four rate constants (k −1, k 2, k −2, and k 3) control mean burst duration, and its temperature dependence is in general a complicated function of the temperature sensitivities of all four. For WT channels in PKA, though, our data are consistent with a very fast rate k 2 (compared with k −1) and a slow rate k −2 (compared with k 3). The closing rate thus approximates k 3, and the apparent Q 10 of channel closure may then reflect just that step (likely limited by ATP hydrolysis at NBD2).
For 835+837, cut-ΔR, and Flag-cut-ΔR channels, however, our data are consistent with Fig. 1 with k 2 small, comparable with k −1, resulting in a mixture of O1 → C1 and O1 → O2 → C1 bursts. Changes in mean burst duration with temperature may then arise from changes not only in lifetimes, but also in the relative frequencies, of these two burst populations. Thus, the mean burst durations would shorten at higher temperatures if the (already small) rate k 2 increased more slowly than k −1 with temperature, resulting in an even smaller fraction of the longer O1 → O2 → C1 bursts. So our findings with severed constructs 835+837, cut-ΔR, and Flag-cut-ΔR could be explained if higher temperatures compromise the stability (or accessibility) of NBD2 in those channels. This interpretation is supported by the locking behavior of those channels, which shows infrequent locking at 24°C (Fig. 6, C–E), but increased fraction of locked cut-ΔR and Flag-cut-ΔR channels after cooling to 20°C (Fig. 9).
In sharp contrast to the data of Mathews et al. 1998b, and those presented here, the closing rate of phosphorylated WT CFTR channels examined in lipid bilayers was found to be only weakly temperature dependent, with a Q 10 of ∼1.1 and apparent activation energy of ∼10 kJ/mol (Aleksandrov and Riordan 1998). However, the mean burst durations in that study (220 ms at 23°C) were comparable with those found here for partially phosphorylated WT channels in the absence of PKA (264 ms; Fig. 3 C; Table ), interpreted as representing mostly O1 → C1 type bursts. Possibly, in terms of Fig. 1, k 2 was small in the experiments of Aleksandrov and Riordan 1998, and the observed Q 10 of channel closure reflects the smaller activation energy of rate k −1.
Interpretation of Kinetic Observations by fits to a Gating Scheme
Fig. 1 was adopted for semi-quantitative interpretation of the parameters estimated from fits to macroscopic current relaxations, and from steady state kinetic analysis of records with one channel (or a few) for WT and all severed CFTR channels. From Fig. 1, the opening rate at saturating [ATP] (r CO,max) gives k 1; i.e., k 1 = 1/τib. If the closing rate r OC does not depend on [ATP] (Fig. 5), and r OC >> r CO,max (an approximation likely to hold both for the split channels and for WT after removing PKA), then K rCO≅K Po(see above). Depending on k off,ATP, K rCOis ≥ K d for step C1 → C2; but changes in K rCO K Powill parallel changes in K d, as long as k 1 is unaltered (k 1 was ∼0.35 s−1 for all constructs under the conditions used for ATP apparent affinity tests). The remaining four rate constants, k −1, k 2, k −2, and k 3, determine observable parameters related to the open state, such as mean burst duration (τb), distribution of burst durations (characterized by short and long time constants τsh and τl, and fractional amplitudes a sh and a l, where a sh + a l = 1), slow decay time constant after AMPPNP removal (τAMPPNP), and fractional amplitude of that slowly decaying component (a locked). τsh, τl, a sh, and a l are obtained by calculating the survivor function, of the form surv t=a sh e −tτsh+a l e −tτl, for the set of states {O1, O2} (see Colquhoun and Hawkes 1981; Csanády 2000). τb is obtained either as the mean of that distribution, or by elementary combinatorics. These observable parameters depend on the rate constants as follows (see online supplemental material):
 |
1 |
 |
2 |
 |
3 |
 |
4 |
where D = (k −1 + k 2 + k −2 + k 3)2 − 4(k −1 k 3 + k −1 k −2 + k 2 k 3). To validate the use of multichannel patches and a fit to a C-O-B scheme (see methods) for estimating mean burst durations, Fig. 1 was extended by adding two brief blocked states, B1 and B2, communicating only with O1 and O2, respectively. When simulations of this extended scheme with multiple channels were fitted assuming the C-O-B scheme, the fit gave rate constants that predicted mean burst durations similar to those expected from (see online supplemental material).
To obtain the two parameters describing the slowly decaying current component after exposure to AMPPNP, the following simplifications were made. Because AMPPNP was applied at 10-fold excess over ATP (0.1 mM ATP plus 1 mM AMPPNP), all channels in state O2 were assumed to have AMPPNP (not ATP) bound at NBD2. As AMPPNP cannot be hydrolyzed, k 3 = 0, and a fraction k −2/(k 2 + k −2) of all open channels is expected to be in state O1, and the complementary fraction k 2/(k 2 + k −2) in O2, at steady state. (This assumption of an equilibrium between O1 and O2 may not strictly hold, if step O1 → O2 is irreversible; see evaluation of models, above.) When all nucleotides are then suddenly removed, k 1 and k 2 approach zero, and Fig. 1 reduces to:
 |
Solving the differential equation describing this scheme, with initial conditions given by the above steady state occupancies of O1 and O2, the time course of the current decay is obtained as the sum of O1(t) and O2(t). The normalized current decay is a double exponential (see online supplemental material), with slower time constant:
 |
5 |
with fractional amplitude:
 |
6 |
Note, a locked is not exactly equal to, but approximates, the fraction of open channels locked at steady state, as long as k −1 >> k −2. The time constant of the fast component, predicted to be 1/k −1, was not used since it was comparable with the solution exchange time.
Fig. 11 shows fits to Fig. 1 of the six (free) observable parameters measured in the presence of PKA for WT CFTR and the cut channels. The set of rate constants that provided the most reasonable overall fit to the set of observed parameters is printed on the schemes for each construct, and the observed and predicted ( ) parameters are compared on the right. Instead of K d for the equilibrium between C1 and C2, K Povalues are printed (measured without PKA).
Figure 11.
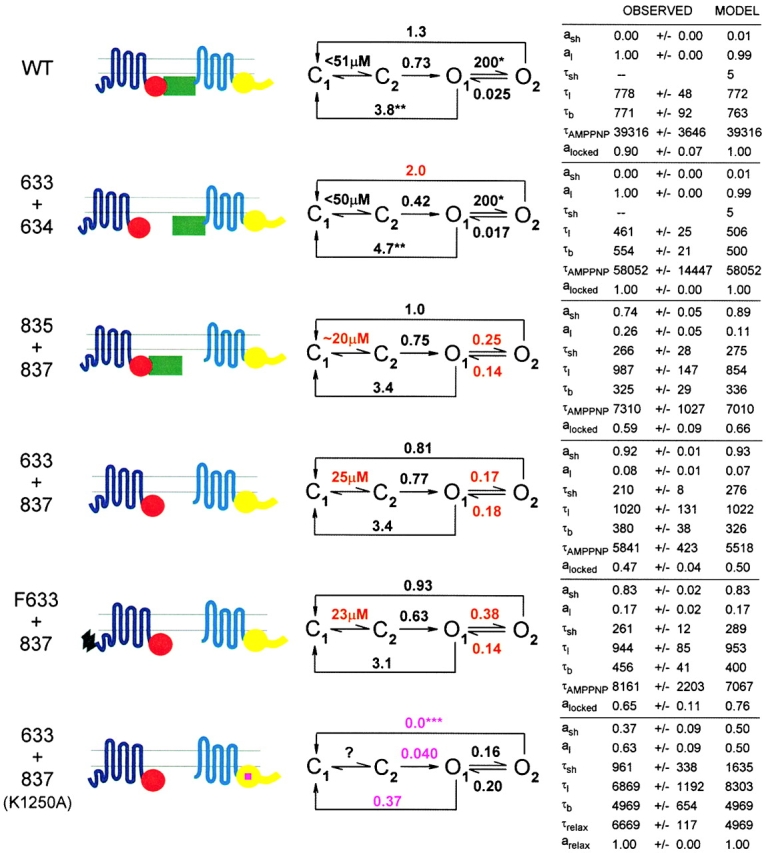
Model fit, using Fig. 1, to results from WT and severed CFTR channels in the presence of PKA. The set of rate constants (s−1) giving the closest overall fit to the indicated set of observed parameters is printed on Fig. 1 for each construct (rounded to two significant digits); measured and predicted parameters are compared on the right. Parameters a sh, a l, τsh, and τl are fractional amplitudes and time constants of exponential components describing the distributions (Fig. 8) of burst durations (note a l = 1 − a sh is not a free parameter); τb is mean burst duration, measured in the presence of PKA for WT and 633+634, or pooled from all experiments for 835+837, cut-ΔR (633+837), and Flag-cut-ΔR (F633+837); τAMPPNP and a locked are the time constant and fractional amplitude of the slowly relaxing macroscopic current component after removal of AMPPNP and ATP (see Table ); τrelax and a relax, analogous, after just ATP, for cut-ΔR(K1250A) [633+837(K1250A); Fig. 10 B]. For step C1 ↔ C2, K Pois printed instead of K d. Errors for observed parameters a sh, a l, τsh, and τl are half-widths of 0.5 unit likelihood intervals, calculated separately for each parameter (reasonably symmetric around the optimum, given the numbers of fitted events); for τb, τAMPPNP, and a locked errors are ±SEM. The value of k 1 was obtained as the reciprocal of τib in the presence of 2 mM MgATP and PKA (except for cut-ΔR(K1250A) channels, for which all data were obtained in the absence of PKA; apparent affinity was not measured for this construct). *Rate k 2 for WT and 633+634 may be much lower than 200 s−1. From simulations, k 2 > 20 s−1 is large enough to account for the apparently uniform distribution of burst durations of these two constructs in the presence of PKA. **Rate k −1 for WT and 633+634 channels was fixed to the reciprocal of the mean burst duration observed after removal of PKA, on the assumption that k 2 << k −1 under those conditions. ***Rate k 3, representing a compound step including ATP hydrolysis at NBD2, was set to zero for cut-ΔR(K1250A).
For WT and 633+634 channels, k −1 was fixed to the inverse of the burst durations measured in the absence of PKA, assuming that under those conditions k 2 << k −1. Because no short component could be resolved in the burst durations of the same two constructs in the presence of PKA, a very high k 2 of ∼200 s−1 optimized the fit by causing the fractional amplitude of the predicted brief component to vanish. In practice, for k 2 higher than ∼20 s−1, the brief component was already at the detection limit, as shown by simulations of Fig. 1, followed by analysis identical to that used for the real data. In particular, simulating ∼500 openings for Fig. 1, with rate constants as shown in Fig. 11 for WT, but using k 2 = 40 or 20 s−1, gave two components in the distribution of openings, readily detectable by subsequent analysis. However, since, in real data, flickery closures are also present, necessitating burst analysis, Fig. 1 was modified by including brief closed states B1 and B2, linked to O1 and O2, respectively (see above), via typical rate constants r O1,B1 = r O2,B2 = 3 s−1, r B1,O1 = r B2,O2 = 100 s−1. After simulation of ∼500 bursts, burst analysis was performed using a cut-off of 50 ms to exclude flickery closures. Fig. 1 with rate constants like those for WT (Fig. 11), but k 2 = 20 s−1, predicts τsh = 42 ms, τl = 771 ms, a sh = 0.11, and a l = 0.89 for the time constants and fractional amplitudes of the survivor function of open times. Indeed, when the distribution of bursts obtained from a simulation including flickers was fitted with the sum of two exponentials, the fit converged to parameters τsh = 35 ms, τl = 712 ms, a sh = 0.11, and a l = 0.89, and the logarithm of the likelihood was ∼20 units higher than that of a single-exponential fit. When the same simulation was repeated with k 2 = 40 s−1, followed by burst analysis as above, a double-exponential fit found parameters τsh = 12 ms, τl = 846 ms, a sh = 0.03, and a l = 0.97 (for predicted parameters, τsh = 23 ms, τl = 771 ms, a sh = 0.06, and a l = 0.94), but the likelihood was only three log units higher than that of a single-exponential fit, indicating no significant improvement by assuming a second component. Thus, as expected, burst analysis, necessitated by inclusion of flickery closures, decreased the sensitivity of detection of subsequent fitting. Hence, only a lower estimate of k 2 > ∼20 s−1 could be established with confidence for WT and 633+634 channels in PKA. The fact that a mixture of two components in the distribution of bursts was never observed for WT (nor 633+634) suggests that the transition of rate k 2, from a value >20 s−1 in the presence of PKA to a value << k −1 after removal of PKA, occurred very rapidly, consistent with the observed rapid decline in P o within 3–5 s (Fig. 2A and Fig. B), such that the transition period was too short to be detected.
For 835+837, cut-ΔR, and Flag-cut-ΔR channels, the printed rate constants are those representative of the behavior in the presence of PKA, as reflected by their opening rate (k 1). However, as there was no discernible effect of PKA on their burst durations (Fig. 3 C), the six measured parameters used for the fit to Fig. 1 are averages of values obtained with and without PKA.
For cut-ΔR(K1250A) channels, all parameters were measured in the absence of PKA. k 3 = 0 was assumed for this construct, since this rate represents a (compound) step including ATP hydrolysis at NBD2, and hence the action of ATP at NBD2 is expected to be analogous to that of AMPPNP at NBD2 of WT channels, and so τrelax and a relax (from the current decay on removing ATP) were substituted for τAMPPNP and a locked.
The numerical values of the rates should be taken as, at best, a qualitative description, because of experimental limitations (variability, temperature effects, etc.) and simplifying assumptions (e.g., on and off rates at NBD2 were assumed identical for AMPPNP and ATP). Nevertheless, several interesting comparisons can be made. 633+634 seems almost identical to WT, except for a less than twofold increase in rate k 3, accounting for shortened bursts. (The apparent lower rate k 1 reflects collection of all 633+634 data in the lower temperature pool, ∼22°C; opening rates were not significantly different from WT when compared at the same temperatures; see Chan et al. 2000.) Since a twofold change in rate corresponds to a change in activation energy of <1 kT, it may be concluded that the cut between residues 633 and 634 has very little effect on gating, and, likely, on channel structure. On the other hand, constructs 835+837, cut-ΔR, and Flag-cut-ΔR differed from WT by a decrease of at least two orders of magnitude of the rate k 2, and a more than fivefold increase in k −2, corresponding to changes in activation energy of >5 kT for the on rate and ∼1.6 kT for the off rate, consistent with a structural destabilization of the second ATP binding site (NBD2) caused by the cut before residue 837. Smaller extrapolated K d values for the C1 ↔ C2 step for these same constructs (Fig. 4 and Fig. 11) suggest increased affinities for ATP at NBD1, compared with partially phosphorylated WT (or 633+634) channels. Comparing cut-ΔR(K1250A) with cut-ΔR, the fit for the Walker-A mutant predicted nucleotide on and off rates at NBD2 (k 2 and k −2) similar to those of cut-ΔR. However, to account for the observed distribution of bursts of the Walker mutant, k −1 had to be slowed by an order of magnitude compared with cut-ΔR channels, which, together with a similar decrease in opening rate (compare k 1 with basal opening rate of cut-ΔR), calls into question either the assumed local nature of the effect on channel structure of the Walker-A point mutation, or all gating models in which the influence of ATP hydrolysis at NBD2 is limited to channel closure.
Summary and Conclusions
Functional characterization of WT, and of CFTR channels severed just N- and/or C-proximal to the R domain, was used to shed light on the mechanism by which the R domain interacts with the NBDs to gate CFTR channels. The results support the following model. The unphosphorylated R domain inhibits opening of WT channels by interfering both with nucleotide binding at NBD1 and with the subsequent rate-limiting step for channel opening. The inhibitory influence on ATP binding, normally relieved through phosphorylation, depends on physical linkage of the R domain to residues following 837, because channels cut between residues 835 and 837 display a high affinity for ATP even in the absence of PKA (Fig. 4 D). The inhibition of the post-binding step also partially depends on the same linkage, because partial disinhibition is observed in split channels 835+837, signaled by their opening at a low rate (of ∼0.1 s−1) in the presence of ATP before exposure to PKA (Fig. 2 and Fig. 3). Both types of inhibition are lost in cut channels with no R domain (cut-ΔR and Flag-cut-ΔR), resulting in a high apparent affinity for ATP (Fig. 4) and relatively rapid channel opening (∼0.35 s−1; Fig. 3 D; and Table ) without phosphorylation by PKA. The stimulatory effect of PKA on the rate-limiting step for CFTR channel opening is only partially due to disinhibition by R-domain phosphorylation, and could also involve phosphorylation event(s) outside the R domain, because the opening rate of cut channels without an R domain is further accelerated approximately twofold by PKA (to ∼0.7 s−1, comparable with that of strongly phosphorylated WT; Fig. 2, Fig. 3, and Fig. 6). This similarity in the maximal opening rates of cut channels with no R domain and of phosphorylated WT channels refutes the proposed stimulatory effect of the phosphorylated R domain on CFTR opening rate.
Binding of ATP to NBD2 also seems inhibited by the unphosphorylated (or partially phosphorylated) R domain in WT channels, resulting in short open bursts (Fig. 3 C and 8), and impaired locking by AMPPNP (Hwang et al. 1994). Cut-ΔR channels seem capable of binding ATP at NBD2, evident from the locking effect of AMPPNP [and from the prolonged openings of cut-ΔR(K1250A) channels], but the affinity of this binding site for nucleotide seems considerably lower than in phosphorylated WT channels (Fig. 6 Fig. 7 Fig. 8, and Fig. 10). Although this could reflect loss of a stimulatory influence of the phosphorylated R domain, a more likely explanation is that the cut before residue 837 destabilizes NBD2 structure: this is supported by the similarly decreased nucleotide affinity of NBD2 in 835+837 channels (Fig. 6 and Fig. 8), which contain an R domain capable of at least partial function (compare substantially lower basal opening rate of these channels compared with cut-ΔR, and large response to PKA; Fig. 2 and Fig. 3).
We have presented an initial broad description of the gating characteristics of CFTR channels with and without an R domain, and provided an internally consistent framework for rationalizing them and for planning further experiments. The information extracted from these measurements allows some preliminary insight into how structural interactions among CFTR's intracellular domains might be linked to various gating steps, and how those interactions might be modulated by phosphorylation.
Supplemental Material
Acknowledgments
We thank Dr. David Dawson for the CFTR K1250A clone, Atsuko Horiuchi and Peter Hoff for technical assistance, and Kate Hall for help with the preparation of the manuscript.
L.Csanády is a William O'Baker Graduate Fellow of The Rockefeller University. This work was supported by National Institutes of Health grant DK-51767.
Luis Reuss served as guest editor.
Footnotes
Abbreviations used in this paper: ABC, ATP-binding cassette; C-O-B, closed-open-blocked; NBD, nucleotide binding domain; PPi, pyrophosphate; R, regulatory; WT, wild type.
The online version of this article contains supplemental material.
References
- Aleksandrov A.A., Riordan J.R. Regulation of CFTR ion channel gating by MgATP. FEBS Lett. 1998;431:97–101. doi: 10.1016/s0014-5793(98)00713-3. [DOI] [PubMed] [Google Scholar]
- Ball F.G., Sansom M.S.P. Ion-channel gating mechanismsmodel identification and parameter estimation from single channel recordings. Proc. R. Soc. Lond. B Biol. Sci. 1989;236:385–416. doi: 10.1098/rspb.1989.0029. [DOI] [PubMed] [Google Scholar]
- Berkower C., Michaelis S. Mutational analysis of the yeast a-factor transporter STE6, a member of the ATP binding cassette (ABC) protein superfamily. EMBO (Eur. Mol. Biol. Organ.) J. 1991;10:3777–3785. doi: 10.1002/j.1460-2075.1991.tb04947.x. [DOI] [PMC free article] [PubMed] [Google Scholar]
- Carson M.R., Welsh M.J. 5′-adenylylimidodiphosphate does not activate CFTR chloride channels in cell-free patches of membrane. Am. J. Physiol. Lung Cell. Mol. Physiol. 1993;265:L27–L32. doi: 10.1152/ajplung.1993.265.1.L27. [DOI] [PubMed] [Google Scholar]
- Carson M.R., Travis S.M., Welsh M.J. The two nucleotide-binding domains of cystic fibrosis transmembrane conductance regulator (CFTR) have distinct functions in controlling channel activity. J. Biol. Chem. 1995;270:1711–1717. doi: 10.1074/jbc.270.4.1711. [DOI] [PubMed] [Google Scholar]
- Chan K.W., Csanády L., Seto-Young D., Nairn A.C., Gadsby D.C. Severed molecules functionally define the boundaries of the cystic fibrosis transmembrane conductance regulator's NH2-terminal nucleotide binding domain. J. Gen. Physiol. 2000;116:163–180. doi: 10.1085/jgp.116.2.163. [DOI] [PMC free article] [PubMed] [Google Scholar]
- Chang X.-B., Tabcharani J.A., Hou Y.-X., Jensen T.J., Kartner N., Alon N., Hanrahan J.W., Riordan J.R. Protein kinase A (PKA) still activates CFTR chloride channel after mutagenesis of all 10 PKA consensus phosphorylation sites. J. Biol. Chem. 1993;268:11304–11311. [PubMed] [Google Scholar]
- Cheng S.H., Rich D.P., Marshall J., Gregory R.J., Welsh M.J., Smith A.E. Phosphorylation of the R domain by cAMP-dependent protein kinase regulates the CFTR chloride channel. Cell. 1991;66:1027–1036. doi: 10.1016/0092-8674(91)90446-6. [DOI] [PubMed] [Google Scholar]
- Colquhoun D., Hawkes A.G. On the stochastic properties of single ion channels. Proc. R. Soc. Lond. B Biol. Sci. 1981;211:205–235. doi: 10.1098/rspb.1981.0003. [DOI] [PubMed] [Google Scholar]
- Colquhoun D., Hawkes A.G. The principles of stochastic interpretation of ion-channel mechanisms. In: Sakmann B., Neher E., editors. Single Channel Recording. 2nd ed. Plenum Publishing Corp; New York, NY: 1995. pp. 433–434. [Google Scholar]
- Colquhoun D., Sigworth F.J. Fitting and statistical analysis of single-channel records. In: Sakmann B., Neher E., editors. Single Channel Recording. 2nd ed. Plenum Publishing Corp; New York, NY: 1995. pp. 558–560. [Google Scholar]
- Csanády L. Rapid kinetic analysis of multichannel records by a simultaneous fit to all dwell-time histograms. Biophys. J. 2000;78:785–799. doi: 10.1016/S0006-3495(00)76636-7. [DOI] [PMC free article] [PubMed] [Google Scholar]
- Csanády L., Chan K.W., Seto-Young D., Nairn A.C., Gadsby D.C. Coexpression of two halves of CFTR lacking the R domain results in near fully functional channels. Pediatr. Pulmonol. Suppl. 1999;19:174. [Google Scholar]
- Csanády L., Gadsby D.C. CFTR channel gatingincremental progress in irreversible steps. J. Gen. Physiol. 1999;114:49–53. doi: 10.1085/jgp.114.1.49. [DOI] [PMC free article] [PubMed] [Google Scholar]
- Dousmanis A.G., Nairn A.C., Gadsby D.C. Three functionally distinct phosphoforms of CFTR identified by patterns of single channel gating J. Gen. Physiol 108 1996. 11A(Abstr.) [Google Scholar]
- Dulhanty A.M., Riordan J.R. Phosphorylation by cAMP-dependent protein kinase causes a conformational change in the R domain of the cystic fibrosis transmembrane conductance regulator. Biochemistry. 1994;33:4072–4079. doi: 10.1021/bi00179a036. [DOI] [PubMed] [Google Scholar]
- Gadsby D.C., Nairn A.C. Regulation of CFTR channel gating. TIBS (Trends Biochem. Sci.). 1994;19:513–518. doi: 10.1016/0968-0004(94)90141-4. [DOI] [PubMed] [Google Scholar]
- Gadsby D.C., Nairn A.C. Control of CFTR channel gating by phosphorylation and nucleotide hydrolysis. Physiol. Rev. 1999;79:S77–S107. doi: 10.1152/physrev.1999.79.1.S77. [DOI] [PubMed] [Google Scholar]
- Gao M., Loe D.W., Grant C.E., Cole S.P.C., Deeley R.G. Reconstitution of ATP-dependent leukotriene C4 transport by co-expression of both half-molecules of human multidrug resistance protein in insect cells. J. Biol. Chem. 1996;271:27782–27787. doi: 10.1074/jbc.271.44.27782. [DOI] [PubMed] [Google Scholar]
- Gunderson K.L., Kopito R.R. Effects of pyrophosphate and nucleotide analogs suggest a role for ATP hydrolysis in cystic fibrosis transmembrane conductance regulator channel gating. J. Biol. Chem. 1994;269:19349–19353. [PubMed] [Google Scholar]
- Gunderson K.L., Kopito R.R. Conformational states of CFTR associated with channel gatingthe role of ATP binding and hydrolysis. Cell. 1995;82:231–239. doi: 10.1016/0092-8674(95)90310-0. [DOI] [PubMed] [Google Scholar]
- Higgins C.F. ABC transportersfrom microorganisms to man. Annu. Rev. Cell Biol. 1992;8:67–113. doi: 10.1146/annurev.cb.08.110192.000435. [DOI] [PubMed] [Google Scholar]
- Hwang T.C., Nagel G., Nairn A.C., Gadsby D.C. Regulation of the gating of cystic fibrosis transmembrane conductance regulator Cl channels by phosphorylation and ATP hydrolysis. Proc. Natl. Acad. Sci. USA. 1994;91:4698–4702. doi: 10.1073/pnas.91.11.4698. [DOI] [PMC free article] [PubMed] [Google Scholar]
- Ishihara H., Welsh M.J. Block by MOPS reveals a conformational change in the CFTR pore produced by ATP hydrolysis. Am. J. Physiol. Cell Physiol. 1997;273:C1278–C1289. doi: 10.1152/ajpcell.1997.273.4.C1278. [DOI] [PubMed] [Google Scholar]
- Jackson M.B., Wong B.S., Morris C.E., Lecar H., Christian C.N. Successive openings of the same acetylcholine receptor channel are correlated in open time. Biophys. J. 1983;42:109–114. doi: 10.1016/S0006-3495(83)84375-6. [DOI] [PMC free article] [PubMed] [Google Scholar]
- Kaczmarek L.K., Jennings K.R., Strumwasser F., Nairn A.C., Walter U., Wilson F.D., Greengard P. Microinjection of catalytic subunit of cyclic AMP-dependent protein kinase enhances calcium action potentials of bag cell neurons in cell culture. Proc. Natl. Acad. Sci. USA. 1980;77:7487–7491. doi: 10.1073/pnas.77.12.7487. [DOI] [PMC free article] [PubMed] [Google Scholar]
- Li C., Ramjeesingh M., Wang W., Garami E., Hewryk M., Lee D., Rommens J.M., Galley K., Bear C.E. ATPase activity of the cystic fibrosis transmembrane conductance regulator. J. Biol. Chem. 1996;271:28463–28468. doi: 10.1074/jbc.271.45.28463. [DOI] [PubMed] [Google Scholar]
- Loo T.W., Clarke D.M. Reconstitution of drug-stimulated ATPase activity following co-expression of each half of human P-glycoprotein as separate polypeptides. J. Biol. Chem. 1994;269:7750–7755. [PubMed] [Google Scholar]
- Ma J., Zhao J., Drumm M.L., Xie J., Davis P.B. Function of the R domain in the cystic fibrosis transmembrane conductance regulator chloride channel. J. Biol. Chem. 1997;272:28133–28141. doi: 10.1074/jbc.272.44.28133. [DOI] [PubMed] [Google Scholar]
- Mathews C.J., Tabcharani J.A., Chang X.-B., Jensen T.J., Riordan J.R., Hanrahan J.W. Dibasic protein kinase A sites regulate bursting rate and nucleotide sensitivity of the cystic fibrosis transmembrane conductance regulator chloride channel J. Physiol. 508 1998. 365 377a [DOI] [PMC free article] [PubMed] [Google Scholar]
- Mathews C.J., Tabcharani J.A., Hanrahan J.W. The CFTR chloride channelnucleotide interactions and temperature-dependent gating J. Membr. Biol. 163 1998. 55 66b [DOI] [PubMed] [Google Scholar]
- Müller M., Bakos É., Welker E., Váradi A., Germann U.A., Gottesman M.M., Morse B.S., Roninson I.B., Sarkadi B. Altered drug-stimulated ATPase activity in mutants of the human multidrug resistance protein. J. Biol. Chem. 1996;271:1877–1883. doi: 10.1074/jbc.271.4.1877. [DOI] [PubMed] [Google Scholar]
- Naren A.P., Cormet-Boyaka E., Fu J., Villain M., Block J.E., Quick M.W., Kirk K.L. CFTR chloride channel regulation by an interdomain interaction. Science. 1999;286:544–548. doi: 10.1126/science.286.5439.544. [DOI] [PubMed] [Google Scholar]
- Neville D.C.A., Rozanas C.R., Price E.M., Gruis D.B., Verkman A.S., Townsend R.R. Evidence for phosphorylation of serine 753 in CFTR using a novel metal-ion affinity resin and matrix-assisted laser desorption mass spectrometry. Prot. Sci. 1997;6:2436–2445. doi: 10.1002/pro.5560061117. [DOI] [PMC free article] [PubMed] [Google Scholar]
- Ostedgaard L.S., Rich D.P., DeBerg L.G., Welsh M.J. Association of domains within the cystic fibrosis transmembrane conductance regulator. Biochemistry. 1997;36:1287–1294. doi: 10.1021/bi962174s. [DOI] [PubMed] [Google Scholar]
- Picciotto M.R., Cohn J.A., Bertuzzi G., Greengard P., Nairn A.C. Phosphorylation of the cystic fibrosis transmembrane conductance regulator. J. Biol. Chem. 1992;267:12742–12752. [PubMed] [Google Scholar]
- Ramjeesingh M., Li C., Garami E., Huan L.-J., Galley K., Wang Y., Bear C.E. Walker mutations reveal loose relationship between catalytic and channel-gating activities of purified CFTR (cystic fibrosis transmembrane conductance regulator) Biochemistry. 1999;38:1463–1468. doi: 10.1021/bi982243y. [DOI] [PubMed] [Google Scholar]
- Rich D.P., Gregory R.J., Anderson M.P., Manavalan P., Smith A.E., Welsh M.J. Effect of deleting the R domain on CFTR-generated chloride channels. Science. 1991;253:205–207. doi: 10.1126/science.1712985. [DOI] [PubMed] [Google Scholar]
- Rich D.P., Berger H.A., Cheng S.H., Travis S.M., Saxena M., Smith A.E., Welsh M.J. Regulation of the cystic fibrosis transmembrane conductance regulator Cl− channel by negative charge in the R domain. J. Biol. Chem. 1993;268:20259–20267. [PubMed] [Google Scholar]
- Riordan J.R., Rommens J.M., Kerem B.S., Alon N., Rozmahel R., Grzelczak Z., Zielinski J., Lok S., Plavsic N., Chou J.L. Identification of the cystic fibrosis genecloning and characterization of complementary DNA. Science. 1989;245:1066–1073. doi: 10.1126/science.2475911. [DOI] [PubMed] [Google Scholar]
- Seibert F.S., Tabcharani J.A., Chang X.-B., Dulhanty A.M., Mathews C., Hanrahan J.W., Riordan J.R. cAMP-dependent protein kinase–mediated phosphorylation of cystic fibrosis transmembrane conductance regulator residue Ser-753 and its role in channel activation. J. Biol. Chem. 1995;270:2158–2162. doi: 10.1074/jbc.270.5.2158. [DOI] [PubMed] [Google Scholar]
- Seibert F.S., Chang X.-B., Aleksandrov A.A., Clarke D.M., Hanrahan J.W., Riordan J.R. Influence of phosphorylation by protein kinase A on CFTR at the cell surface and endoplasmic reticulum. Biochim. Biophys. Acta. 1999;1461:275–283. doi: 10.1016/s0005-2736(99)00163-7. [DOI] [PubMed] [Google Scholar]
- Sheppard D.N., Ostedgaard L.S., Rich D.P., Welsh M.J. The amino-terminal portion of CFTR forms a regulated Cl− channel. Cell. 1994;76:1091–1098. doi: 10.1016/0092-8674(94)90385-9. [DOI] [PubMed] [Google Scholar]
- Sheppard D.N., Welsh M.J. Structure and function of the CFTR chloride channel. Physiol. Rev. 1999;79:S23–S45. doi: 10.1152/physrev.1999.79.1.S23. [DOI] [PubMed] [Google Scholar]
- Townsend R.R., Lipniunas P.H., Tulk B.M., Verkman A.S. Identification of protein kinase A phosphorylation sites on NBD1 and R domains of CFTR using electrospray mass spectrometry with selective phosphate ion monitoring. Prot. Sci. 1996;5:1865–1873. doi: 10.1002/pro.5560050912. [DOI] [PMC free article] [PubMed] [Google Scholar]
- Venglarik C.J., Schultz B.D., Frizzell R.A., Bridges R.J. ATP alters current fluctuations of cystic fibrosis transmembrane conductance regulatorevidence for a three-state activation mechanism. J. Gen. Physiol. 1994;104:123–146. doi: 10.1085/jgp.104.1.123. [DOI] [PMC free article] [PubMed] [Google Scholar]
- Walker J.E., Saraste M., Runswick M.J., Gay N.J. Distantly related sequences in the α- and β-subunits of ATP synthase, myosin, kinases and other ATP-requiring enzymes and a common nucleotide binding fold. EMBO (Eur. Mol. Biol. Organ.) J. 1982;8:945–951. doi: 10.1002/j.1460-2075.1982.tb01276.x. [DOI] [PMC free article] [PubMed] [Google Scholar]
- Weinreich F., Riordan J.R., Nagel G. Dual effects of ADP and adenylylimidodiphosphate on CFTR channel kinetics show binding to two different nucleotide binding sites. J. Gen. Physiol. 1999;114:55–70. doi: 10.1085/jgp.114.1.55. [DOI] [PMC free article] [PubMed] [Google Scholar]
- Winter M.C., Sheppard D.N., Carson M.R., Welsh M.J. Effect on ATP concentration on CFTR Cl− channelsa kinetic analysis of channel regulation. Biophys. J. 1994;66:1398–1403. doi: 10.1016/S0006-3495(94)80930-0. [DOI] [PMC free article] [PubMed] [Google Scholar]
- Winter M.C., Welsh M.J. Stimulation of CFTR activity by its phosphorylated R domain. Nature. 1997;389:294–296. doi: 10.1038/38514. [DOI] [PubMed] [Google Scholar]
- Yount R.G. ATP analogs. Adv. Enzymol. 1975;43:1–565. doi: 10.1002/9780470122884.ch1. [DOI] [PubMed] [Google Scholar]
- Zeltwanger S., Wang F., Wang G.T., Willis K.D., Hwang T.C. Gating of cystic fibrosis transmembrane conductance regulator chloride channels by adenosine triphosphate hydrolysis. Quantitative analysis of a cyclic gating scheme. J. Gen. Physiol. 1999;113:541–554. doi: 10.1085/jgp.113.4.541. [DOI] [PMC free article] [PubMed] [Google Scholar]
- Zerhusen B., Zhao J., Xie J., Davis P.B., Ma J. A single conduction pore for chloride ions formed by two cystic fibrosis transmembrane conductance regulator molecules. J. Biol. Chem. 1999;274:7627–7630. doi: 10.1074/jbc.274.12.7627. [DOI] [PubMed] [Google Scholar]
Associated Data
This section collects any data citations, data availability statements, or supplementary materials included in this article.